| Param | Original file | Final file |
|---|---|---|
| Filename | modeM0/AS1T02_056T01_9000002210_14998cztM0_level2.evt | modeM0/AS1T02_056T01_9000002210_14998cztM0_level2_quad_clean.evt |
| Size (bytes) | 471,528,000 | 100,468,800 |
| Size | 449.7 MB | 95.8 MB |
| Events in quadrant A | 3,610,854 | 650,521 |
| Events in quadrant B | 3,665,478 | 658,053 |
| Events in quadrant C | 3,375,351 | 638,419 |
| Events in quadrant D | 3,170,451 | 625,858 |
| Mode M0 | |||
|---|---|---|---|
| Quadrant | BADHDUFLAG | Total packets | Discarded packets |
| A | 0 | 14872 | 2 |
| B | 0 | 15106 | 1 |
| C | 0 | 13972 | 1 |
| D | 0 | 14115 | 1 |
| Mode M9 | |||
|---|---|---|---|
| Quadrant | BADHDUFLAG | Total packets | Discarded packets |
| A | 0 | 7 | 0 |
| B | 0 | 7 | 0 |
| C | 0 | 7 | 0 |
| D | 0 | 7 | 0 |
| Mode SS | |||
|---|---|---|---|
| Quadrant | BADHDUFLAG | Total packets | Discarded packets |
| A | 0 | 136 | 0 |
| B | 0 | 136 | 0 |
| C | 0 | 136 | 0 |
| D | 0 | 136 | 0 |
| Quadrant | Total seconds | Saturated seconds | Saturation percentage |
|---|---|---|---|
| A | 6743 | 154 | 2.283850% |
| B | 6743 | 180 | 2.669435% |
| C | 6743 | 103 | 1.527510% |
| D | 6743 | 126 | 1.868604% |
Noise dominated data is calculated using 1-second bins in cleaned event files. If a bin has >2000 counts, and if more than 50% of those come from <1% of pixels, then it is considered to be noise-dominated and hence unusable.
| Quadrant | # 1 sec bins | Bins with >0 counts | Bins with >2000 counts | High rate bins dominated by noise | Noise dominated (total time) | Noise dominated (detector-on time) | Marked lightcurve |
|---|---|---|---|---|---|---|---|
| A | 7449 | 6744 | 7 | 7 | 0.09% | 0.10% | 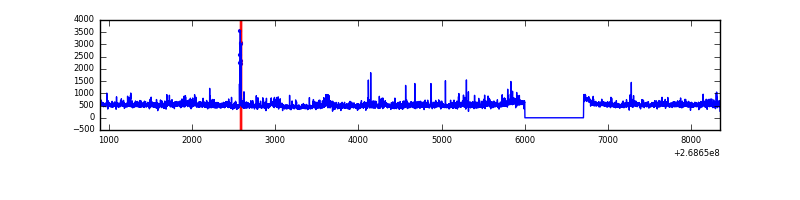 |
| B | 7449 | 6744 | 22 | 22 | 0.30% | 0.33% | 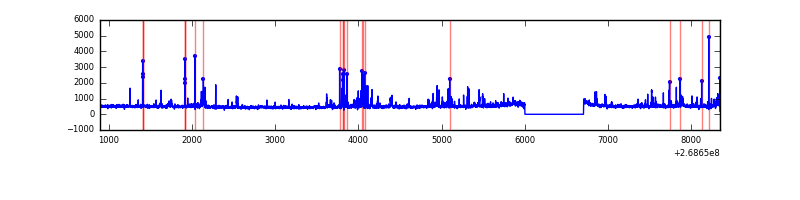 |
| C | 7449 | 6744 | 0 | 0 | 0.00% | 0.00% | 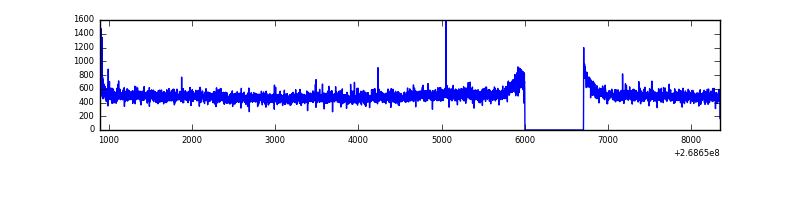 |
| D | 7449 | 6744 | 17 | 17 | 0.23% | 0.25% | 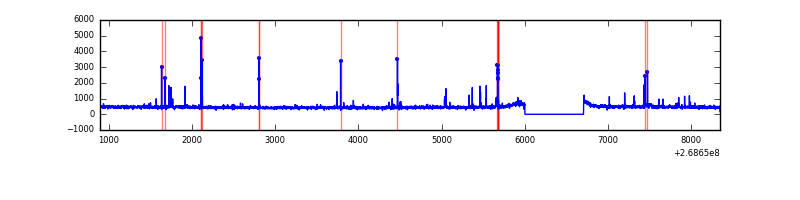 |
Top three noisy pixels from each quadrant. If the there are fewer than three noisy pixels in the level2.evt file, extra rows are filled as -1
| Pixel properties | Quadrant properties | ||||||
|---|---|---|---|---|---|---|---|
| Quadrant | DetID | PixID | Counts | Sigma | Mean | Median | Sigma |
| A | 1 | 162 | 138912 | 827.26 | 820 | 803 | 166.9 |
| A | 12 | 189 | 109210 | 649.35 | 820 | 803 | 166.9 |
| A | 1 | 178 | 64972 | 384.37 | 820 | 803 | 166.9 |
| B | 3 | 64 | 180271 | 1155.04 | 814 | 795 | 155.4 |
| B | 0 | 229 | 169457 | 1085.44 | 814 | 795 | 155.4 |
| B | 0 | 197 | 60805 | 386.2 | 814 | 795 | 155.4 |
| C | 3 | 233 | 252860 | 1386.52 | 791 | 796 | 181.8 |
| C | 7 | 247 | 17512 | 91.95 | 791 | 796 | 181.8 |
| C | 10 | 22 | 15123 | 78.81 | 791 | 796 | 181.8 |
| D | 15 | 0 | 32672 | 152.12 | 792 | 772 | 209.7 |
| D | 7 | 38 | 25945 | 120.04 | 792 | 772 | 209.7 |
| D | 2 | 234 | 25062 | 115.83 | 792 | 772 | 209.7 |
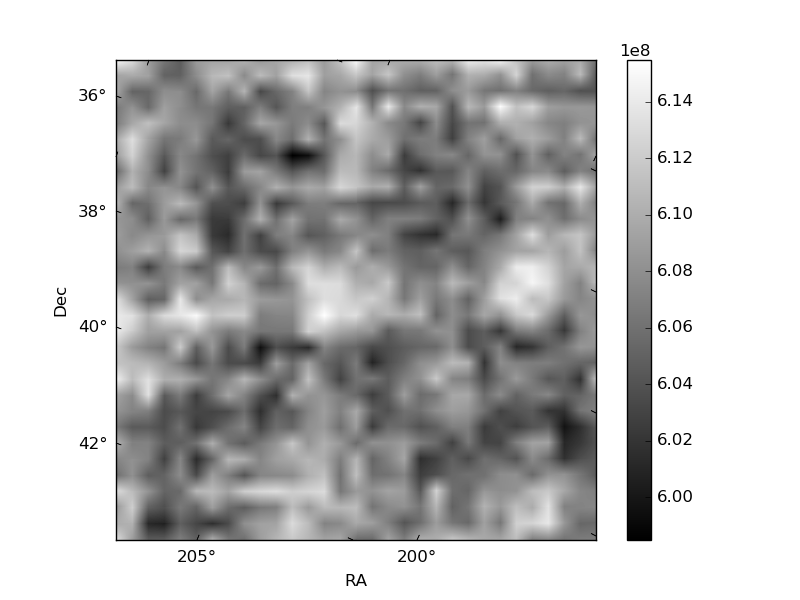
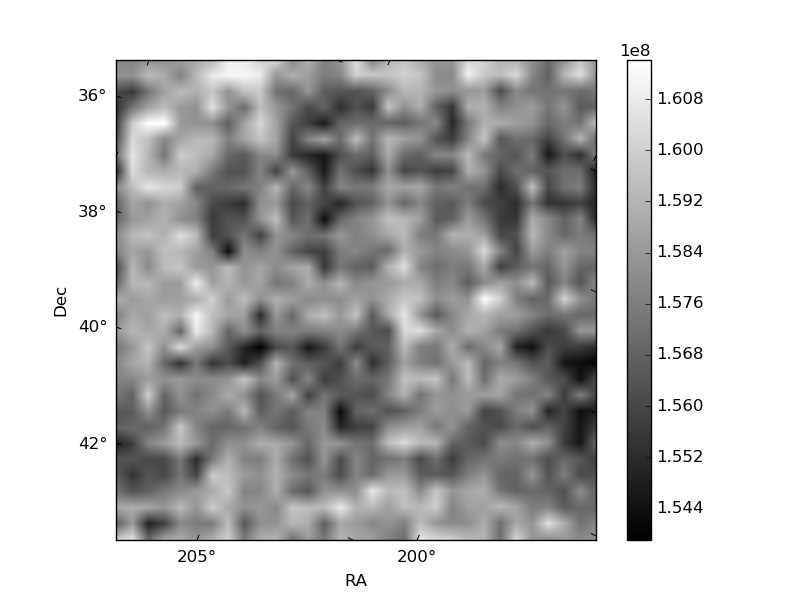
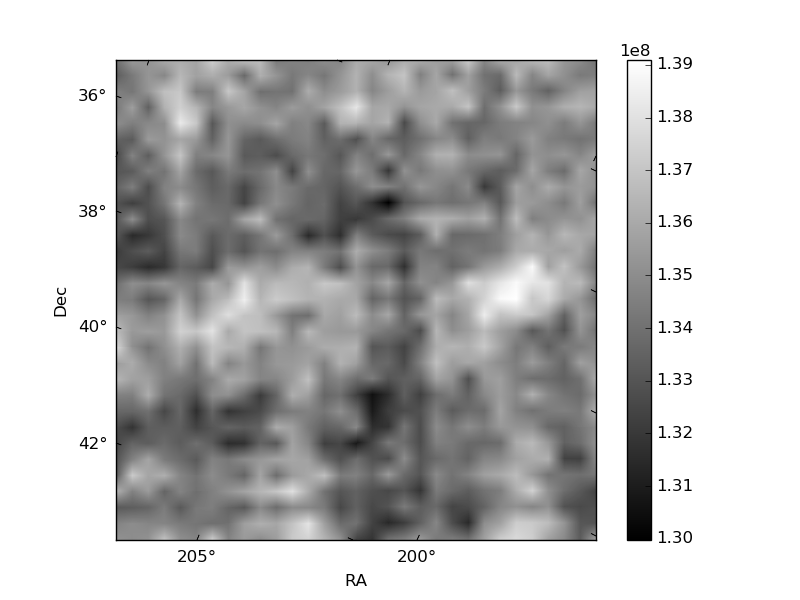
Histogram calculated using DETX and DETY for each event in the final _common_clean file
| Quadrant A | 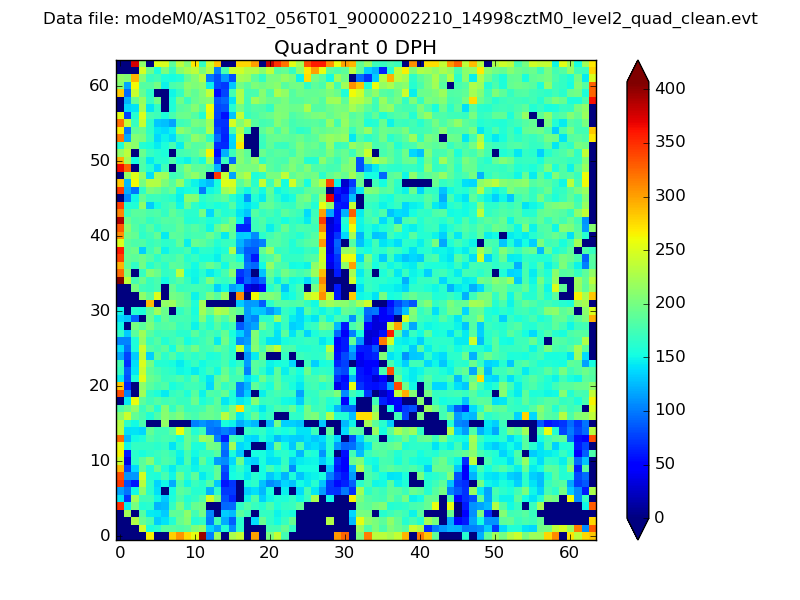 |
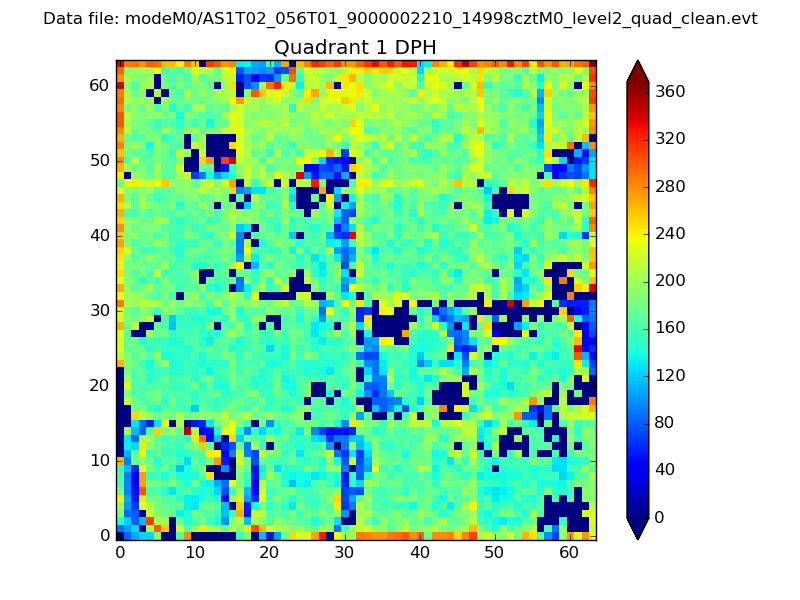 |
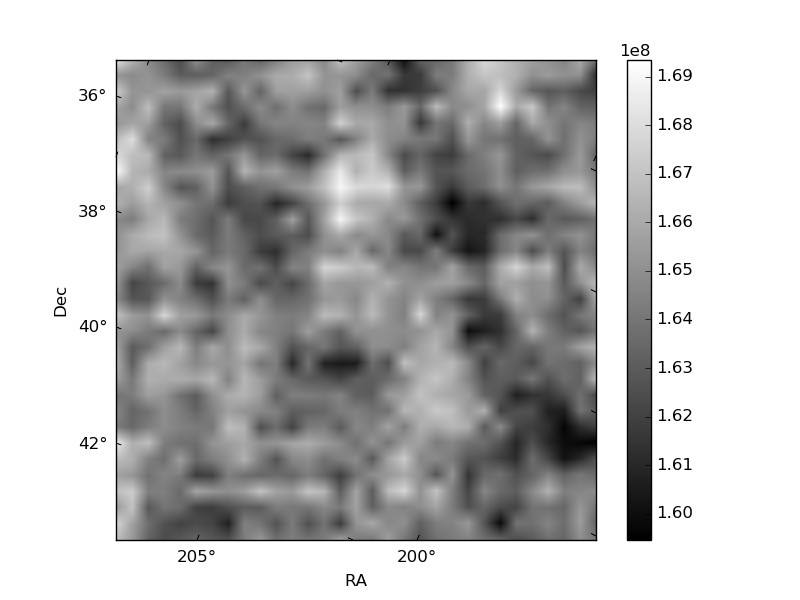
Quadrant B |
|---|---|---|---|
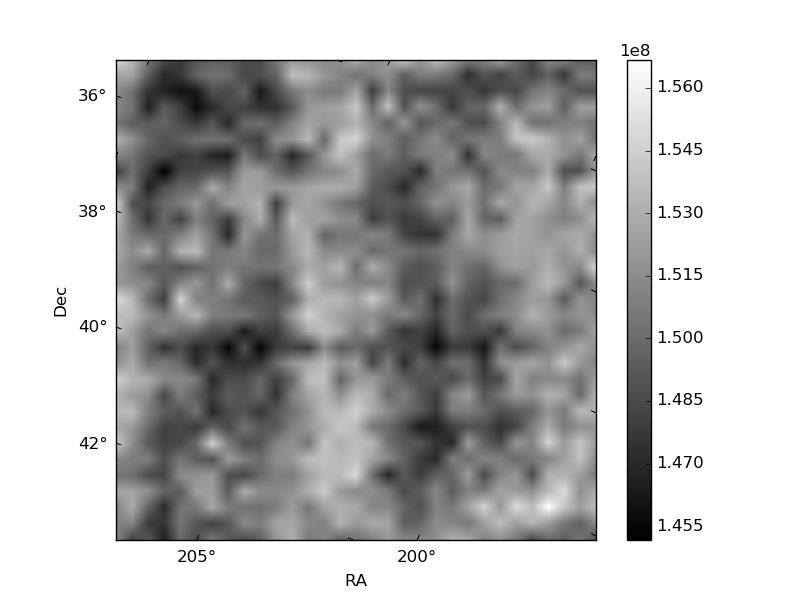
| Quadrant D | 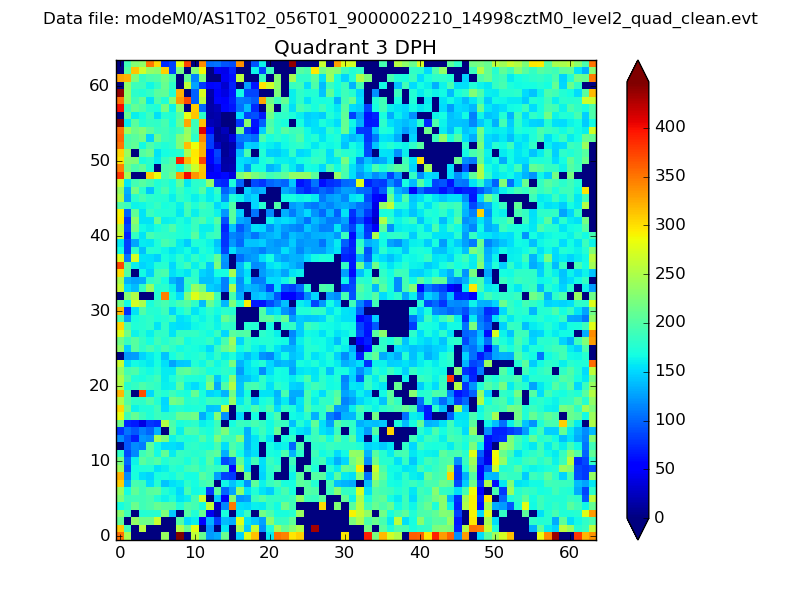 |
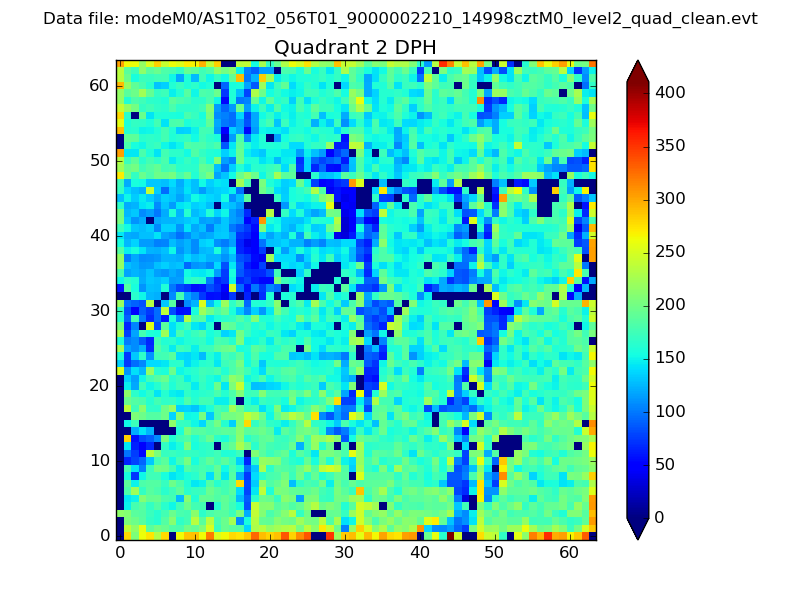 |
Quadrant C |
| Plot type | Count rate plots | Images |
|---|---|---|
| Comparison with Poisson distribution Blue bars denote a histogram of data divided into 1 sec bins. Red curve is a Poisson curve with rate = median count rate of data. |
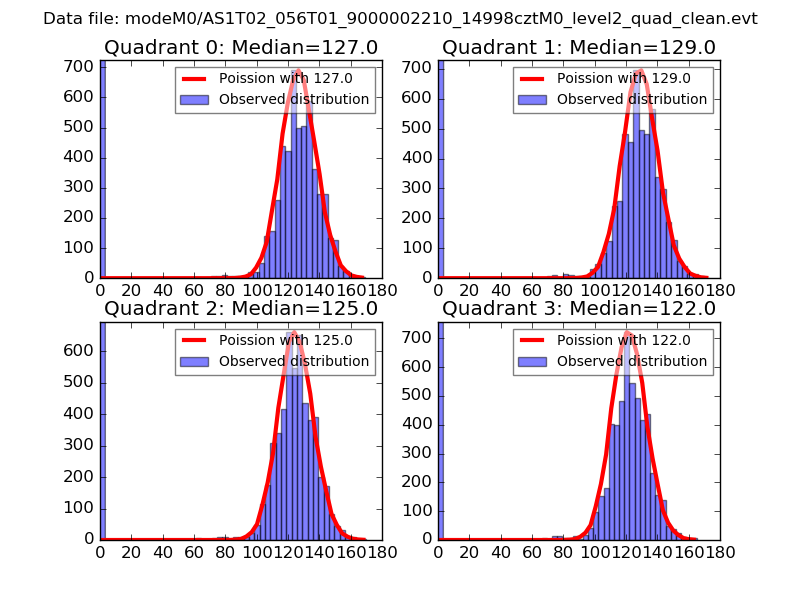 |
 |
| Quadrant-wise count rates Data is divided into 100 sec bins |
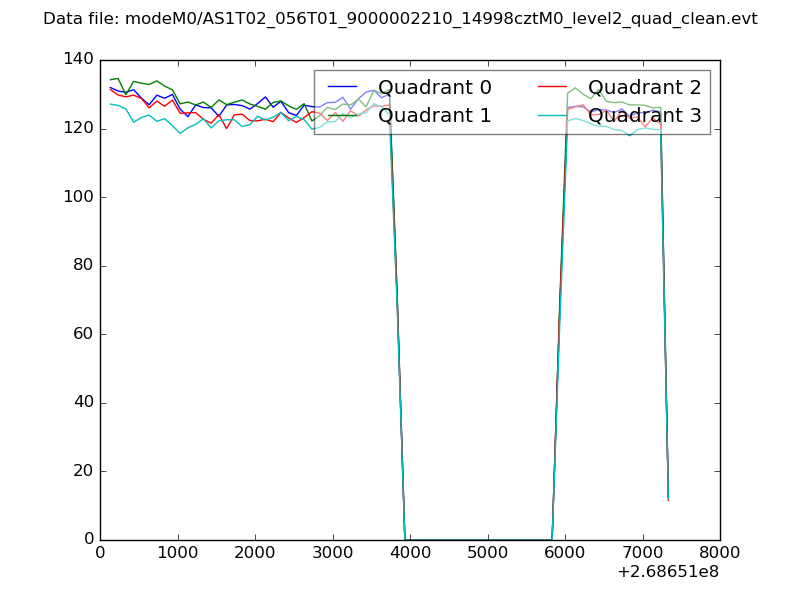 |
|
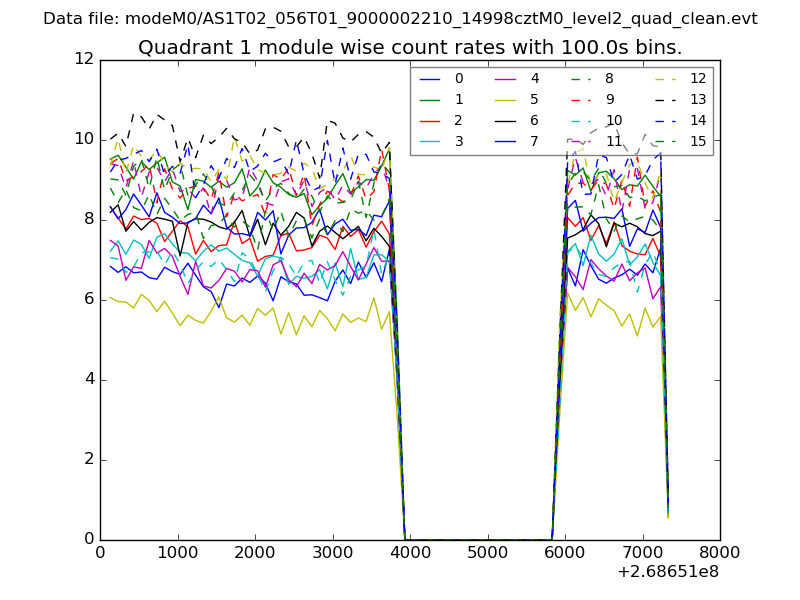
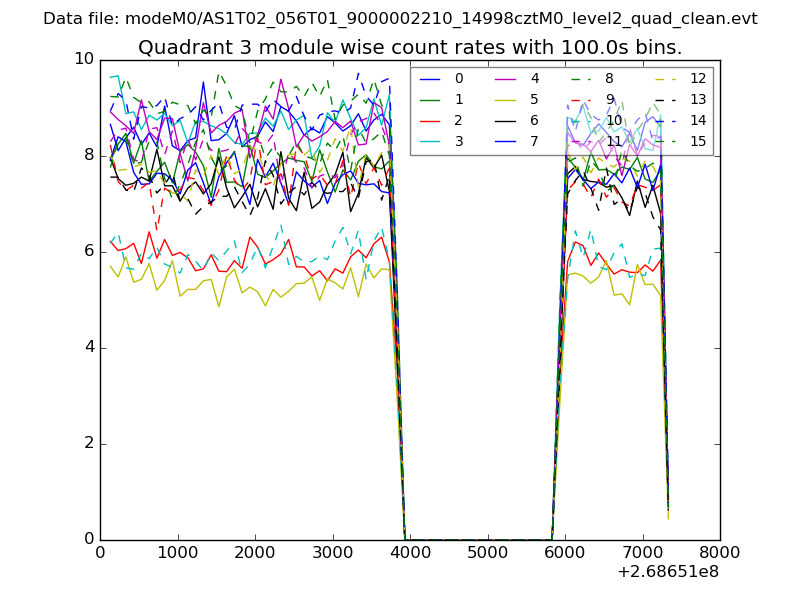
| Module-wise count rates for Quadrant A Data is divided into 100 sec bins |
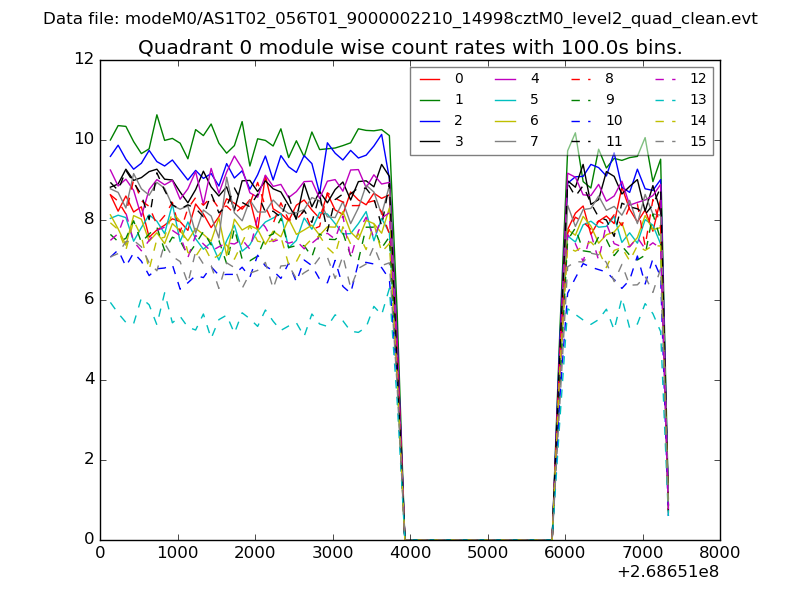 |
 |
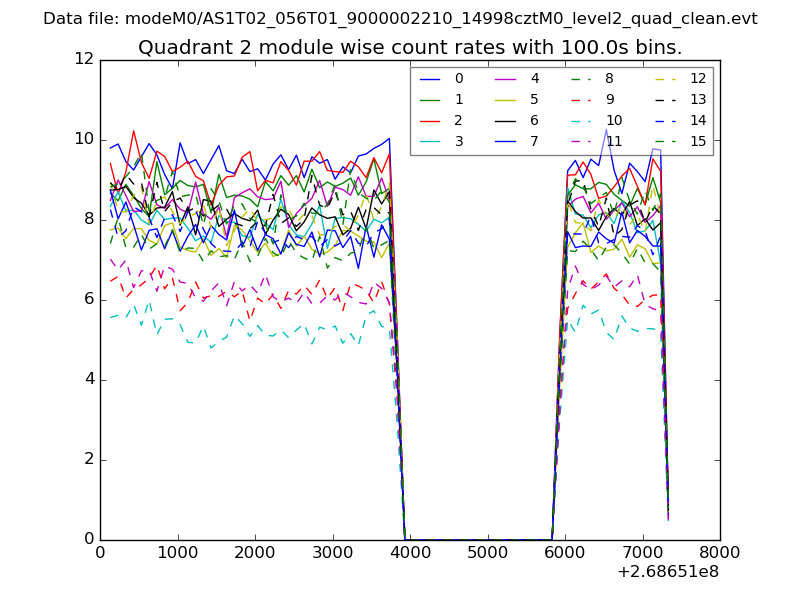
| Module-wise count rates for Quadrant B Data is divided into 100 sec bins |
 |
 |
| Module-wise count rates for Quadrant C Data is divided into 100 sec bins |
 |
 |
| Module-wise count rates for Quadrant D Data is divided into 100 sec bins |
 |
 |
| Parameter | Plot |
|---|---|
| CZT HV Monitor | 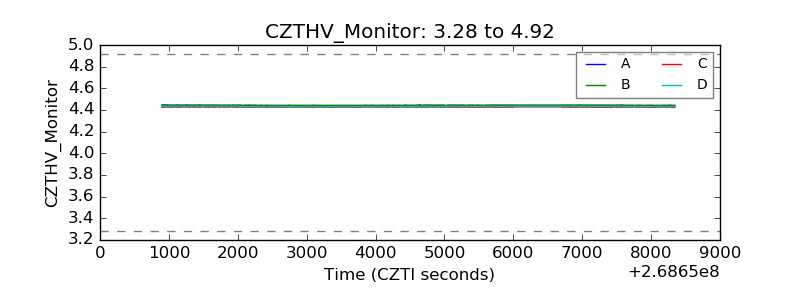 |
| D_VDD | 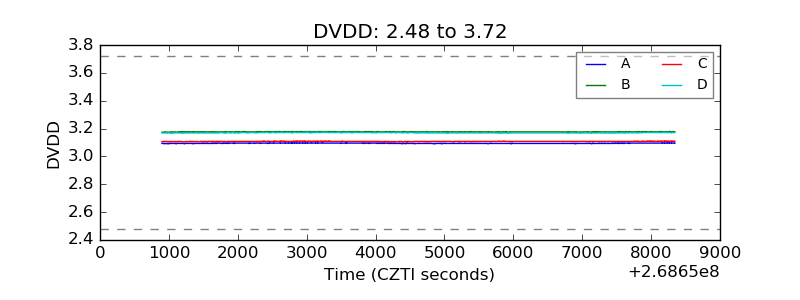 |
| Temperature 1 | 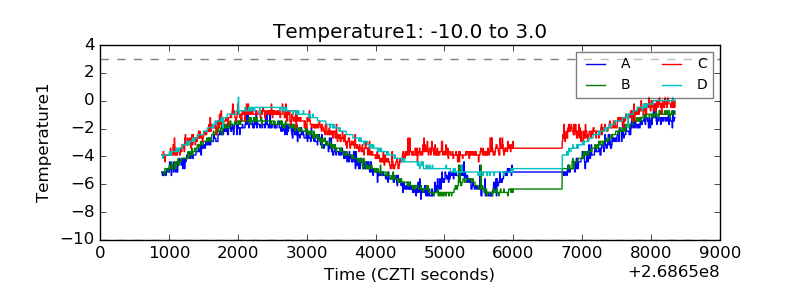 |
| Veto HV Monitor | 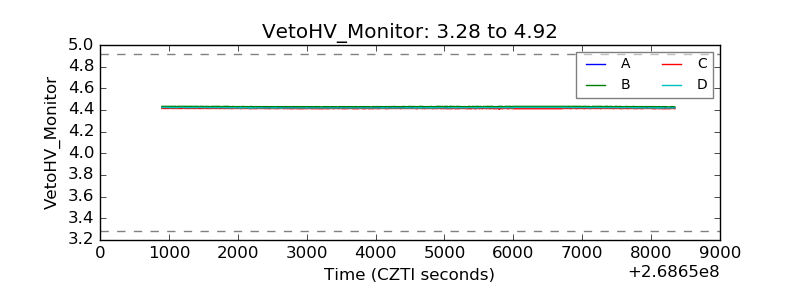 |
| Veto LLD | 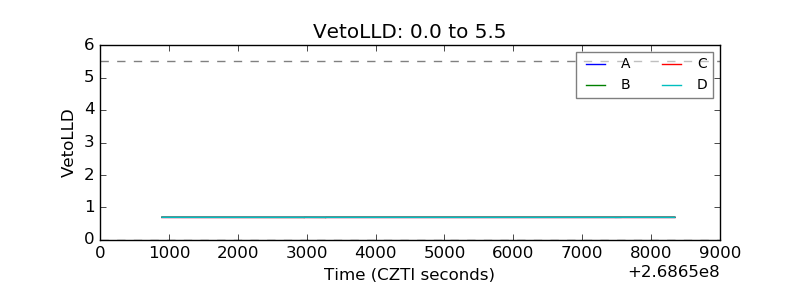 |
| Alpha Counter | 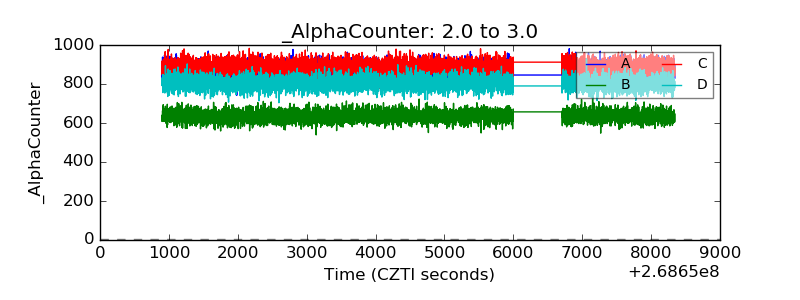 |
| _CPM_Rate | 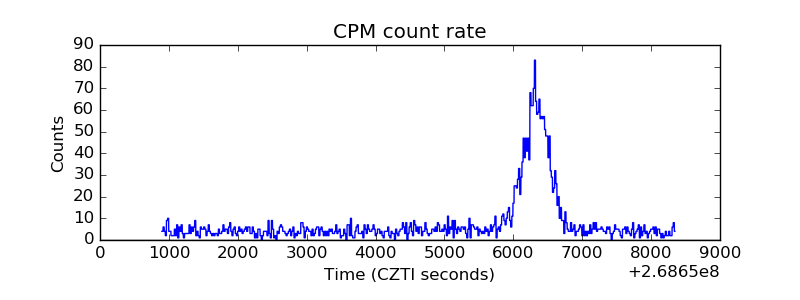 |
| CZT Counter | 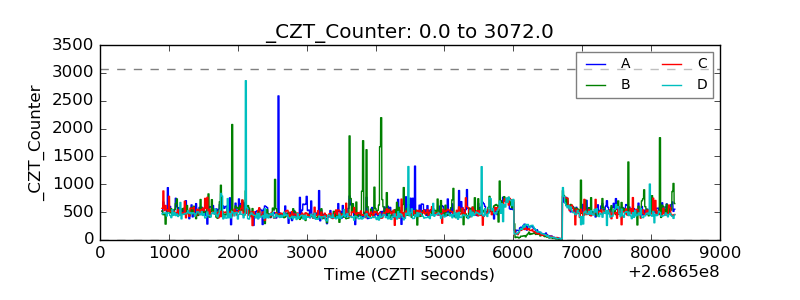 |
| +2.5 Volts monitor |  |
| +5 Volts monitor |  |
| _ROLL_ROT | 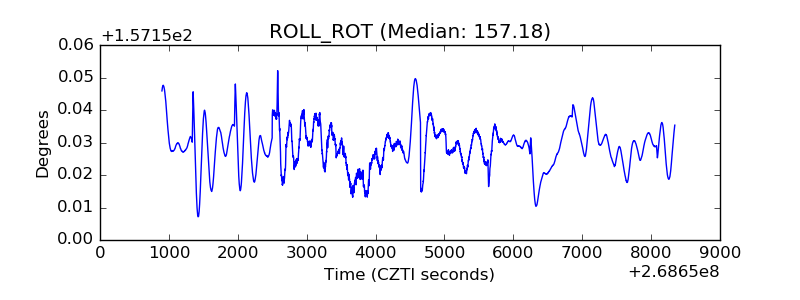 |
| _Roll_DEC | 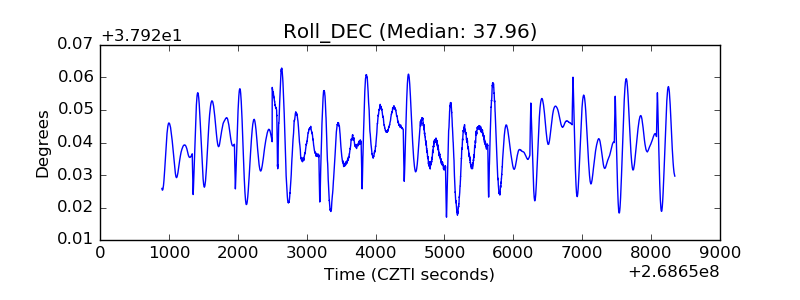 |
| _Roll_RA | 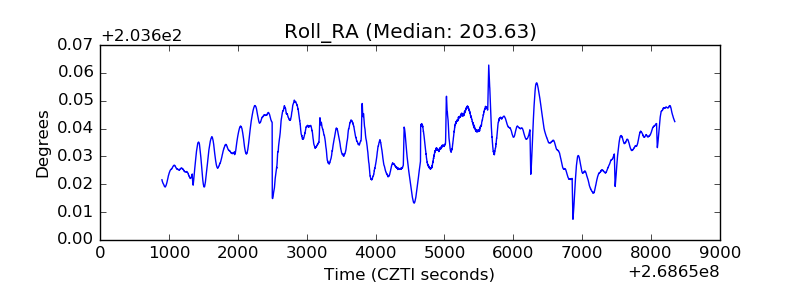 |
| Veto Counter | 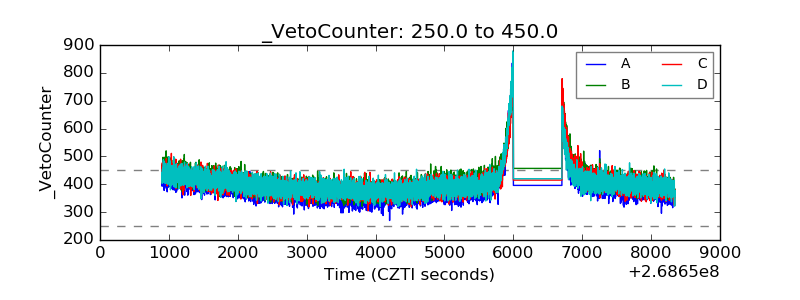 |