| Param | Original file | Final file |
|---|---|---|
| Filename | modeM0/AS1T02_056T01_9000002210_15000cztM0_level2.evt | modeM0/AS1T02_056T01_9000002210_15000cztM0_level2_quad_clean.evt |
| Size (bytes) | 521,951,040 | 96,638,400 |
| Size | 497.8 MB | 92.2 MB |
| Events in quadrant A | 3,974,070 | 615,339 |
| Events in quadrant B | 4,258,241 | 618,998 |
| Events in quadrant C | 3,480,298 | 608,360 |
| Events in quadrant D | 3,615,113 | 591,739 |
| Mode M0 | |||
|---|---|---|---|
| Quadrant | BADHDUFLAG | Total packets | Discarded packets |
| A | 0 | 16384 | 2 |
| B | 0 | 17185 | 1 |
| C | 0 | 14792 | 1 |
| D | 0 | 15638 | 1 |
| Mode M9 | |||
|---|---|---|---|
| Quadrant | BADHDUFLAG | Total packets | Discarded packets |
| A | 0 | 3 | 0 |
| B | 0 | 3 | 0 |
| C | 0 | 3 | 0 |
| D | 0 | 3 | 0 |
| Mode SS | |||
|---|---|---|---|
| Quadrant | BADHDUFLAG | Total packets | Discarded packets |
| A | 0 | 142 | 0 |
| B | 0 | 142 | 0 |
| C | 0 | 142 | 0 |
| D | 0 | 142 | 0 |
| Quadrant | Total seconds | Saturated seconds | Saturation percentage |
|---|---|---|---|
| A | 7069 | 138 | 1.952186% |
| B | 7069 | 316 | 4.470222% |
| C | 7069 | 83 | 1.174141% |
| D | 7069 | 143 | 2.022917% |
Noise dominated data is calculated using 1-second bins in cleaned event files. If a bin has >2000 counts, and if more than 50% of those come from <1% of pixels, then it is considered to be noise-dominated and hence unusable.
| Quadrant | # 1 sec bins | Bins with >0 counts | Bins with >2000 counts | High rate bins dominated by noise | Noise dominated (total time) | Noise dominated (detector-on time) | Marked lightcurve |
|---|---|---|---|---|---|---|---|
| A | 7325 | 7068 | 1 | 1 | 0.01% | 0.01% | 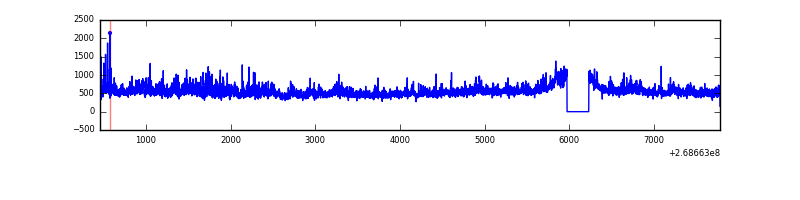 |
| B | 7325 | 7069 | 153 | 153 | 2.09% | 2.16% | 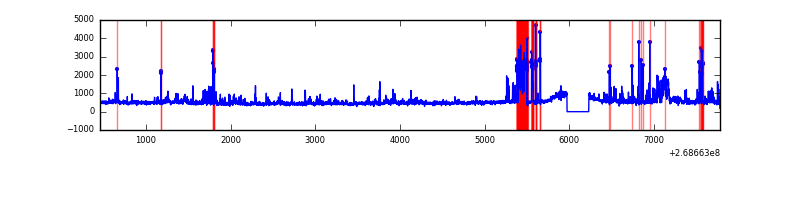 |
| C | 7325 | 7069 | 3 | 3 | 0.04% | 0.04% | 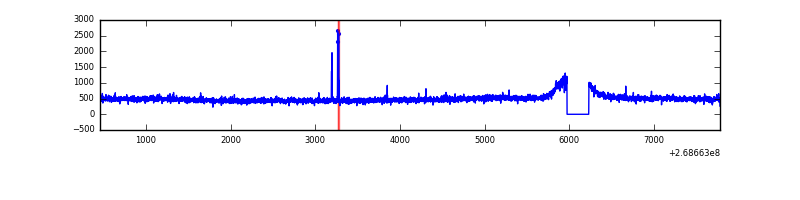 |
| D | 7325 | 7069 | 63 | 63 | 0.86% | 0.89% | 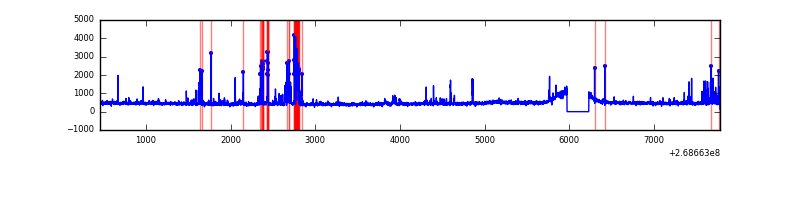 |
Top three noisy pixels from each quadrant. If the there are fewer than three noisy pixels in the level2.evt file, extra rows are filled as -1
| Pixel properties | Quadrant properties | ||||||
|---|---|---|---|---|---|---|---|
| Quadrant | DetID | PixID | Counts | Sigma | Mean | Median | Sigma |
| A | 1 | 162 | 236550 | 1352.49 | 854 | 834 | 174.3 |
| A | 12 | 189 | 152396 | 869.63 | 854 | 834 | 174.3 |
| A | 1 | 178 | 109797 | 625.21 | 854 | 834 | 174.3 |
| B | 3 | 64 | 531314 | 3285.21 | 838 | 815 | 161.5 |
| B | 0 | 229 | 140166 | 862.96 | 838 | 815 | 161.5 |
| B | 10 | 16 | 64451 | 394.08 | 838 | 815 | 161.5 |
| C | 3 | 233 | 225805 | 1168.62 | 827 | 830 | 192.5 |
| C | 10 | 22 | 23171 | 116.05 | 827 | 830 | 192.5 |
| C | 13 | 61 | 6150 | 27.63 | 827 | 830 | 192.5 |
| D | 7 | 38 | 319110 | 1501.42 | 829 | 807 | 212.0 |
| D | 10 | 70 | 37407 | 172.64 | 829 | 807 | 212.0 |
| D | 2 | 234 | 35023 | 161.4 | 829 | 807 | 212.0 |
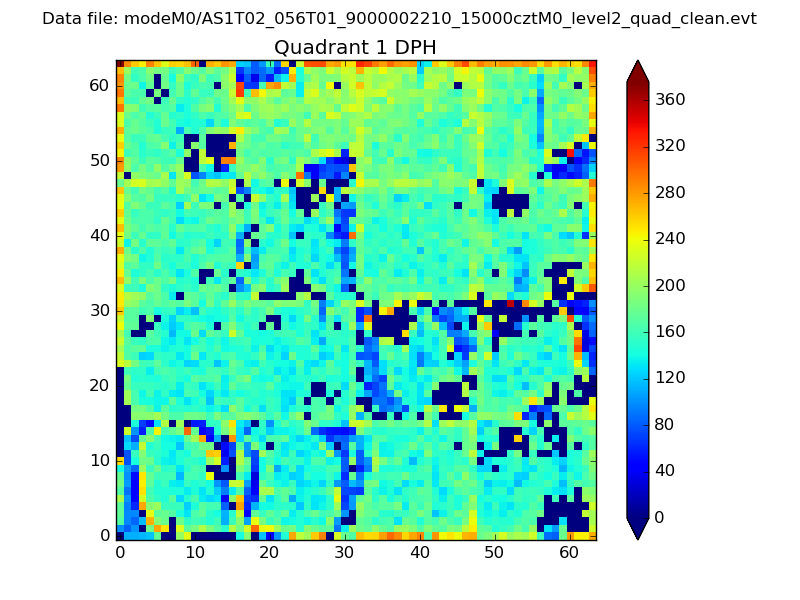
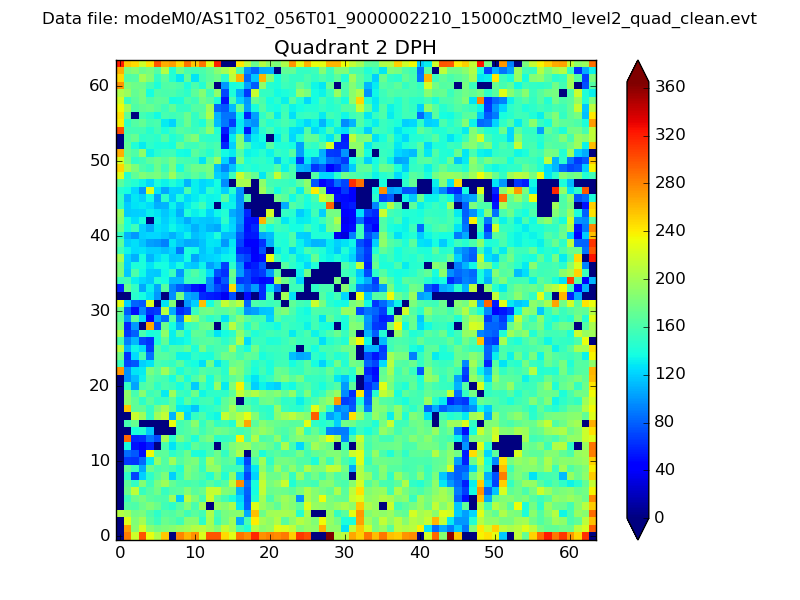
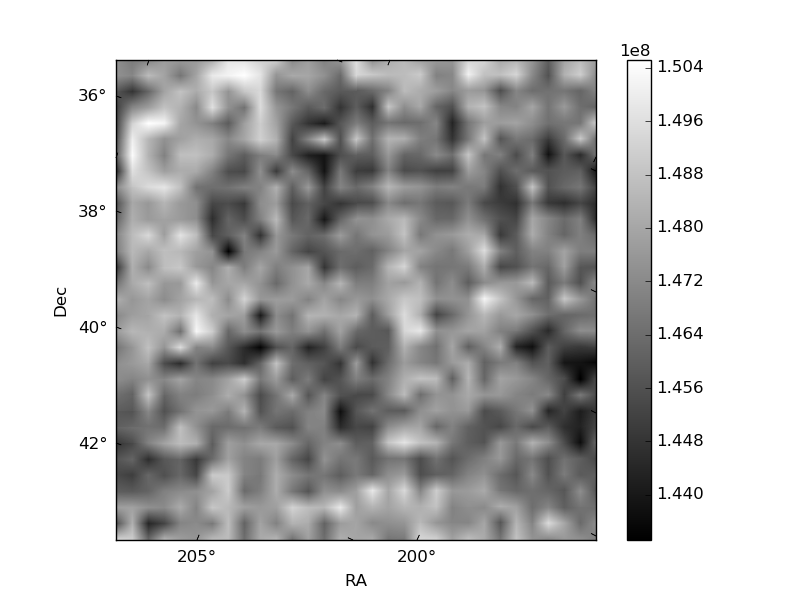
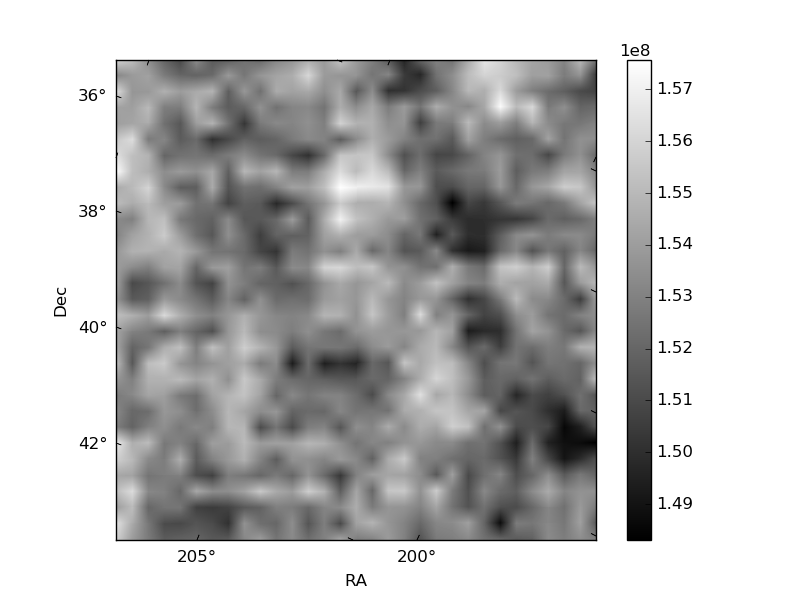
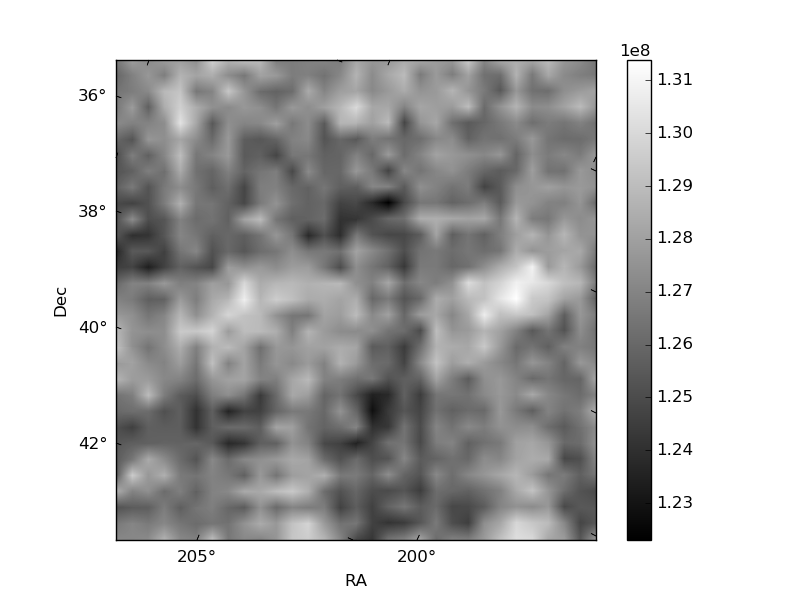
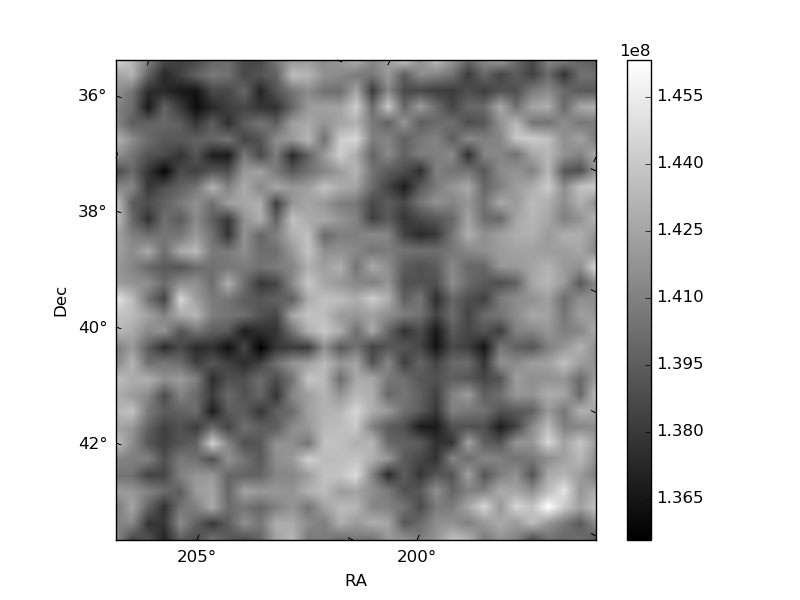
Histogram calculated using DETX and DETY for each event in the final _common_clean file
| Quadrant A |  |
 |
Quadrant B |
|---|---|---|---|
| Quadrant D |  |
 |
Quadrant C |
| Plot type | Count rate plots | Images |
|---|---|---|
| Comparison with Poisson distribution Blue bars denote a histogram of data divided into 1 sec bins. Red curve is a Poisson curve with rate = median count rate of data. |
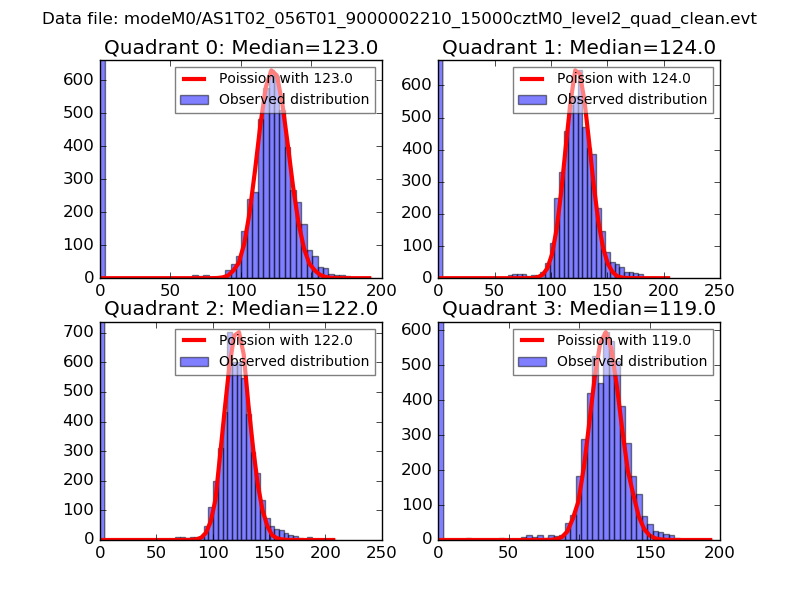 |
 |
| Quadrant-wise count rates Data is divided into 100 sec bins |
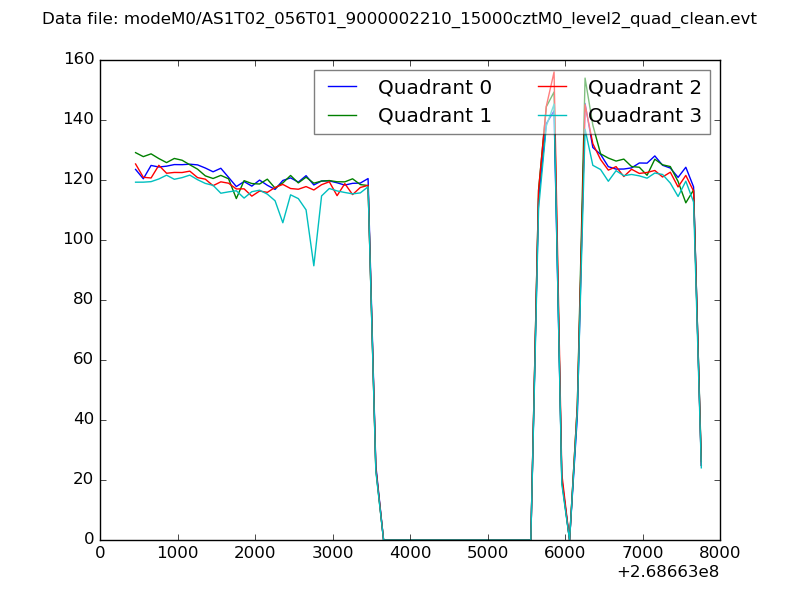 |
|
| Module-wise count rates for Quadrant A Data is divided into 100 sec bins |
 |
 |
| Module-wise count rates for Quadrant B Data is divided into 100 sec bins |
 |
 |
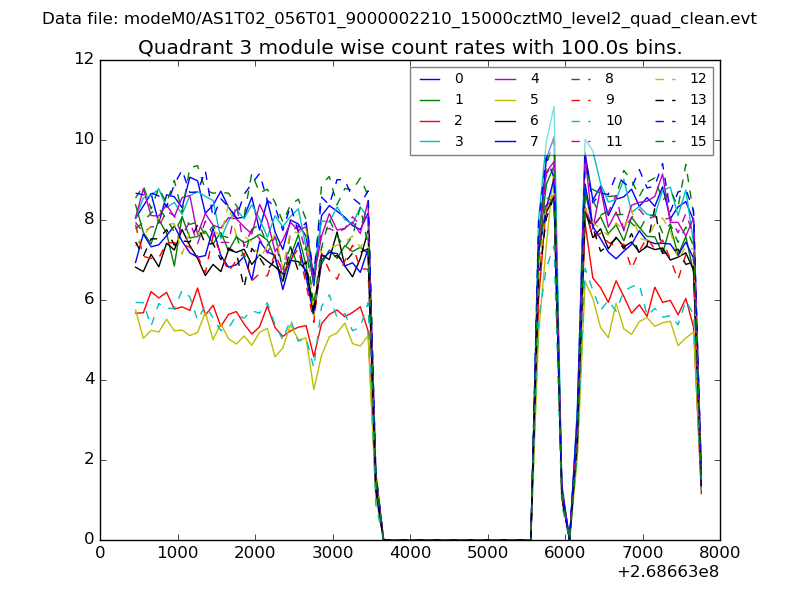
| Module-wise count rates for Quadrant C Data is divided into 100 sec bins |
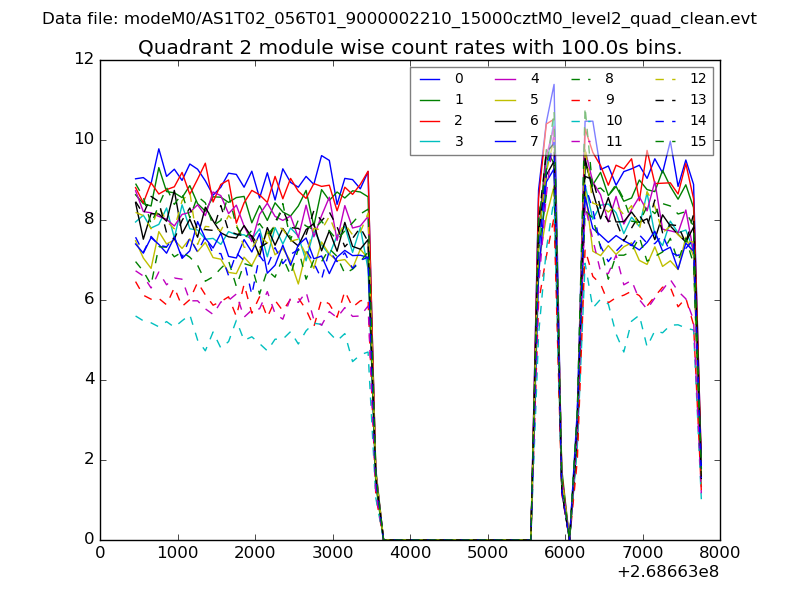 |
 |
| Module-wise count rates for Quadrant D Data is divided into 100 sec bins |
 |
 |
| Parameter | Plot |
|---|---|
| CZT HV Monitor | 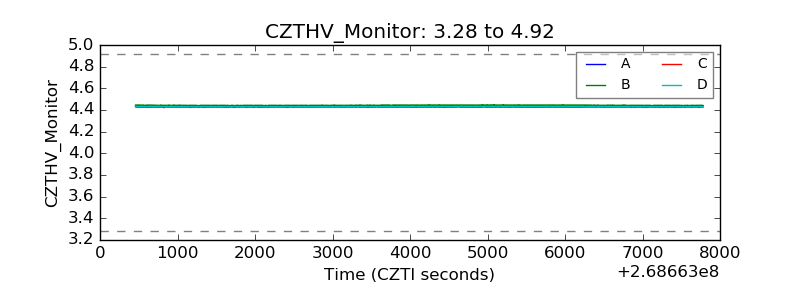 |
| D_VDD | 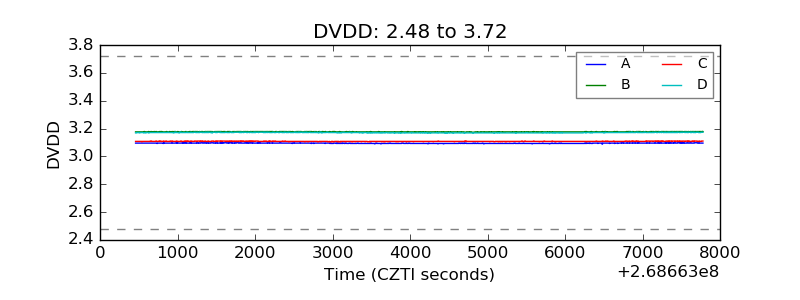 |
| Temperature 1 | 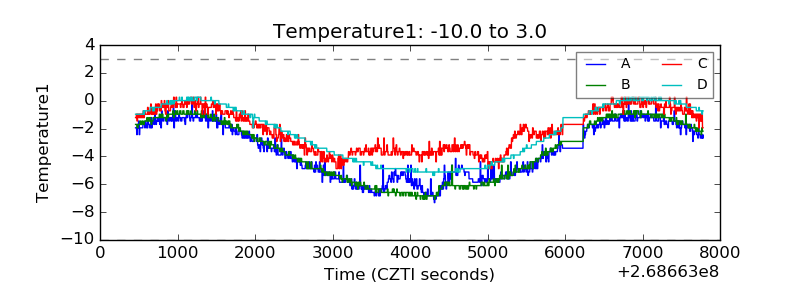 |
| Veto HV Monitor | 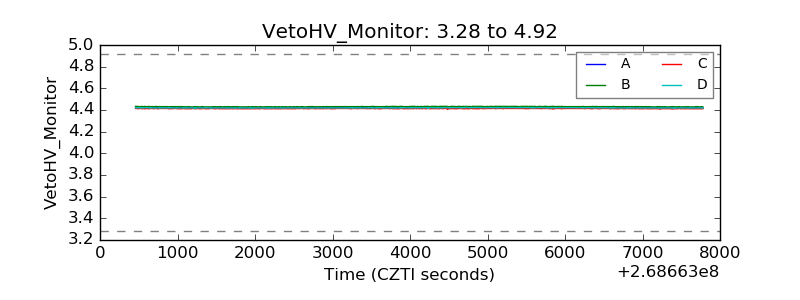 |
| Veto LLD | 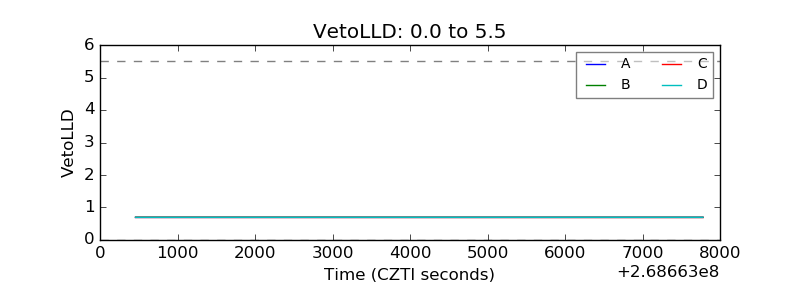 |
| Alpha Counter | 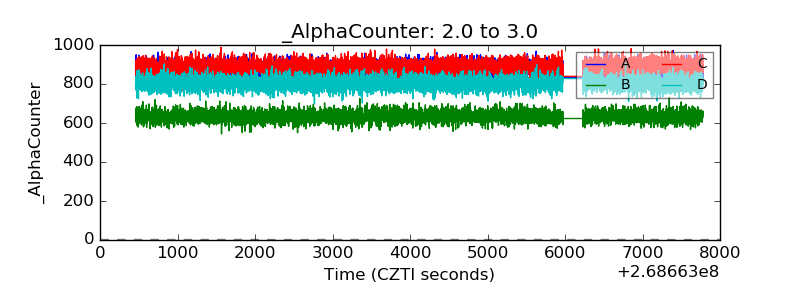 |
| _CPM_Rate | 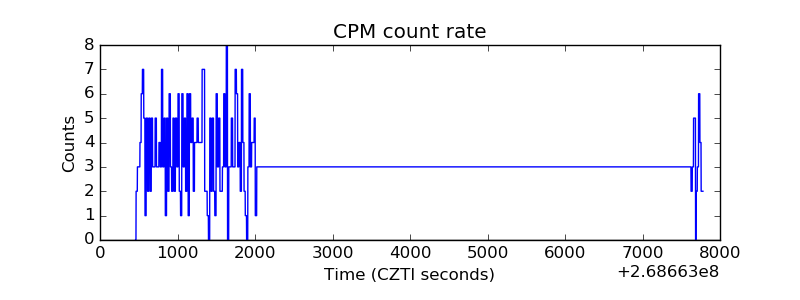 |
| CZT Counter | 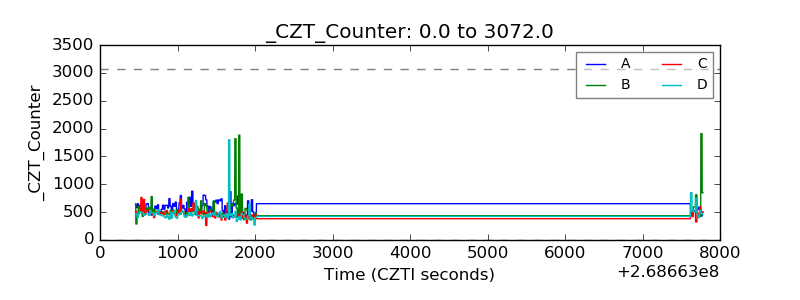 |
| +2.5 Volts monitor |  |
| +5 Volts monitor | 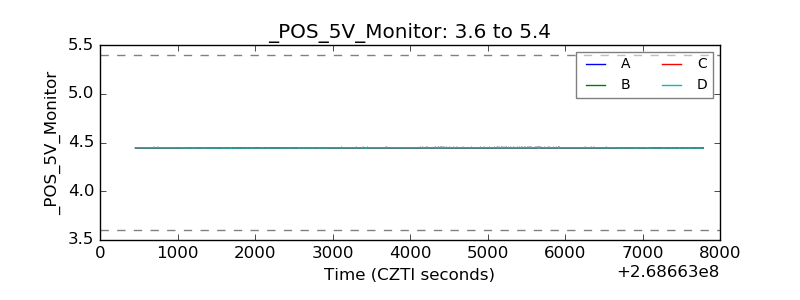 |
| _ROLL_ROT | 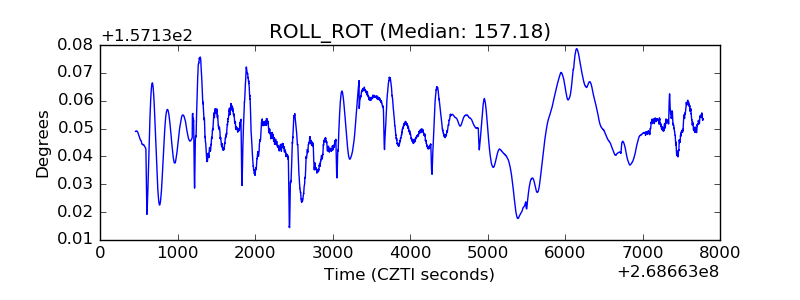 |
| _Roll_DEC | 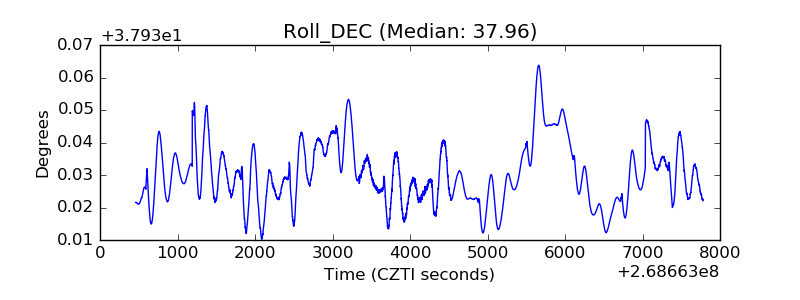 |
| _Roll_RA | 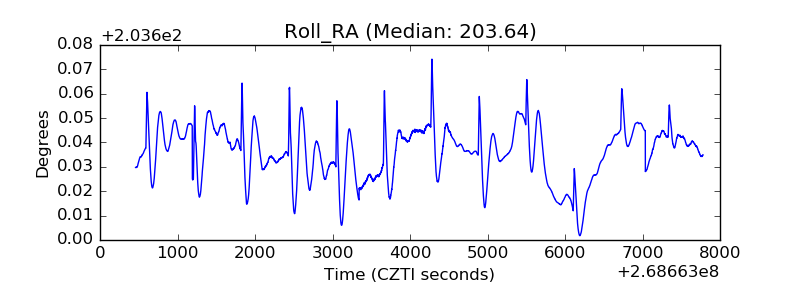 |
| Veto Counter | 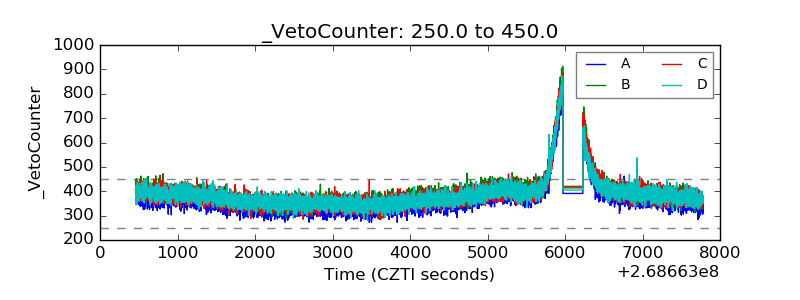 |