| Param | Original file | Final file |
|---|---|---|
| Filename | modeM0/AS1T02_056T01_9000002210_15003cztM0_level2.evt | modeM0/AS1T02_056T01_9000002210_15003cztM0_level2_quad_clean.evt |
| Size (bytes) | 895,763,520 | 165,263,040 |
| Size | 854.3 MB | 157.6 MB |
| Events in quadrant A | 6,836,749 | 1,044,320 |
| Events in quadrant B | 6,967,788 | 1,050,487 |
| Events in quadrant C | 6,070,607 | 1,033,901 |
| Events in quadrant D | 6,398,345 | 1,003,523 |
| Mode M0 | |||
|---|---|---|---|
| Quadrant | BADHDUFLAG | Total packets | Discarded packets |
| A | 0 | 28692 | 3 |
| B | 0 | 29003 | 2 |
| C | 0 | 26012 | 2 |
| D | 0 | 28003 | 2 |
| Mode M9 | |||
|---|---|---|---|
| Quadrant | BADHDUFLAG | Total packets | Discarded packets |
| A | 0 | 13 | 0 |
| B | 0 | 13 | 0 |
| C | 0 | 13 | 0 |
| D | 0 | 13 | 0 |
| Mode SS | |||
|---|---|---|---|
| Quadrant | BADHDUFLAG | Total packets | Discarded packets |
| A | 0 | 258 | 0 |
| B | 0 | 258 | 0 |
| C | 0 | 258 | 0 |
| D | 0 | 258 | 0 |
| Quadrant | Total seconds | Saturated seconds | Saturation percentage |
|---|---|---|---|
| A | 12626 | 98 | 0.776176% |
| B | 12626 | 246 | 1.948361% |
| C | 12626 | 29 | 0.229685% |
| D | 12626 | 188 | 1.488991% |
Noise dominated data is calculated using 1-second bins in cleaned event files. If a bin has >2000 counts, and if more than 50% of those come from <1% of pixels, then it is considered to be noise-dominated and hence unusable.
| Quadrant | # 1 sec bins | Bins with >0 counts | Bins with >2000 counts | High rate bins dominated by noise | Noise dominated (total time) | Noise dominated (detector-on time) | Marked lightcurve |
|---|---|---|---|---|---|---|---|
| A | 13983 | 12629 | 4 | 4 | 0.03% | 0.03% | 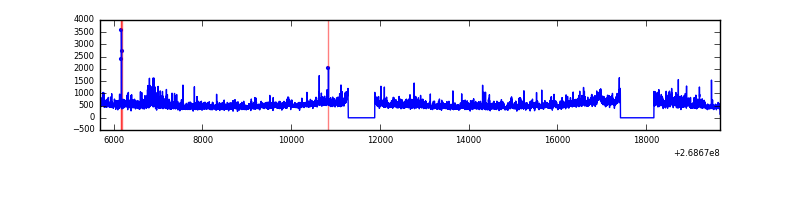 |
| B | 13983 | 12629 | 147 | 147 | 1.05% | 1.16% | 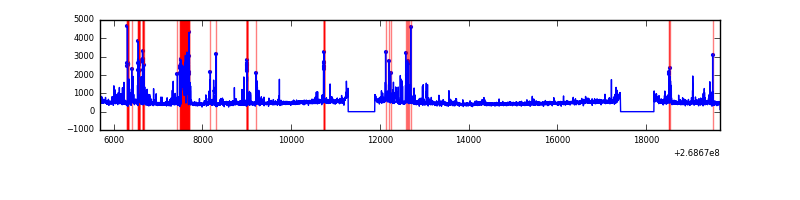 |
| C | 13983 | 12629 | 0 | 0 | 0.00% | 0.00% | 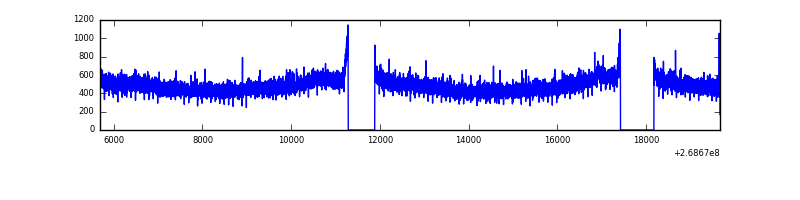 |
| D | 13983 | 12629 | 136 | 136 | 0.97% | 1.08% | 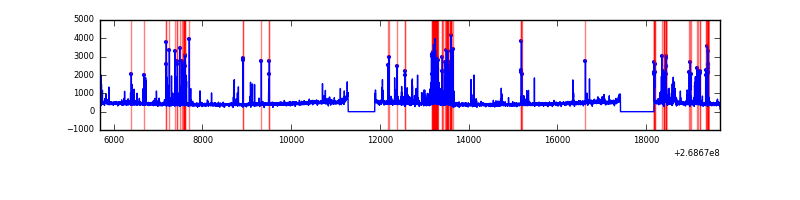 |
Top three noisy pixels from each quadrant. If the there are fewer than three noisy pixels in the level2.evt file, extra rows are filled as -1
| Pixel properties | Quadrant properties | ||||||
|---|---|---|---|---|---|---|---|
| Quadrant | DetID | PixID | Counts | Sigma | Mean | Median | Sigma |
| A | 1 | 162 | 354379 | 1172.7 | 1479 | 1446 | 301.0 |
| A | 12 | 189 | 268242 | 886.49 | 1479 | 1446 | 301.0 |
| A | 1 | 178 | 166827 | 549.52 | 1479 | 1446 | 301.0 |
| B | 10 | 16 | 664519 | 2363.14 | 1472 | 1430 | 280.6 |
| B | 3 | 64 | 217781 | 771.04 | 1472 | 1430 | 280.6 |
| B | 0 | 229 | 65628 | 228.79 | 1472 | 1430 | 280.6 |
| C | 3 | 233 | 430403 | 1292.54 | 1435 | 1447 | 331.9 |
| C | 8 | 128 | 12713 | 33.95 | 1435 | 1447 | 331.9 |
| C | 13 | 61 | 10480 | 27.22 | 1435 | 1447 | 331.9 |
| D | 7 | 38 | 744232 | 1987.21 | 1426 | 1388 | 373.8 |
| D | 15 | 0 | 79329 | 208.5 | 1426 | 1388 | 373.8 |
| D | 2 | 234 | 56507 | 147.45 | 1426 | 1388 | 373.8 |
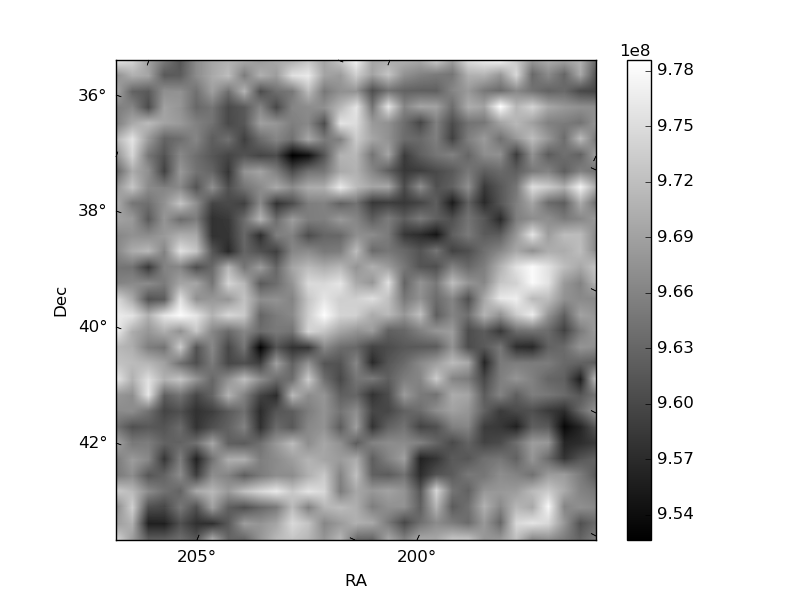
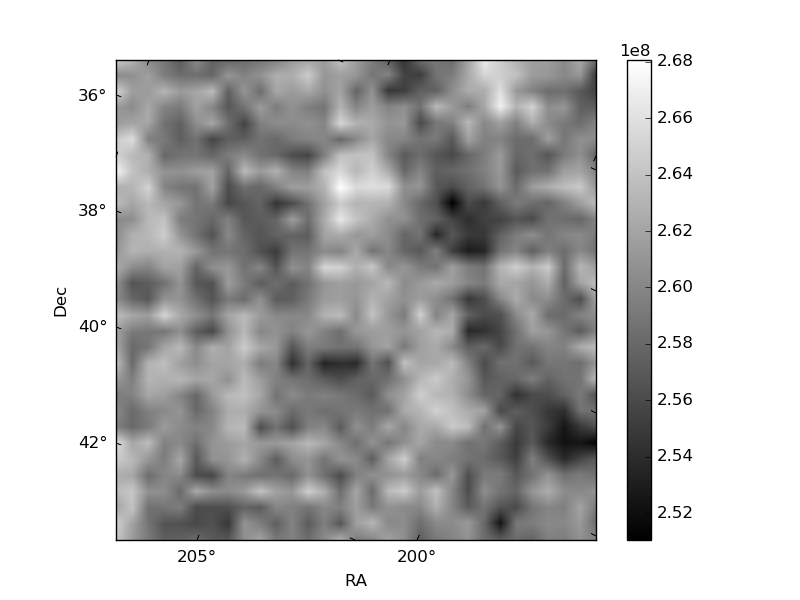
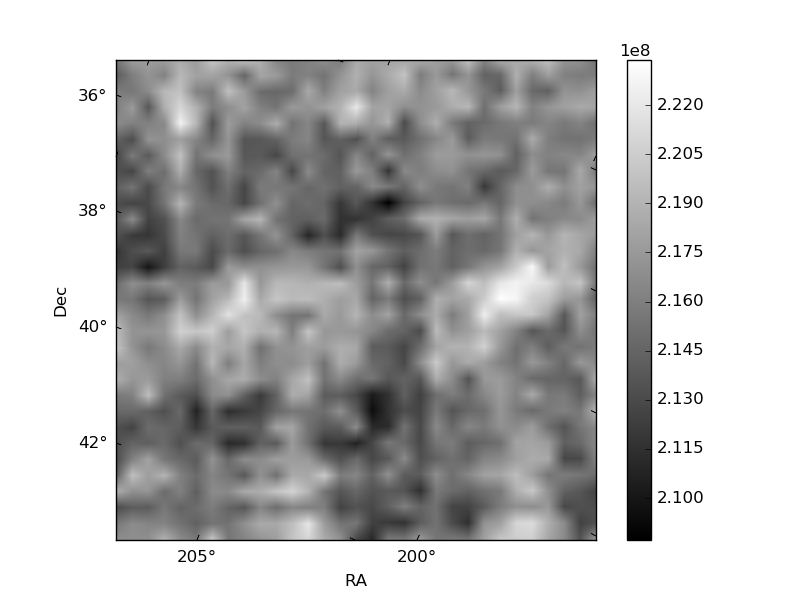
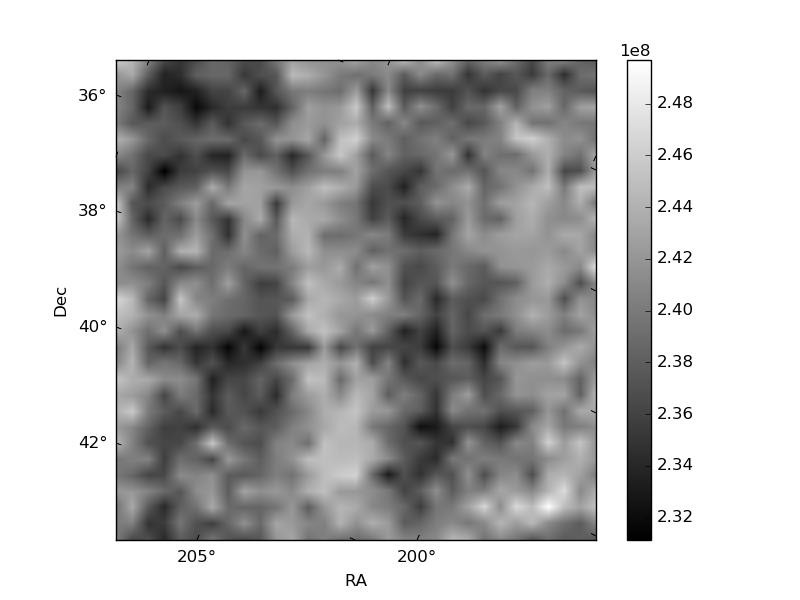
Histogram calculated using DETX and DETY for each event in the final _common_clean file
| Quadrant A | 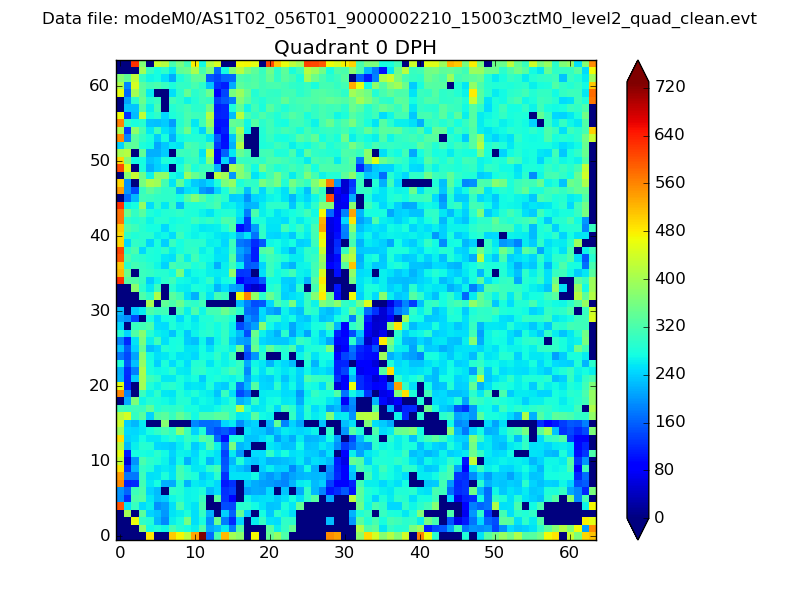 |
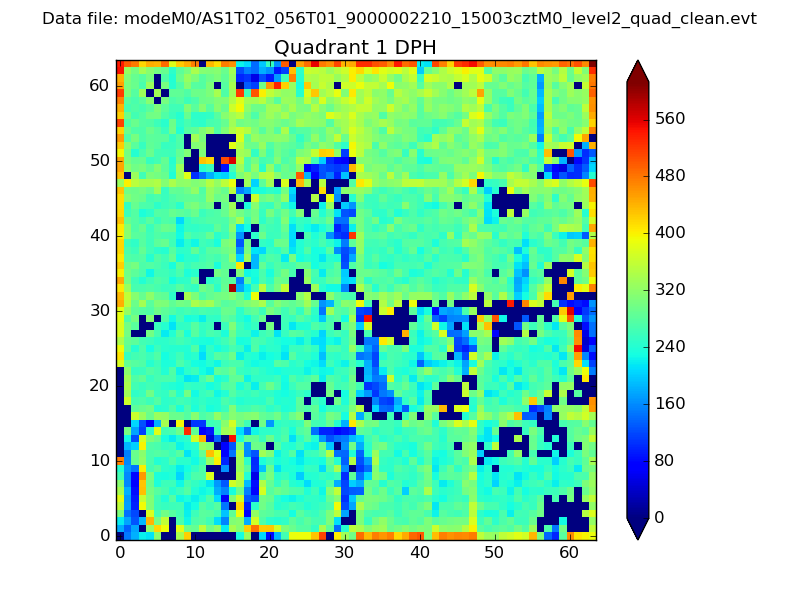 |
Quadrant B |
|---|---|---|---|
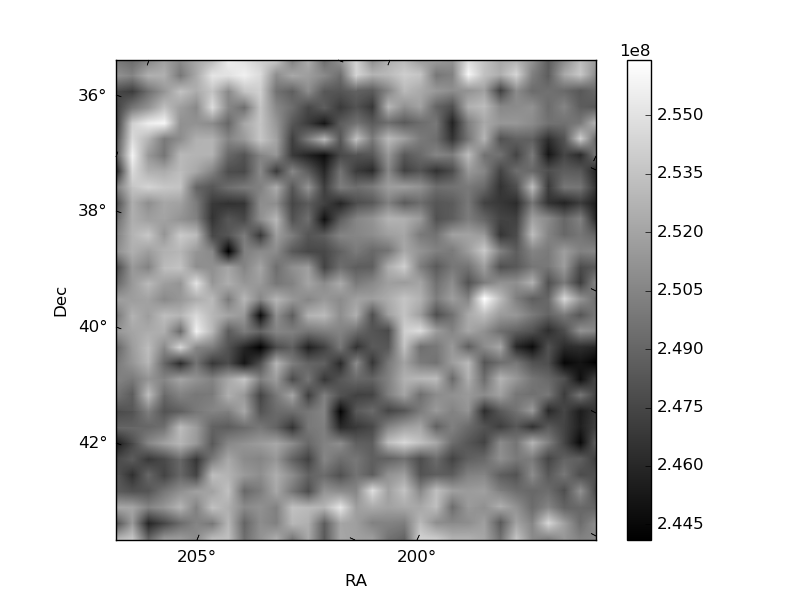
| Quadrant D | 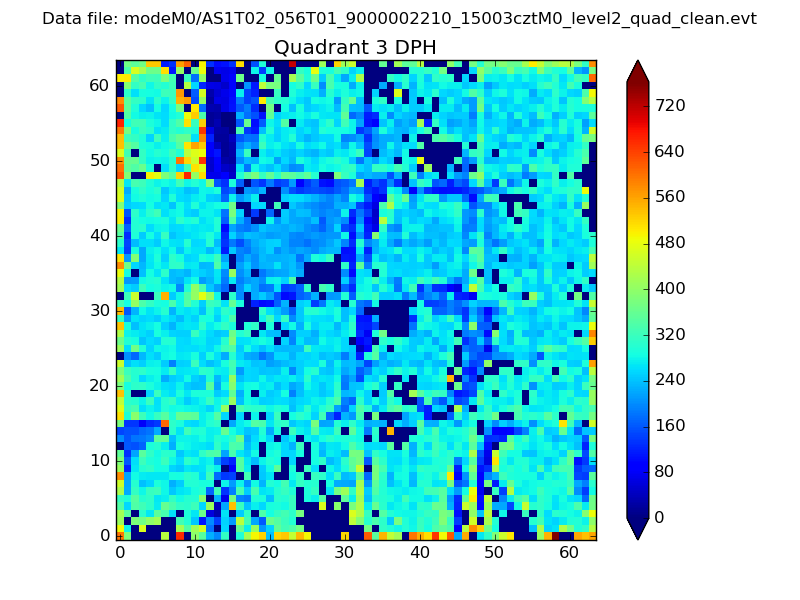 |
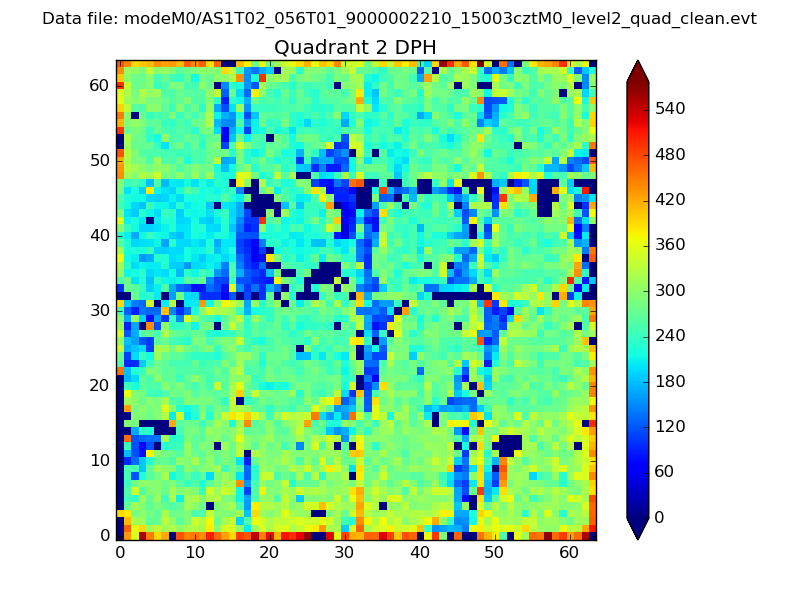 |
Quadrant C |
| Plot type | Count rate plots | Images |
|---|---|---|
| Comparison with Poisson distribution Blue bars denote a histogram of data divided into 1 sec bins. Red curve is a Poisson curve with rate = median count rate of data. |
 |
 |
| Quadrant-wise count rates Data is divided into 100 sec bins |
 |
|
| Module-wise count rates for Quadrant A Data is divided into 100 sec bins |
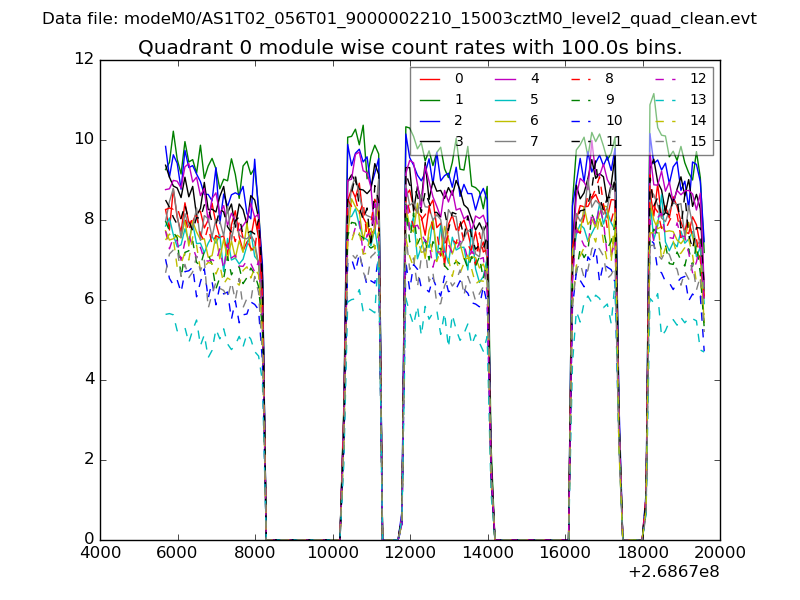 |
 |
| Module-wise count rates for Quadrant B Data is divided into 100 sec bins |
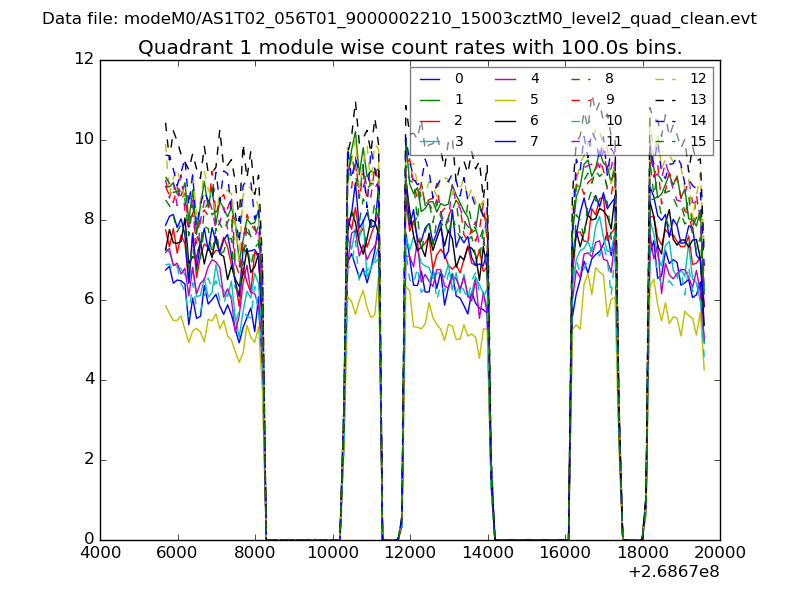 |
 |
| Module-wise count rates for Quadrant C Data is divided into 100 sec bins |
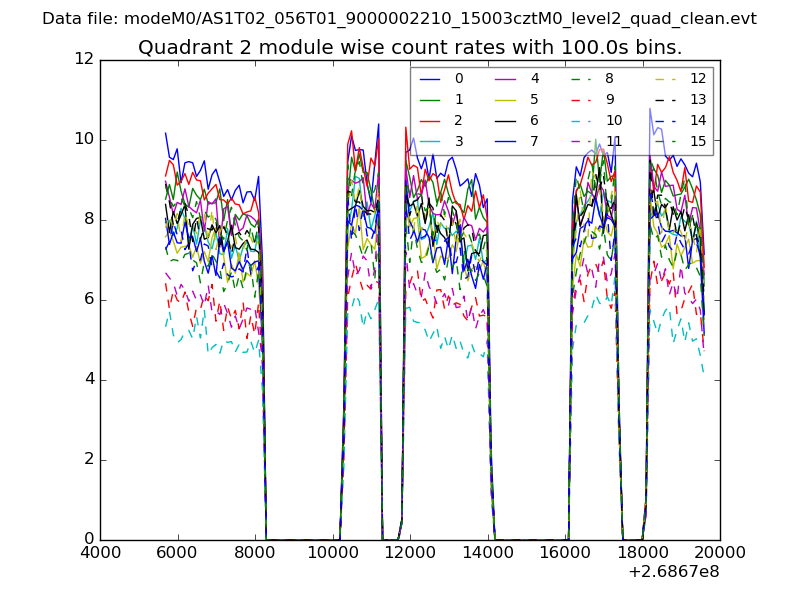 |
 |
| Module-wise count rates for Quadrant D Data is divided into 100 sec bins |
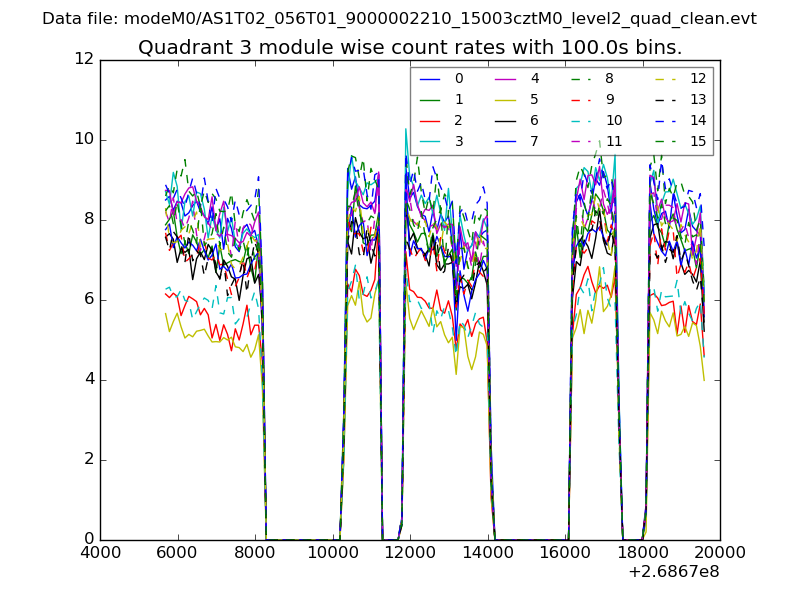 |
 |
| Parameter | Plot |
|---|---|
| CZT HV Monitor | 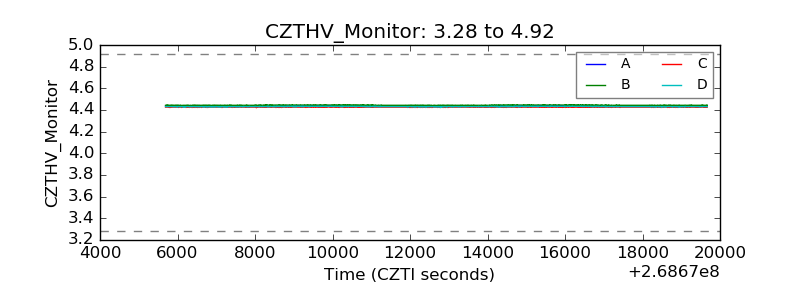 |
| D_VDD | 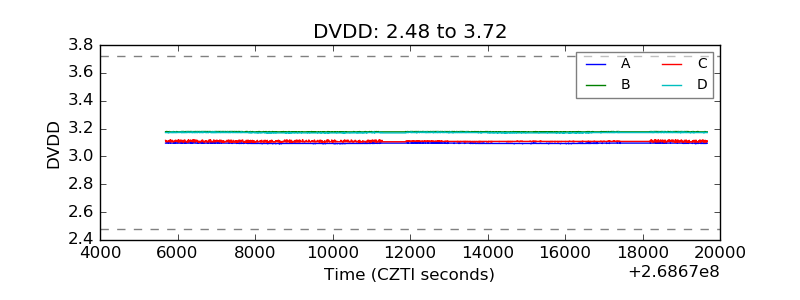 |
| Temperature 1 | 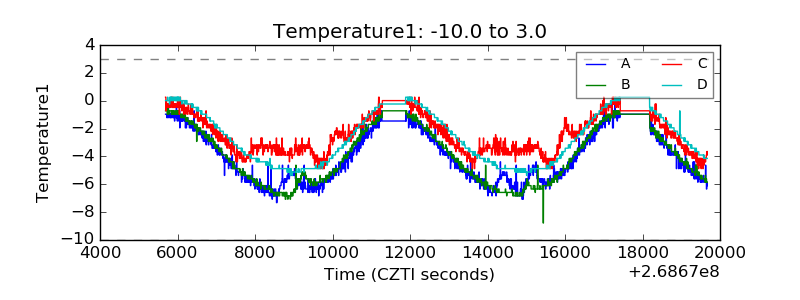 |
| Veto HV Monitor | 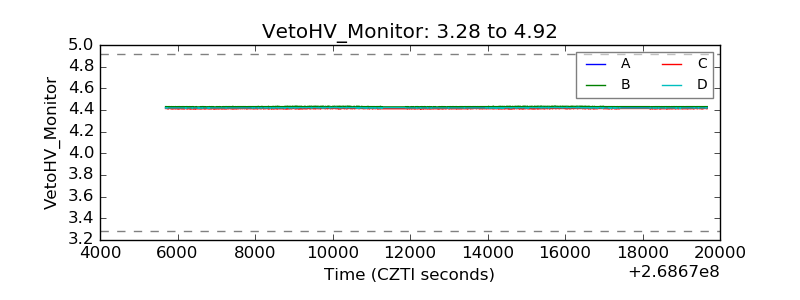 |
| Veto LLD | 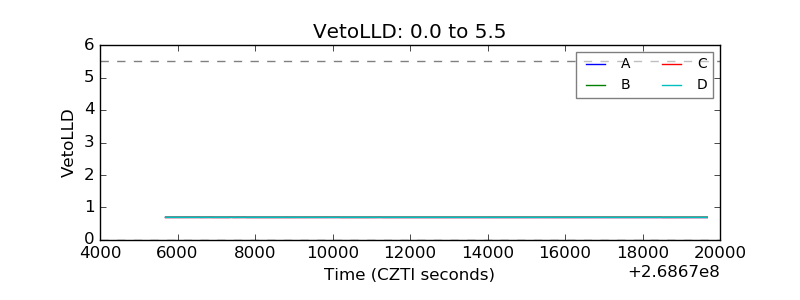 |
| Alpha Counter | 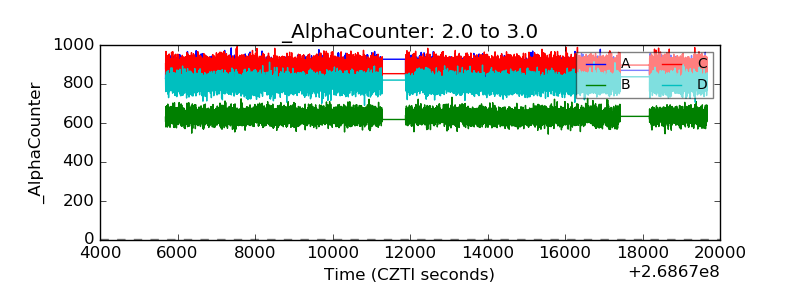 |
| _CPM_Rate |  |
| CZT Counter | 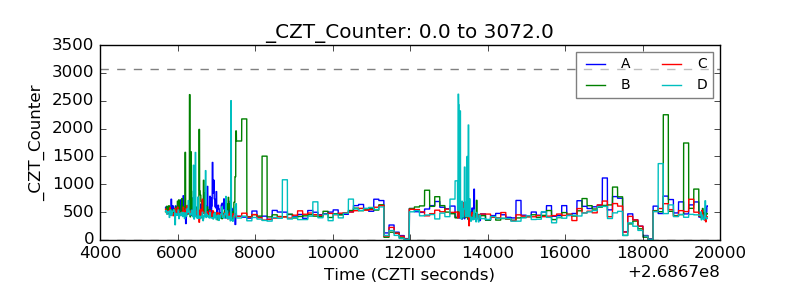 |
| +2.5 Volts monitor |  |
| +5 Volts monitor |  |
| _ROLL_ROT | 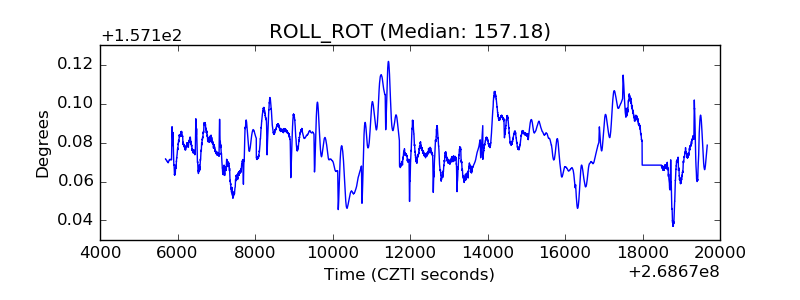 |
| _Roll_DEC | 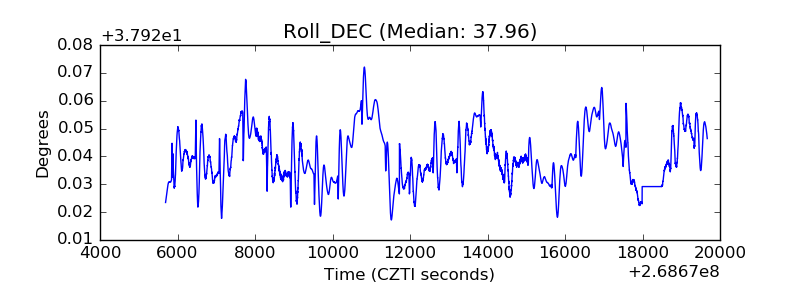 |
| _Roll_RA | 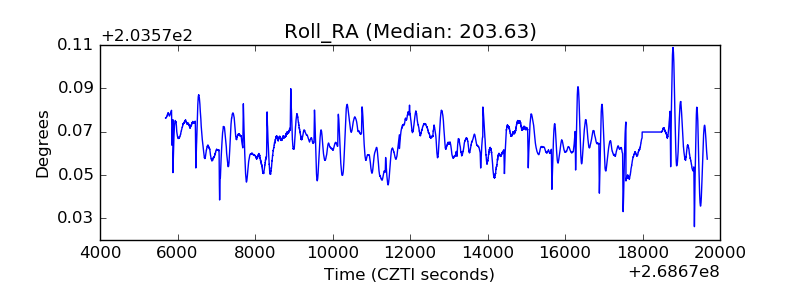 |
| Veto Counter | 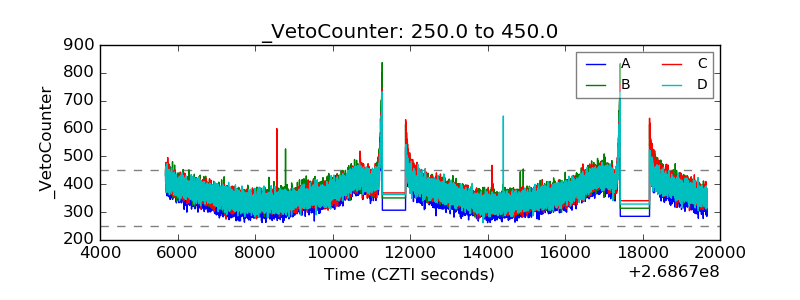 |