| Param | Original file | Final file |
|---|---|---|
| Filename | modeM0/AS1T02_056T01_9000002210_15005cztM0_level2.evt | modeM0/AS1T02_056T01_9000002210_15005cztM0_level2_quad_clean.evt |
| Size (bytes) | 484,349,760 | 85,072,320 |
| Size | 461.9 MB | 81.1 MB |
| Events in quadrant A | 3,620,124 | 540,069 |
| Events in quadrant B | 4,087,907 | 528,407 |
| Events in quadrant C | 3,337,912 | 534,036 |
| Events in quadrant D | 3,175,338 | 514,216 |
| Mode M0 | |||
|---|---|---|---|
| Quadrant | BADHDUFLAG | Total packets | Discarded packets |
| A | 0 | 15156 | 3 |
| B | 0 | 16453 | 2 |
| C | 0 | 13952 | 2 |
| D | 0 | 14089 | 2 |
| Mode M9 | |||
|---|---|---|---|
| Quadrant | BADHDUFLAG | Total packets | Discarded packets |
| A | 0 | 13 | 0 |
| B | 0 | 13 | 0 |
| C | 0 | 13 | 0 |
| D | 0 | 14 | 0 |
| Mode SS | |||
|---|---|---|---|
| Quadrant | BADHDUFLAG | Total packets | Discarded packets |
| A | 0 | 134 | 0 |
| B | 0 | 134 | 0 |
| C | 0 | 134 | 0 |
| D | 0 | 134 | 0 |
| Quadrant | Total seconds | Saturated seconds | Saturation percentage |
|---|---|---|---|
| A | 6585 | 60 | 0.911162% |
| B | 6585 | 302 | 4.586181% |
| C | 6585 | 24 | 0.364465% |
| D | 6585 | 52 | 0.789674% |
Noise dominated data is calculated using 1-second bins in cleaned event files. If a bin has >2000 counts, and if more than 50% of those come from <1% of pixels, then it is considered to be noise-dominated and hence unusable.
| Quadrant | # 1 sec bins | Bins with >0 counts | Bins with >2000 counts | High rate bins dominated by noise | Noise dominated (total time) | Noise dominated (detector-on time) | Marked lightcurve |
|---|---|---|---|---|---|---|---|
| A | 7626 | 6587 | 4 | 4 | 0.05% | 0.06% | 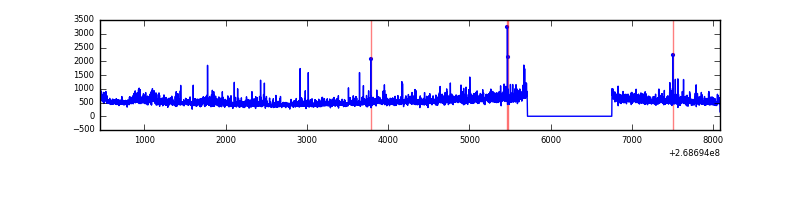 |
| B | 7626 | 6587 | 209 | 209 | 2.74% | 3.17% | 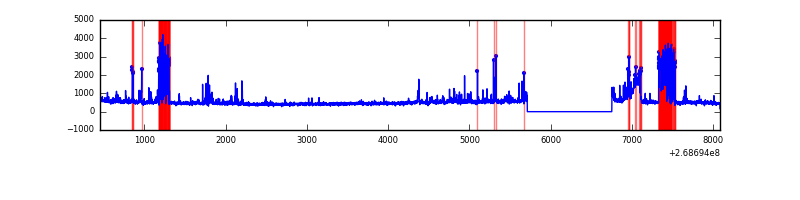 |
| C | 7626 | 6587 | 2 | 2 | 0.03% | 0.03% | 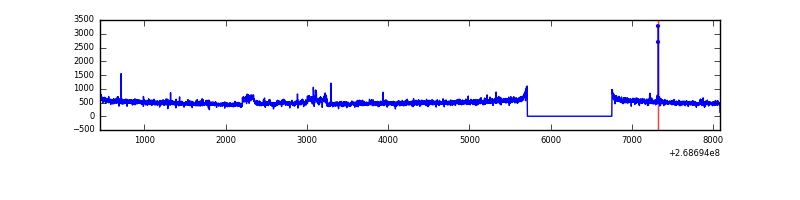 |
| D | 7626 | 6587 | 30 | 30 | 0.39% | 0.46% | 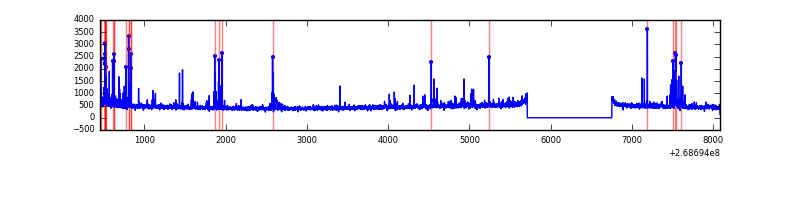 |
Top three noisy pixels from each quadrant. If the there are fewer than three noisy pixels in the level2.evt file, extra rows are filled as -1
| Pixel properties | Quadrant properties | ||||||
|---|---|---|---|---|---|---|---|
| Quadrant | DetID | PixID | Counts | Sigma | Mean | Median | Sigma |
| A | 1 | 162 | 195517 | 1216.35 | 785 | 768 | 160.1 |
| A | 12 | 189 | 145972 | 906.91 | 785 | 768 | 160.1 |
| A | 1 | 178 | 95226 | 589.96 | 785 | 768 | 160.1 |
| B | 10 | 16 | 795906 | 5412.46 | 775 | 755 | 146.9 |
| B | 0 | 229 | 100075 | 676.05 | 775 | 755 | 146.9 |
| B | 3 | 64 | 48841 | 327.31 | 775 | 755 | 146.9 |
| C | 3 | 233 | 336083 | 1880.93 | 765 | 770 | 178.3 |
| C | 12 | 4 | 9716 | 50.18 | 765 | 770 | 178.3 |
| C | 13 | 61 | 5529 | 26.7 | 765 | 770 | 178.3 |
| D | 7 | 38 | 113178 | 612.02 | 761 | 738 | 183.7 |
| D | 2 | 120 | 54583 | 293.08 | 761 | 738 | 183.7 |
| D | 7 | 223 | 34168 | 181.96 | 761 | 738 | 183.7 |
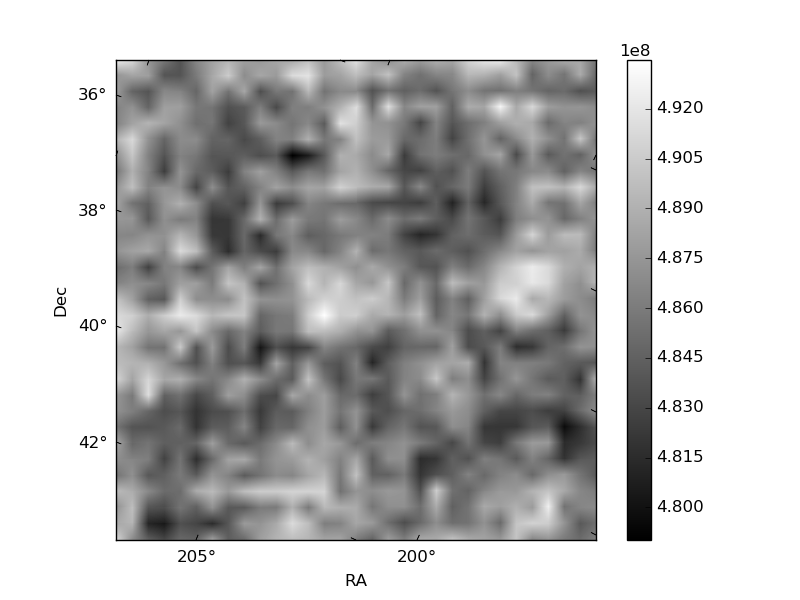
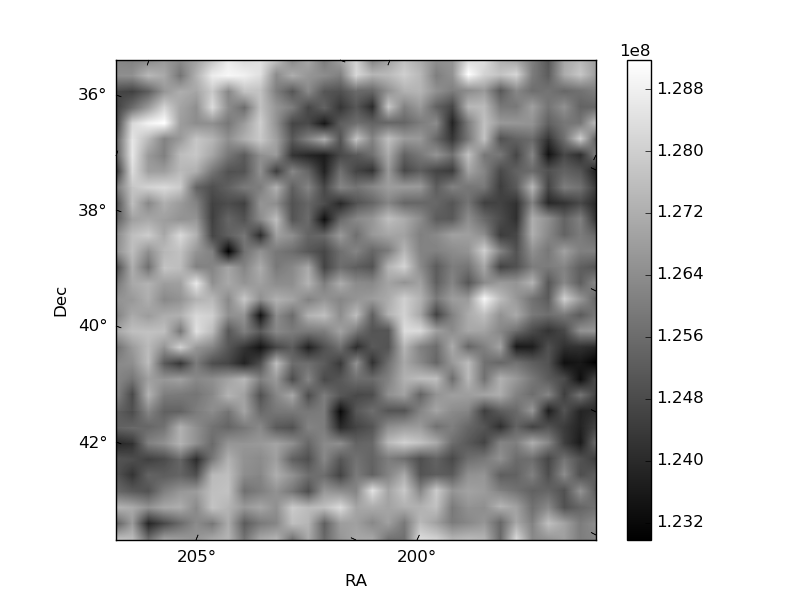
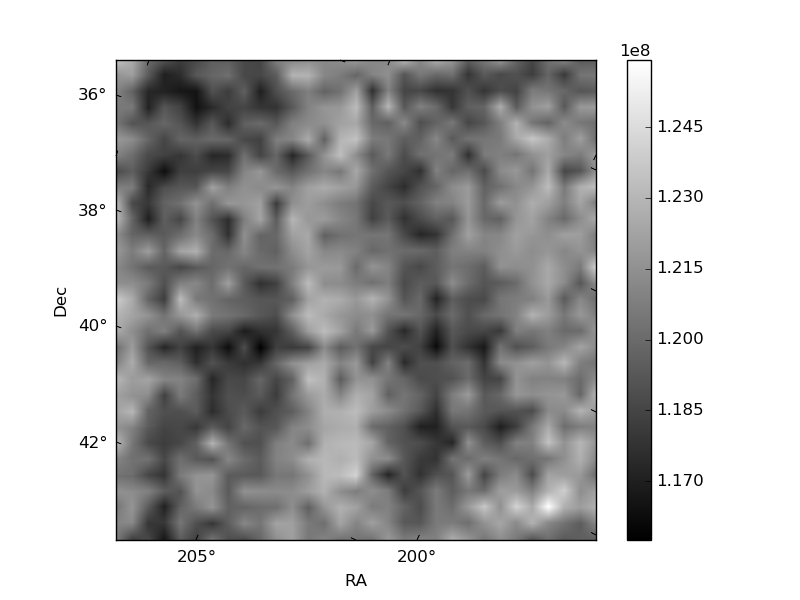
Histogram calculated using DETX and DETY for each event in the final _common_clean file
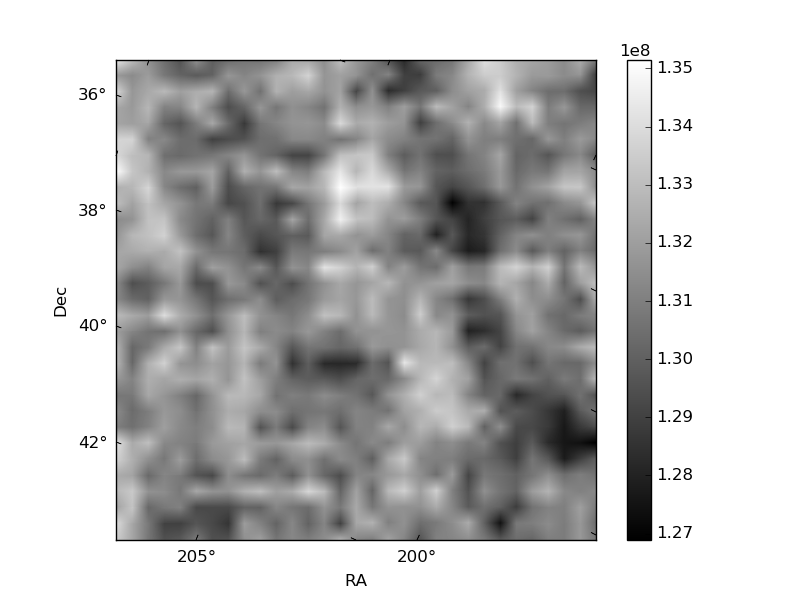
| Quadrant A | 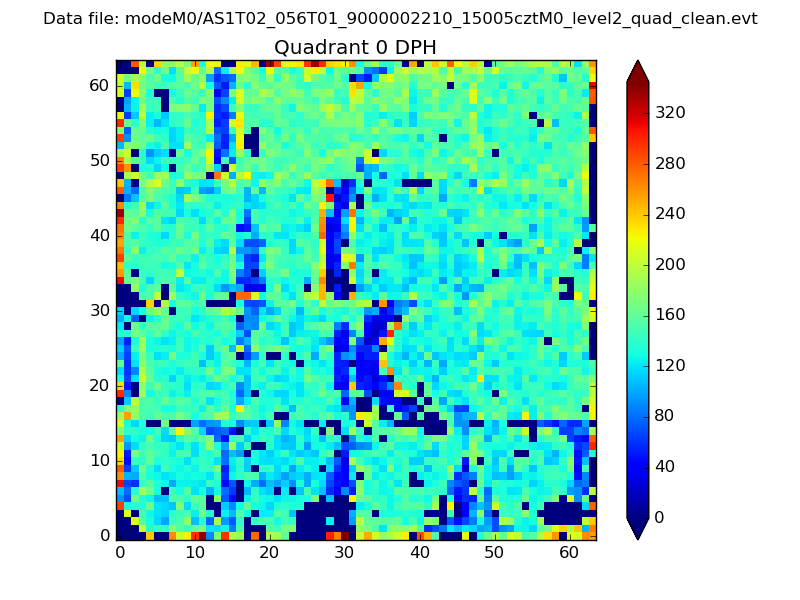 |
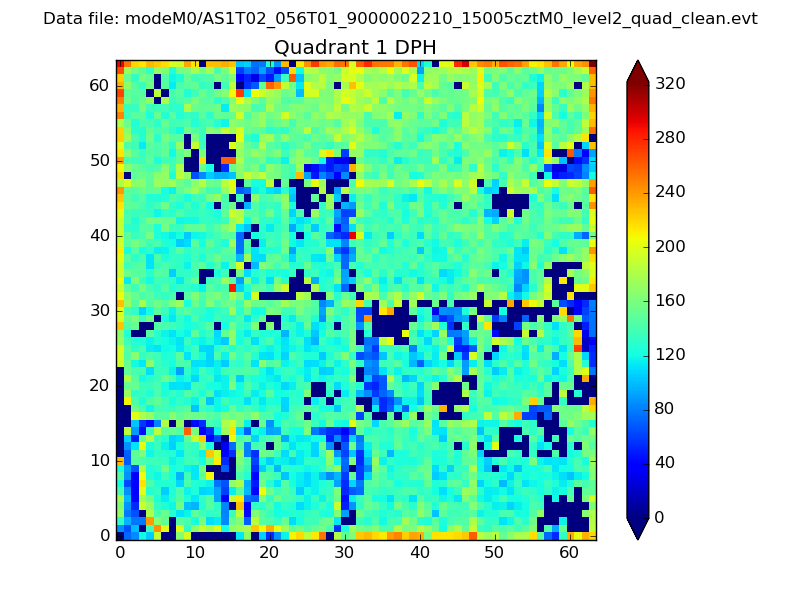 |
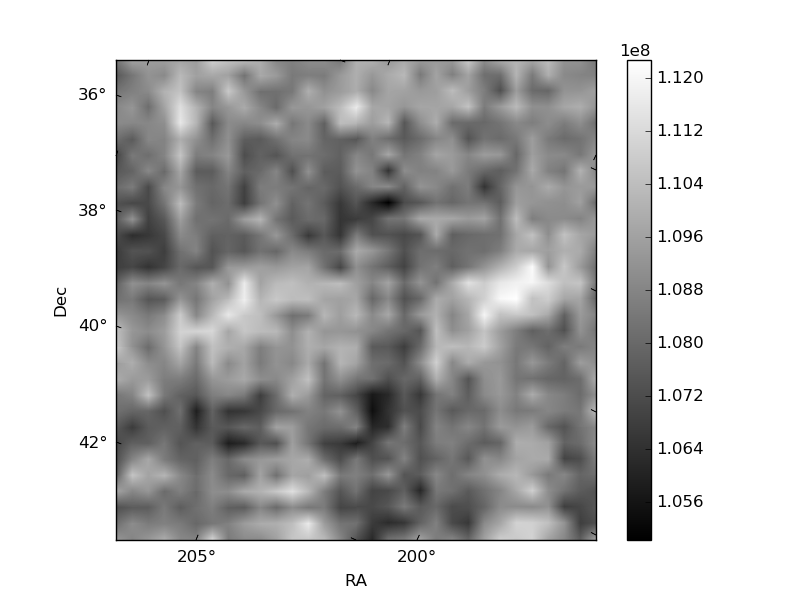
Quadrant B |
|---|---|---|---|
| Quadrant D |  |
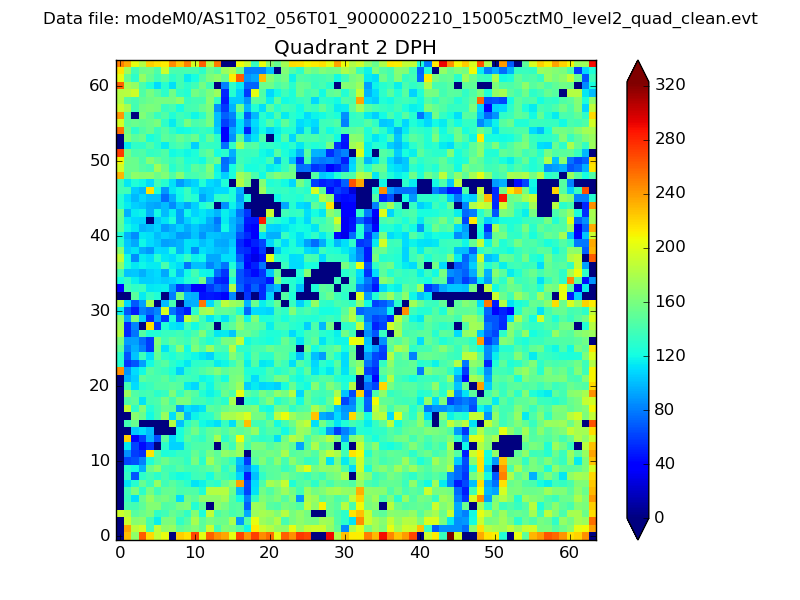 |
Quadrant C |
| Plot type | Count rate plots | Images |
|---|---|---|
| Comparison with Poisson distribution Blue bars denote a histogram of data divided into 1 sec bins. Red curve is a Poisson curve with rate = median count rate of data. |
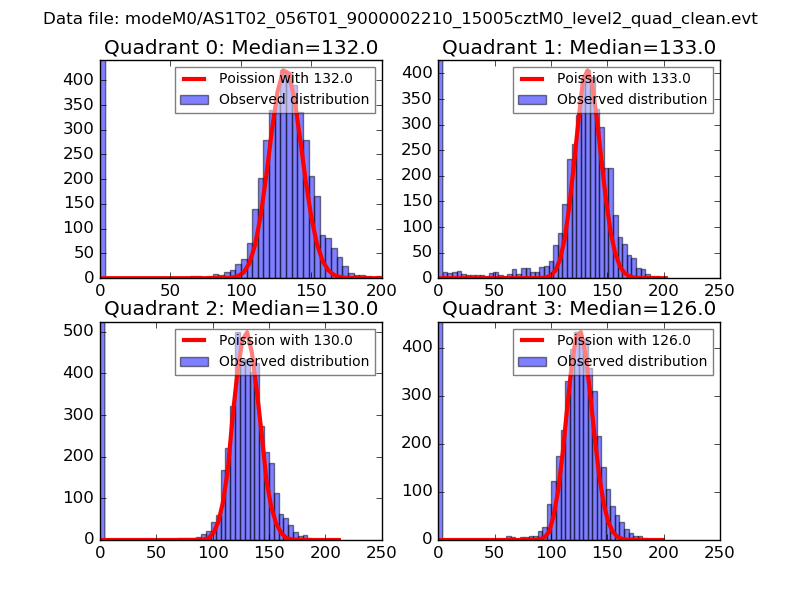 |
 |
| Quadrant-wise count rates Data is divided into 100 sec bins |
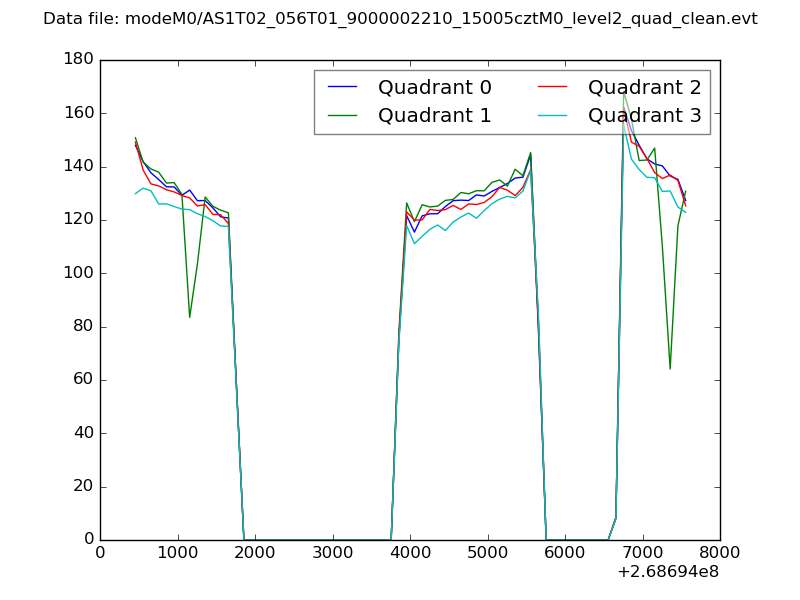 |
|
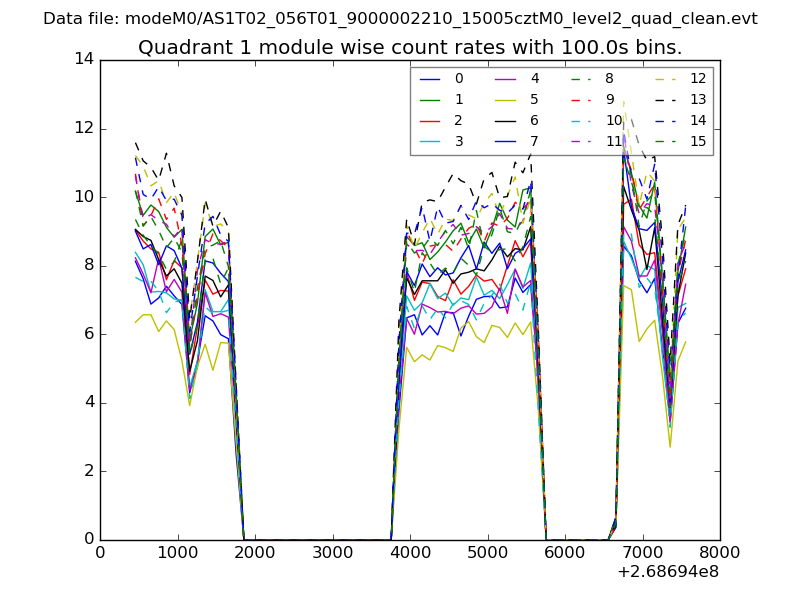
| Module-wise count rates for Quadrant A Data is divided into 100 sec bins |
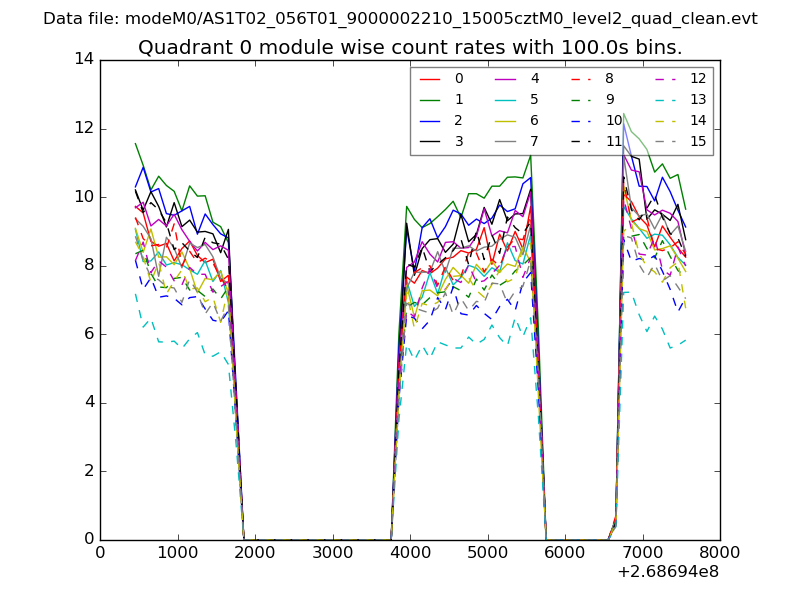 |
 |
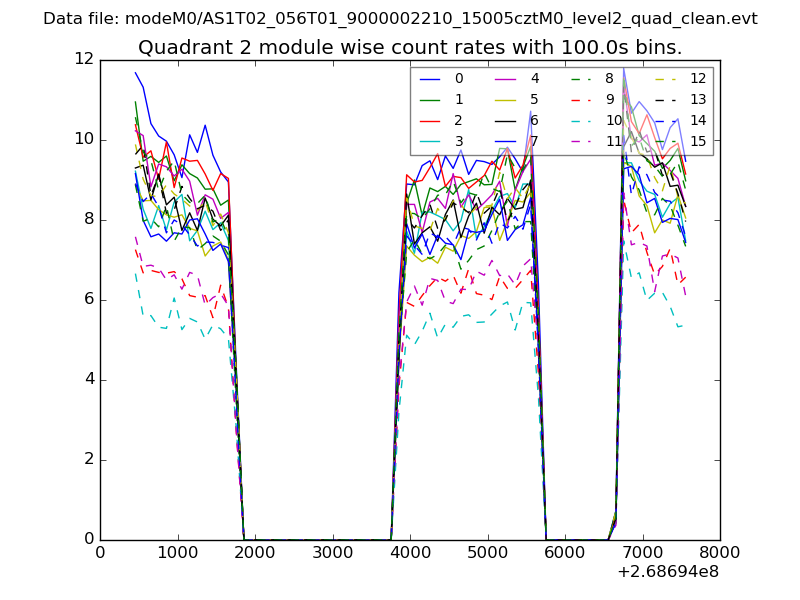
| Module-wise count rates for Quadrant B Data is divided into 100 sec bins |
 |
 |
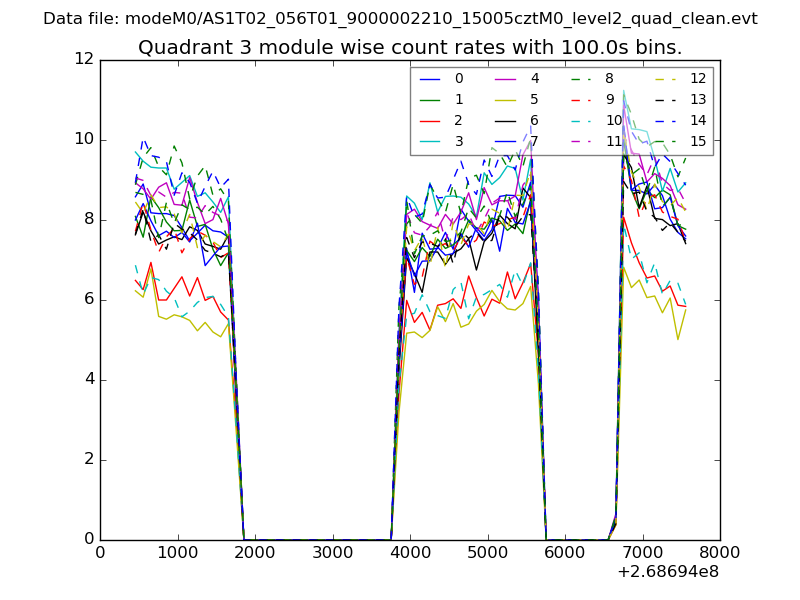
| Module-wise count rates for Quadrant C Data is divided into 100 sec bins |
 |
 |
| Module-wise count rates for Quadrant D Data is divided into 100 sec bins |
 |
 |
| Parameter | Plot |
|---|---|
| CZT HV Monitor | 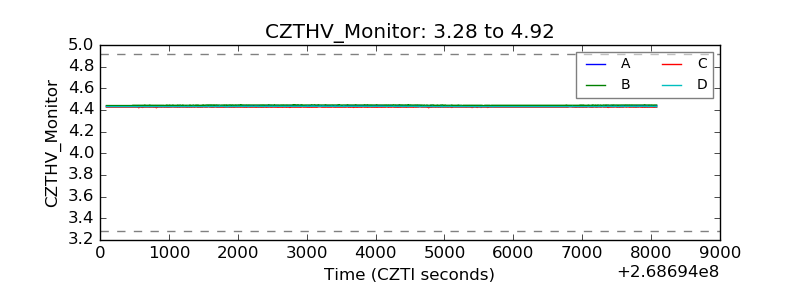 |
| D_VDD | 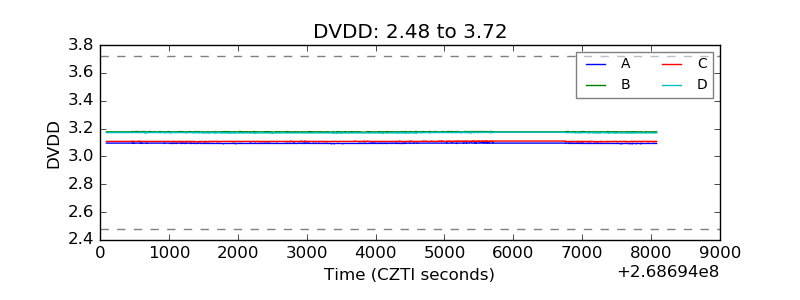 |
| Temperature 1 | 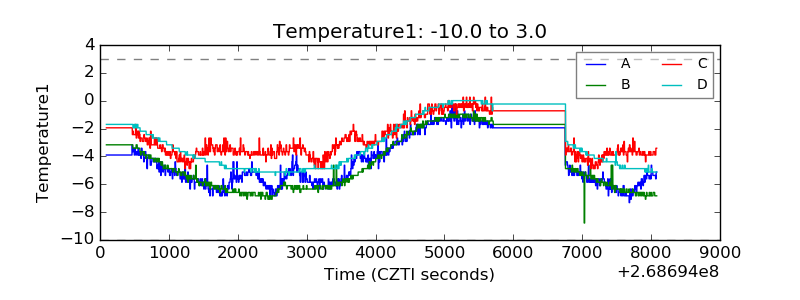 |
| Veto HV Monitor | 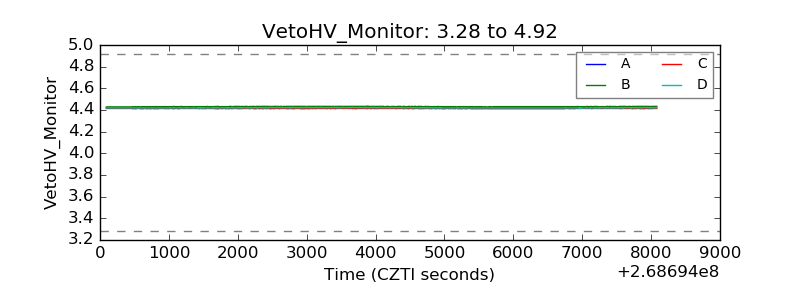 |
| Veto LLD | 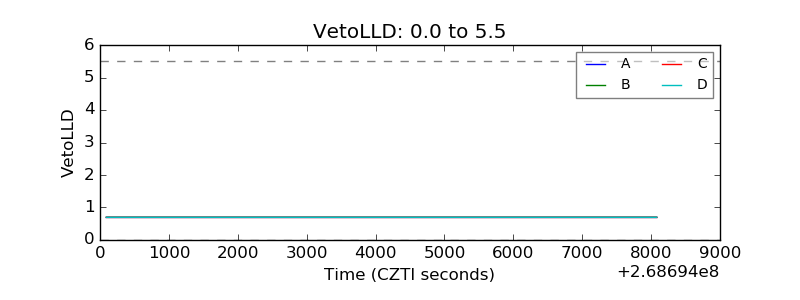 |
| Alpha Counter | 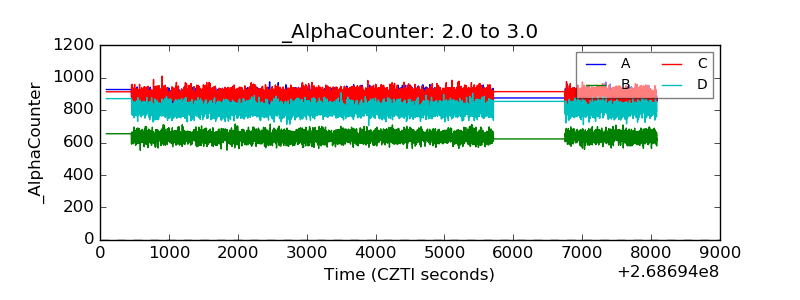 |
| _CPM_Rate | 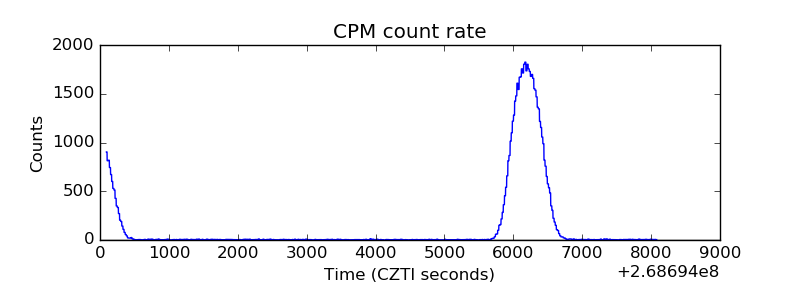 |
| CZT Counter | 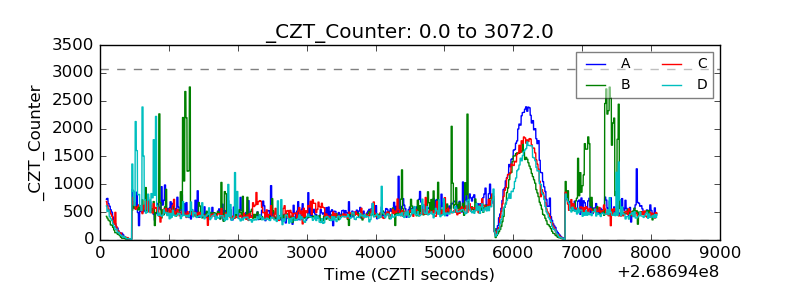 |
| +2.5 Volts monitor |  |
| +5 Volts monitor |  |
| _ROLL_ROT | 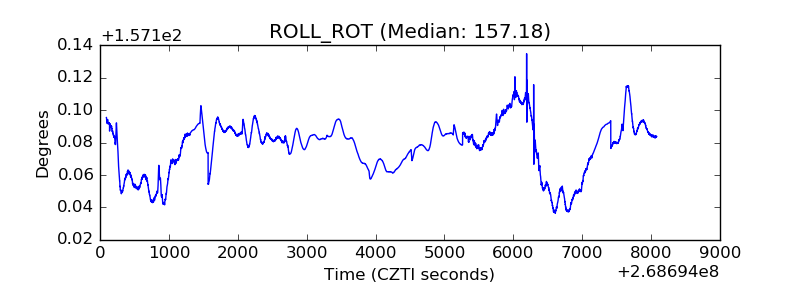 |
| _Roll_DEC | 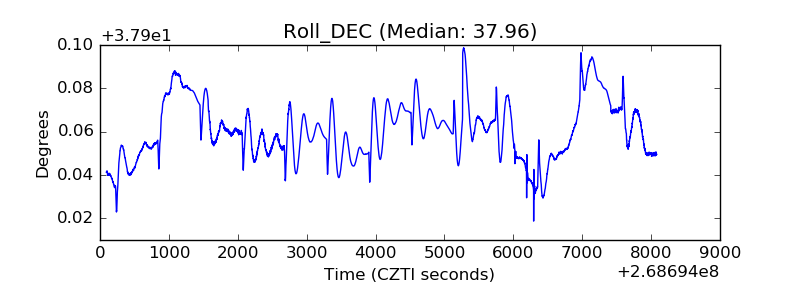 |
| _Roll_RA | 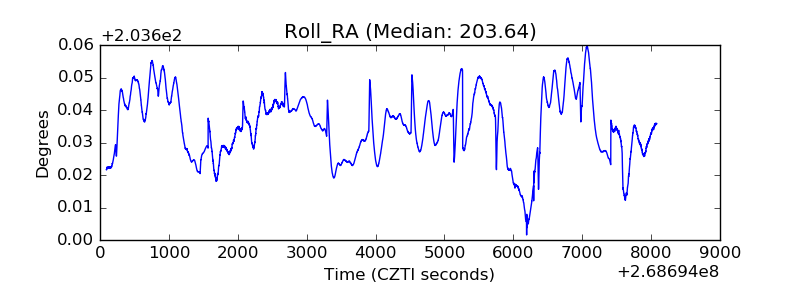 |
| Veto Counter | 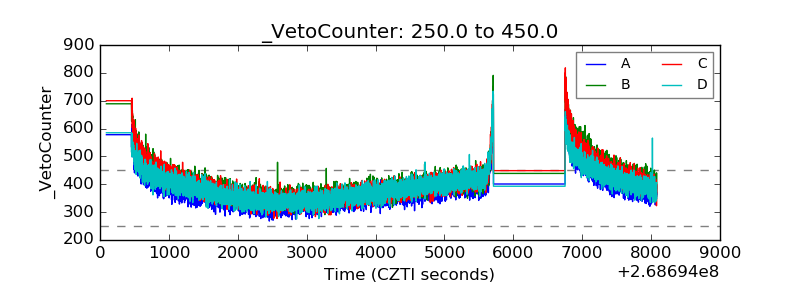 |