| Param | Original file | Final file |
|---|---|---|
| Filename | modeM0/AS1T02_056T01_9000002210_15006cztM0_level2.evt | modeM0/AS1T02_056T01_9000002210_15006cztM0_level2_quad_clean.evt |
| Size (bytes) | 474,390,720 | 77,204,160 |
| Size | 452.4 MB | 73.6 MB |
| Events in quadrant A | 3,627,659 | 484,328 |
| Events in quadrant B | 4,010,014 | 475,244 |
| Events in quadrant C | 3,232,480 | 475,393 |
| Events in quadrant D | 3,065,844 | 459,804 |
| Mode M0 | |||
|---|---|---|---|
| Quadrant | BADHDUFLAG | Total packets | Discarded packets |
| A | 0 | 14968 | 3 |
| B | 0 | 15977 | 2 |
| C | 0 | 13625 | 2 |
| D | 0 | 13371 | 2 |
| Mode M9 | |||
|---|---|---|---|
| Quadrant | BADHDUFLAG | Total packets | Discarded packets |
| A | 0 | 20 | 0 |
| B | 0 | 20 | 0 |
| C | 0 | 20 | 0 |
| D | 0 | 21 | 0 |
| Mode SS | |||
|---|---|---|---|
| Quadrant | BADHDUFLAG | Total packets | Discarded packets |
| A | 0 | 128 | 0 |
| B | 0 | 128 | 0 |
| C | 0 | 128 | 0 |
| D | 0 | 128 | 0 |
| Quadrant | Total seconds | Saturated seconds | Saturation percentage |
|---|---|---|---|
| A | 6350 | 29 | 0.456693% |
| B | 6350 | 255 | 4.015748% |
| C | 6350 | 10 | 0.157480% |
| D | 6350 | 28 | 0.440945% |
Noise dominated data is calculated using 1-second bins in cleaned event files. If a bin has >2000 counts, and if more than 50% of those come from <1% of pixels, then it is considered to be noise-dominated and hence unusable.
| Quadrant | # 1 sec bins | Bins with >0 counts | Bins with >2000 counts | High rate bins dominated by noise | Noise dominated (total time) | Noise dominated (detector-on time) | Marked lightcurve |
|---|---|---|---|---|---|---|---|
| A | 7536 | 6352 | 2 | 2 | 0.03% | 0.03% | 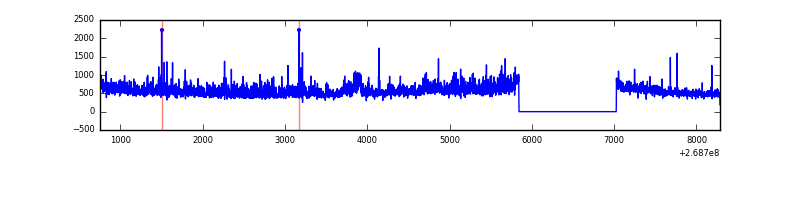 |
| B | 7536 | 6352 | 189 | 189 | 2.51% | 2.98% | 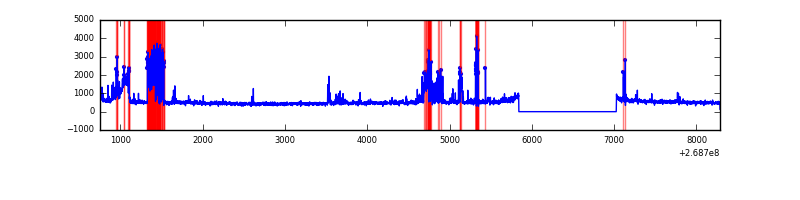 |
| C | 7536 | 6352 | 2 | 2 | 0.03% | 0.03% | 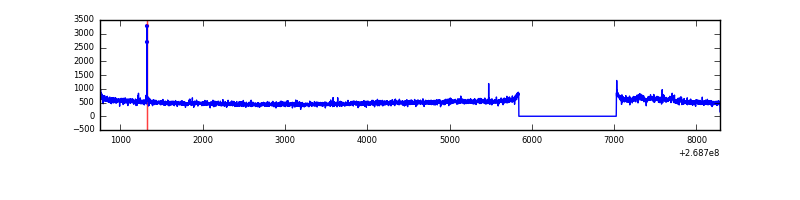 |
| D | 7536 | 6352 | 19 | 19 | 0.25% | 0.30% | 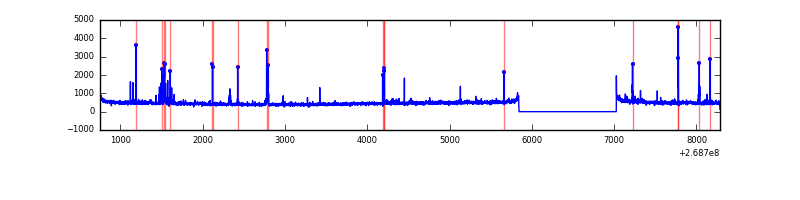 |
Top three noisy pixels from each quadrant. If the there are fewer than three noisy pixels in the level2.evt file, extra rows are filled as -1
| Pixel properties | Quadrant properties | ||||||
|---|---|---|---|---|---|---|---|
| Quadrant | DetID | PixID | Counts | Sigma | Mean | Median | Sigma |
| A | 1 | 162 | 204577 | 1289.19 | 782 | 764 | 158.1 |
| A | 12 | 189 | 144244 | 907.56 | 782 | 764 | 158.1 |
| A | 1 | 178 | 103072 | 647.14 | 782 | 764 | 158.1 |
| B | 10 | 16 | 506360 | 3444.28 | 775 | 759 | 146.8 |
| B | 3 | 64 | 360098 | 2447.91 | 775 | 759 | 146.8 |
| B | 0 | 230 | 26994 | 178.72 | 775 | 759 | 146.8 |
| C | 3 | 233 | 261463 | 1481.1 | 758 | 762 | 176.0 |
| C | 12 | 4 | 9876 | 51.78 | 758 | 762 | 176.0 |
| C | 13 | 61 | 5389 | 26.29 | 758 | 762 | 176.0 |
| D | 2 | 120 | 70681 | 350.74 | 749 | 733 | 199.4 |
| D | 12 | 235 | 36701 | 180.35 | 749 | 733 | 199.4 |
| D | 13 | 104 | 33825 | 165.93 | 749 | 733 | 199.4 |
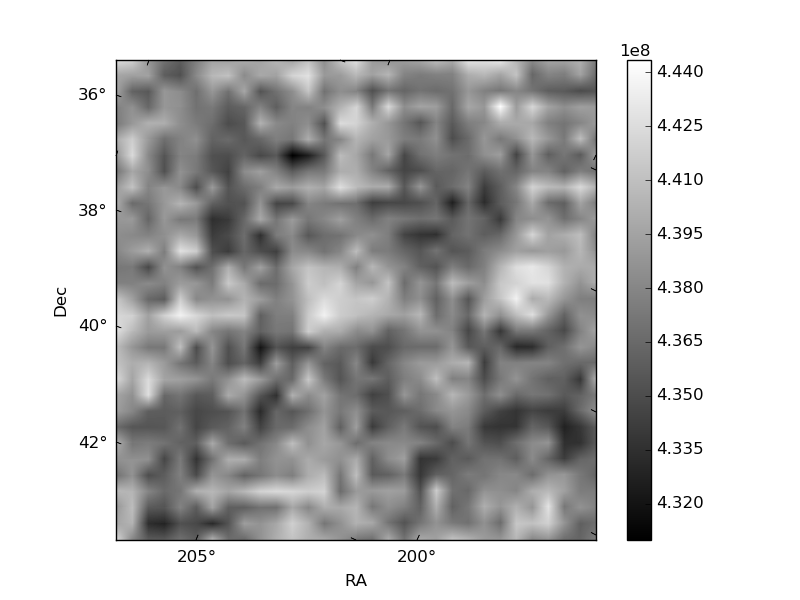
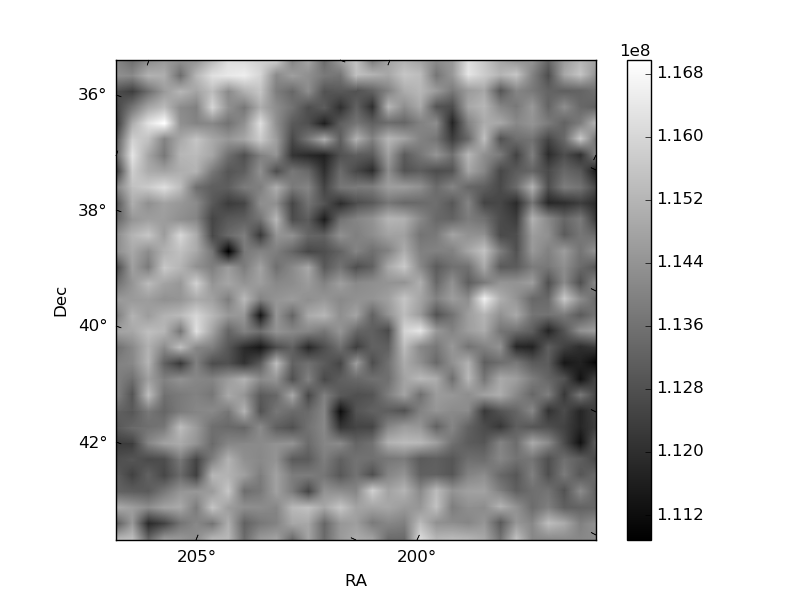
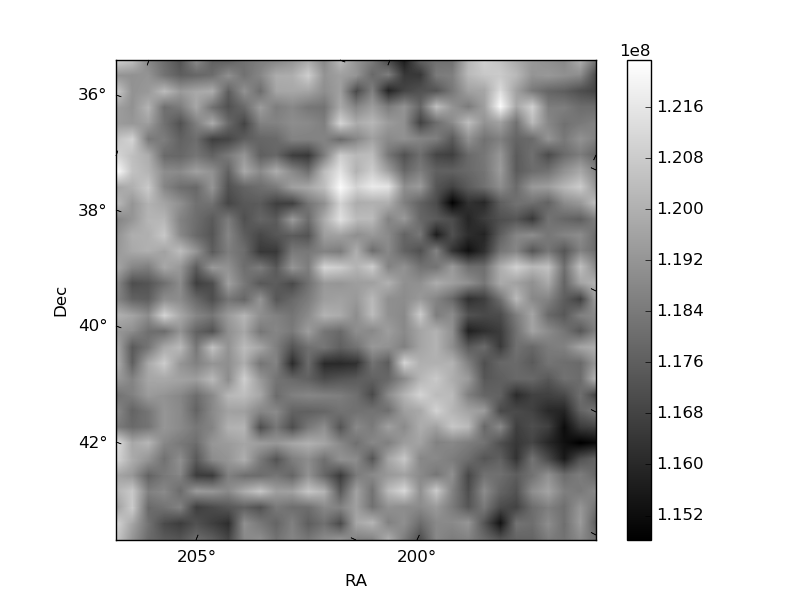
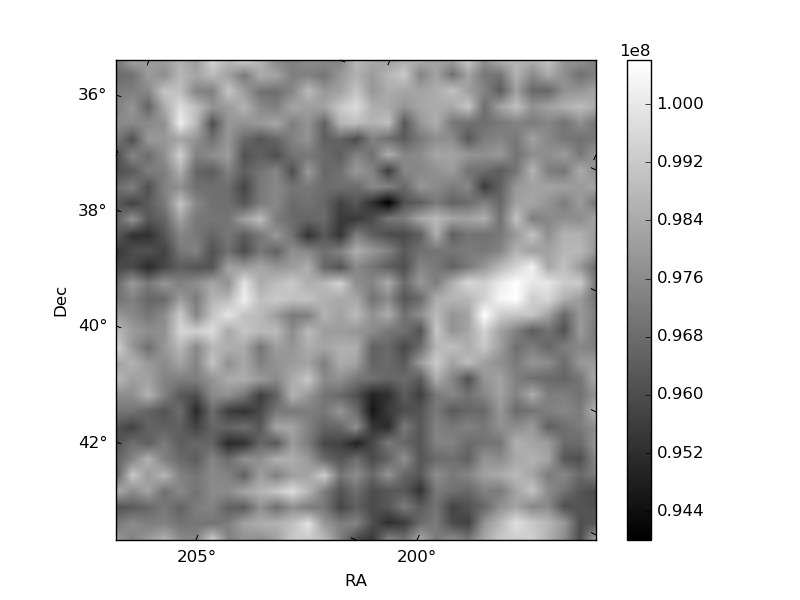
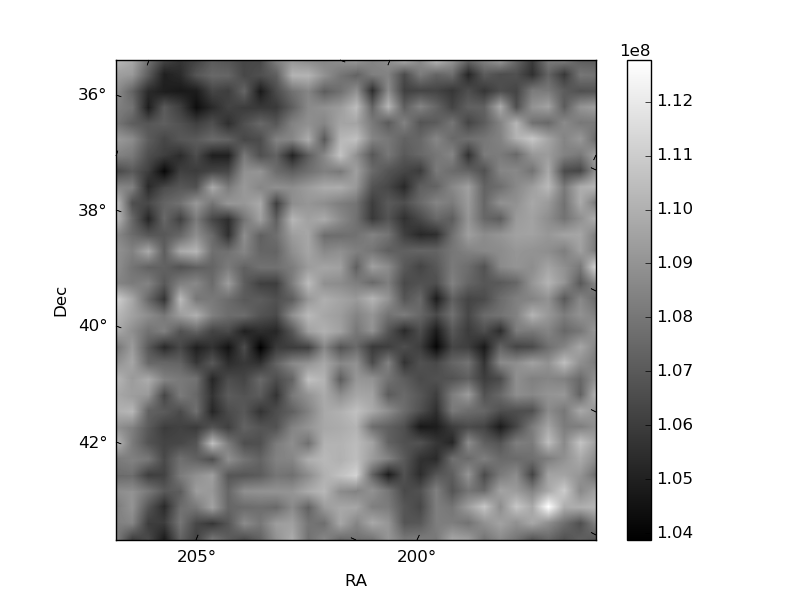
Histogram calculated using DETX and DETY for each event in the final _common_clean file
| Quadrant A | 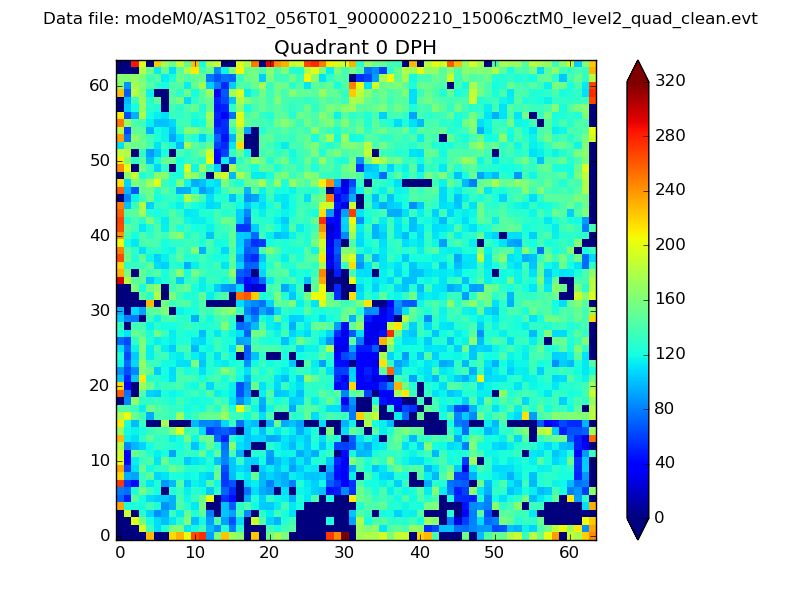 |
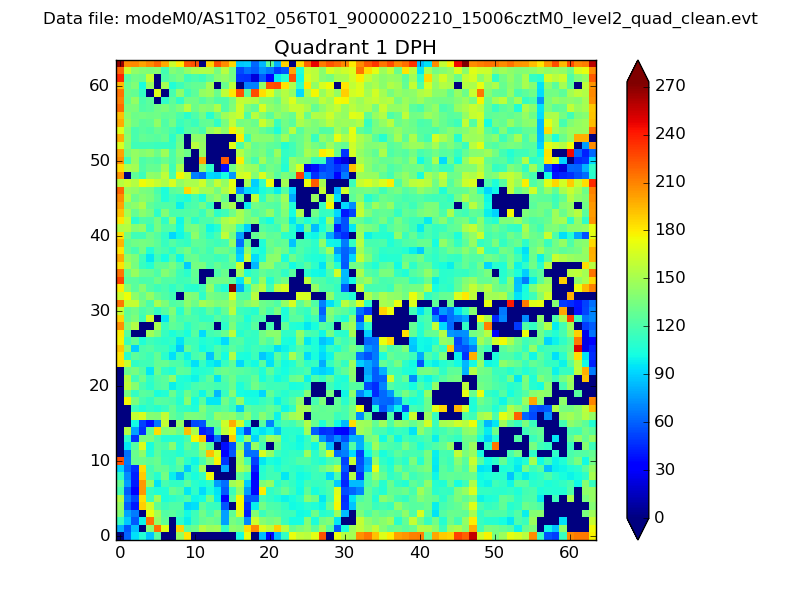 |
Quadrant B |
|---|---|---|---|
| Quadrant D | 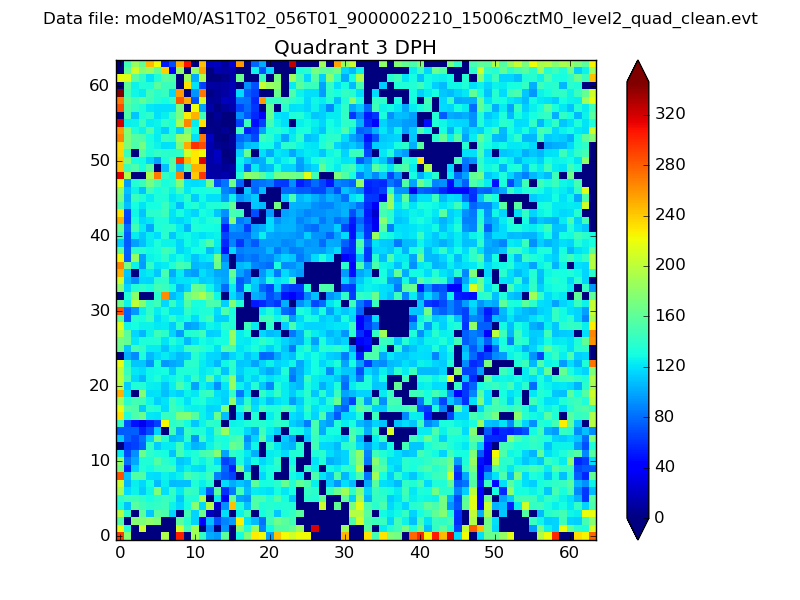 |
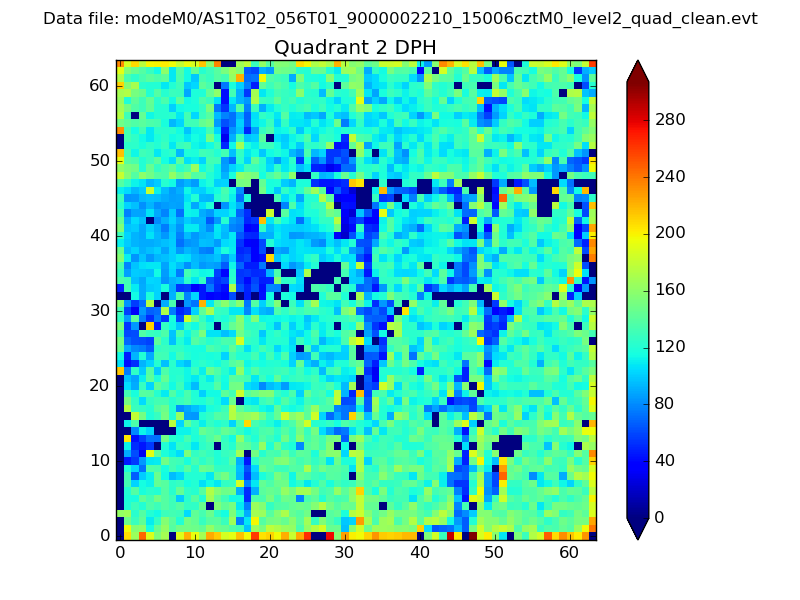 |
Quadrant C |
| Plot type | Count rate plots | Images |
|---|---|---|
| Comparison with Poisson distribution Blue bars denote a histogram of data divided into 1 sec bins. Red curve is a Poisson curve with rate = median count rate of data. |
 |
 |
| Quadrant-wise count rates Data is divided into 100 sec bins |
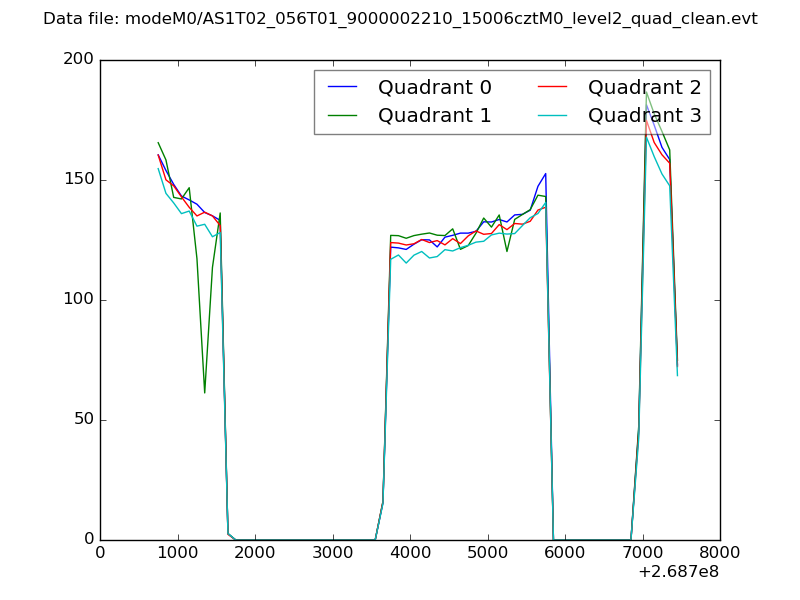 |
|
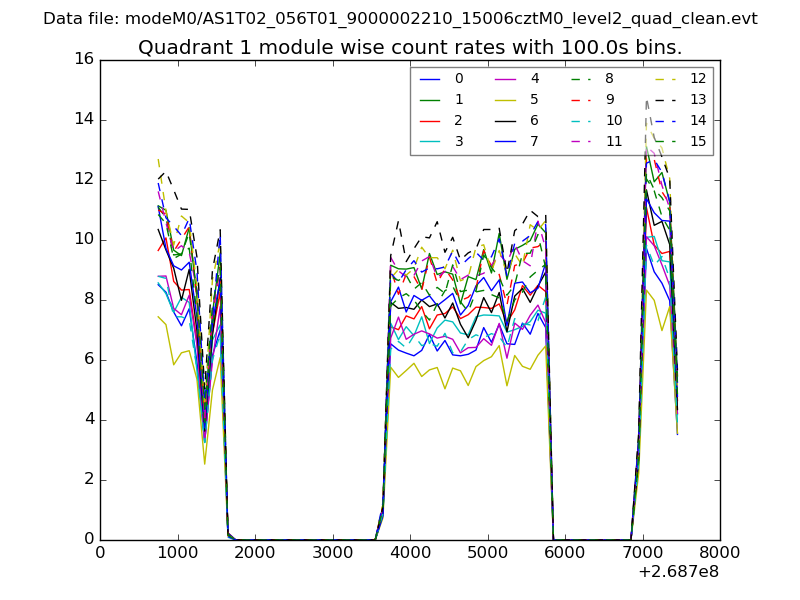
| Module-wise count rates for Quadrant A Data is divided into 100 sec bins |
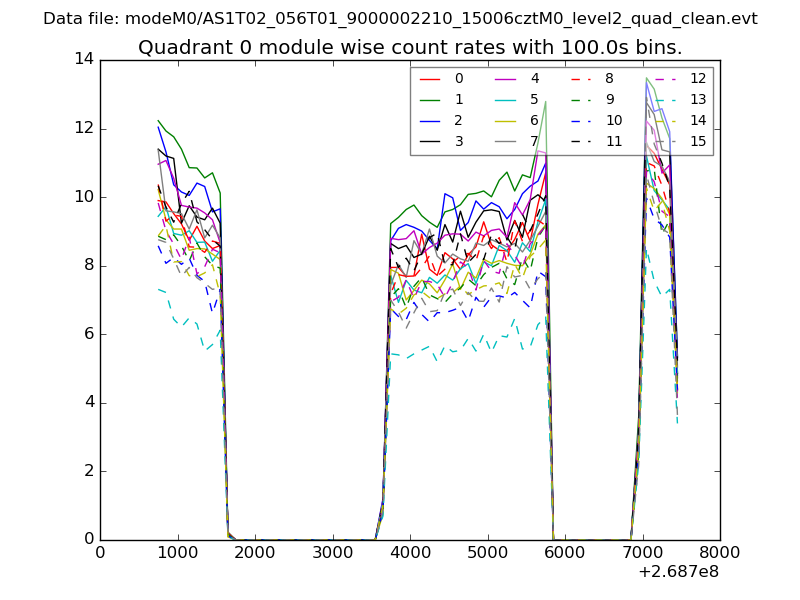 |
 |
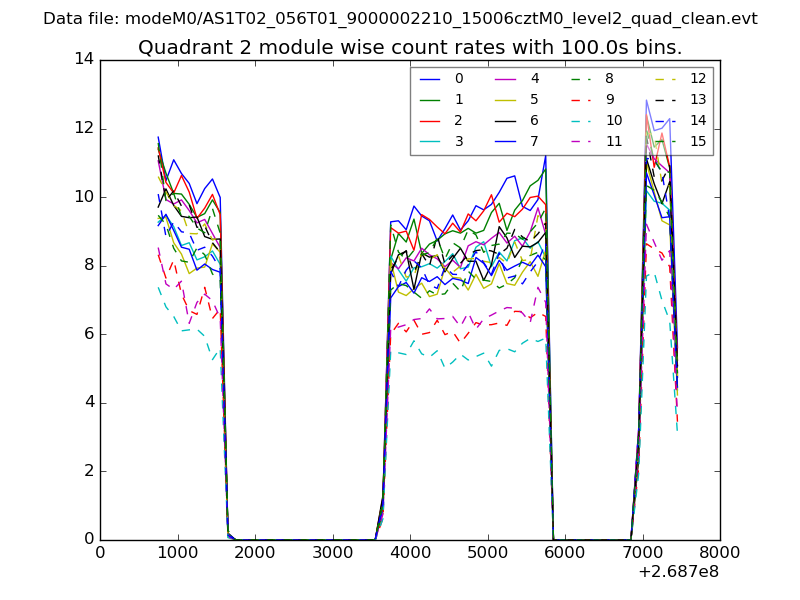
| Module-wise count rates for Quadrant B Data is divided into 100 sec bins |
 |
 |
| Module-wise count rates for Quadrant C Data is divided into 100 sec bins |
 |
 |
| Module-wise count rates for Quadrant D Data is divided into 100 sec bins |
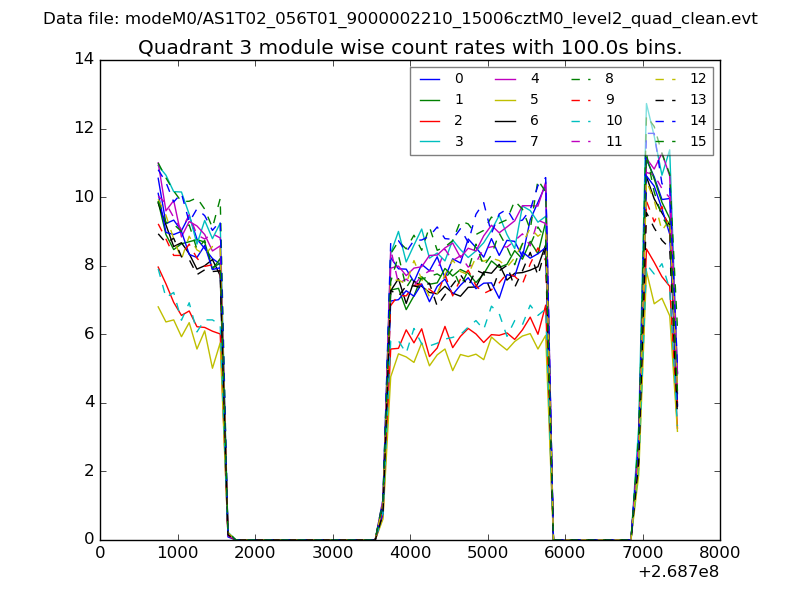 |
 |
| Parameter | Plot |
|---|---|
| CZT HV Monitor | 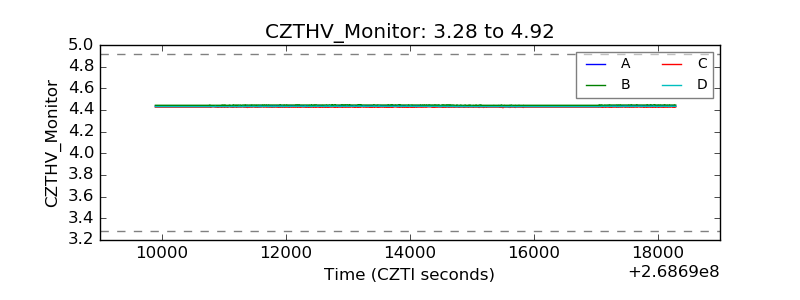 |
| D_VDD | 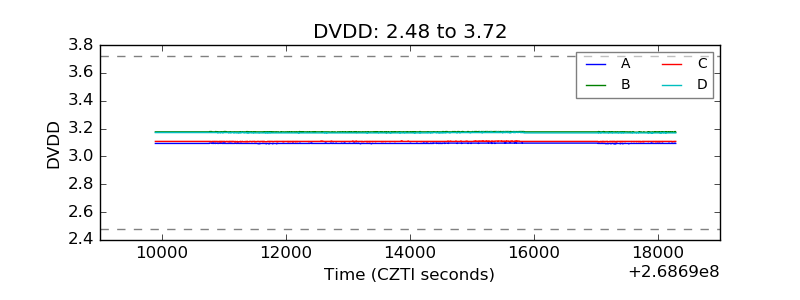 |
| Temperature 1 |  |
| Veto HV Monitor | 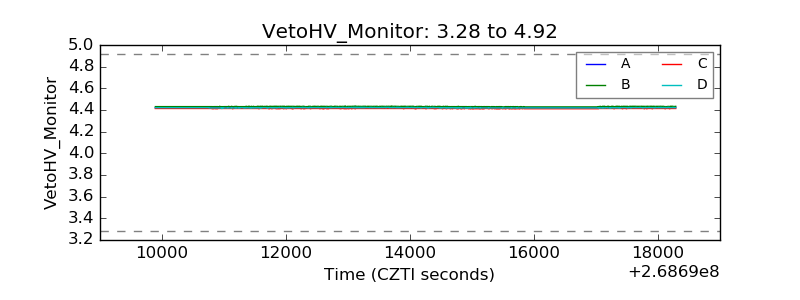 |
| Veto LLD | 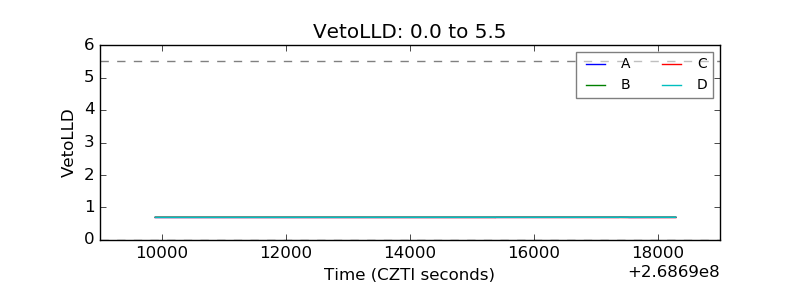 |
| Alpha Counter | 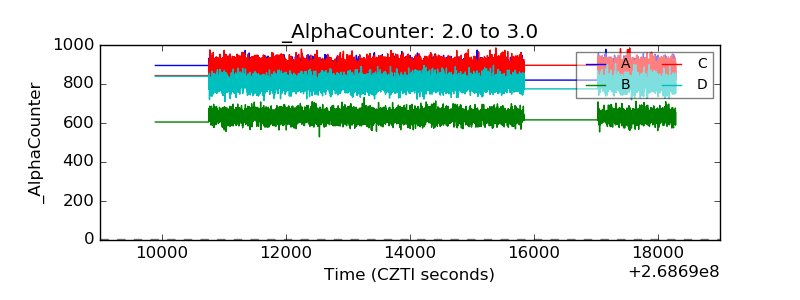 |
| _CPM_Rate | 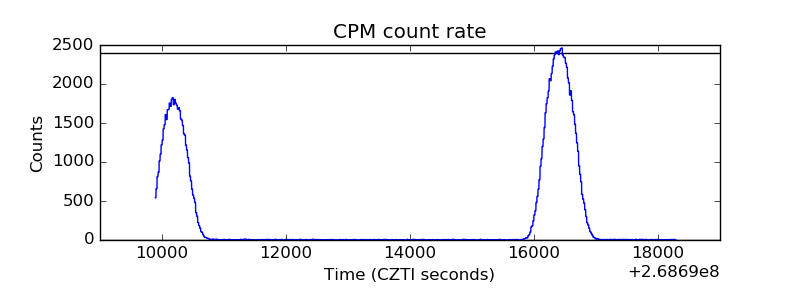 |
| CZT Counter |  |
| +2.5 Volts monitor |  |
| +5 Volts monitor |  |
| _ROLL_ROT | 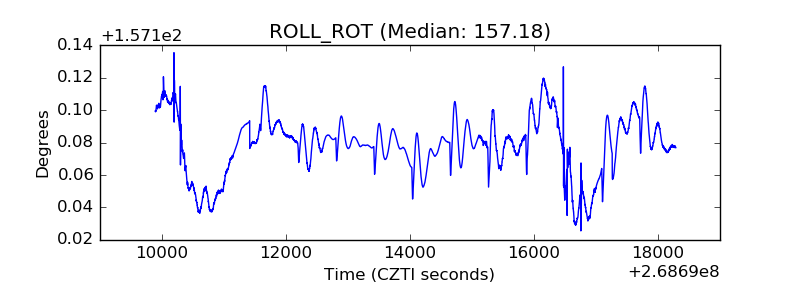 |
| _Roll_DEC | 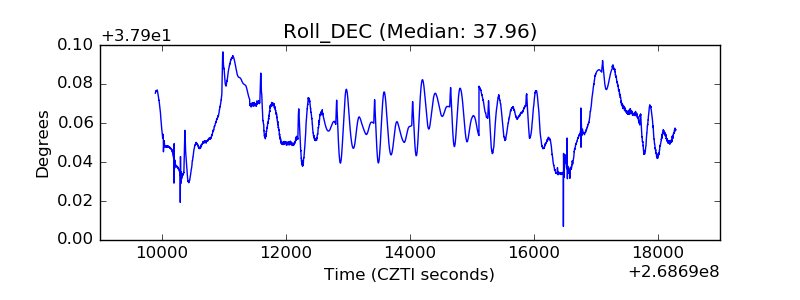 |
| _Roll_RA | 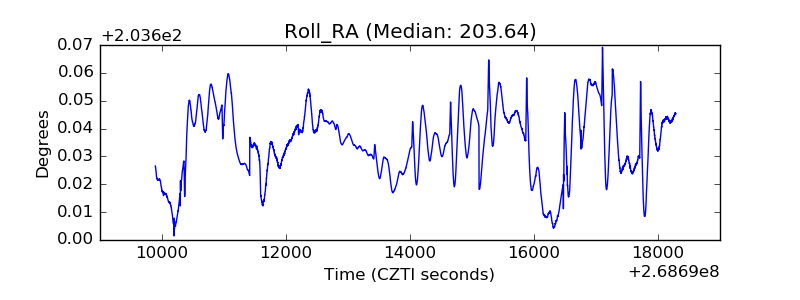 |
| Veto Counter | 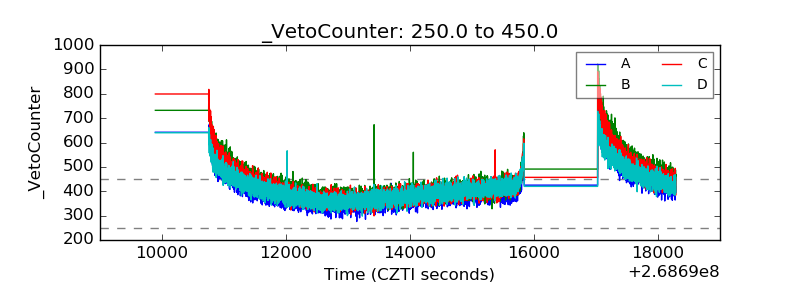 |