| Param | Original file | Final file |
|---|---|---|
| Filename | modeM0/AS1T02_056T01_9000002210_15008cztM0_level2.evt | modeM0/AS1T02_056T01_9000002210_15008cztM0_level2_quad_clean.evt |
| Size (bytes) | 480,654,720 | 69,347,520 |
| Size | 458.4 MB | 66.1 MB |
| Events in quadrant A | 3,526,483 | 417,336 |
| Events in quadrant B | 3,924,124 | 423,181 |
| Events in quadrant C | 3,455,993 | 408,505 |
| Events in quadrant D | 3,207,242 | 395,733 |
| Mode M0 | |||
|---|---|---|---|
| Quadrant | BADHDUFLAG | Total packets | Discarded packets |
| A | 0 | 14492 | 3 |
| B | 0 | 15679 | 2 |
| C | 0 | 14168 | 2 |
| D | 0 | 13679 | 2 |
| Mode M9 | |||
|---|---|---|---|
| Quadrant | BADHDUFLAG | Total packets | Discarded packets |
| A | 0 | 17 | 0 |
| B | 0 | 17 | 0 |
| C | 0 | 17 | 0 |
| D | 0 | 18 | 0 |
| Mode SS | |||
|---|---|---|---|
| Quadrant | BADHDUFLAG | Total packets | Discarded packets |
| A | 0 | 132 | 0 |
| B | 0 | 132 | 0 |
| C | 0 | 132 | 0 |
| D | 0 | 132 | 0 |
| Quadrant | Total seconds | Saturated seconds | Saturation percentage |
|---|---|---|---|
| A | 6525 | 34 | 0.521073% |
| B | 6525 | 195 | 2.988506% |
| C | 6525 | 12 | 0.183908% |
| D | 6525 | 21 | 0.321839% |
Noise dominated data is calculated using 1-second bins in cleaned event files. If a bin has >2000 counts, and if more than 50% of those come from <1% of pixels, then it is considered to be noise-dominated and hence unusable.
| Quadrant | # 1 sec bins | Bins with >0 counts | Bins with >2000 counts | High rate bins dominated by noise | Noise dominated (total time) | Noise dominated (detector-on time) | Marked lightcurve |
|---|---|---|---|---|---|---|---|
| A | 7796 | 6527 | 2 | 2 | 0.03% | 0.03% | 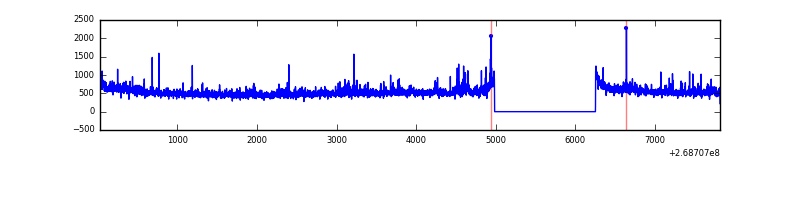 |
| B | 7796 | 6527 | 133 | 133 | 1.71% | 2.04% | 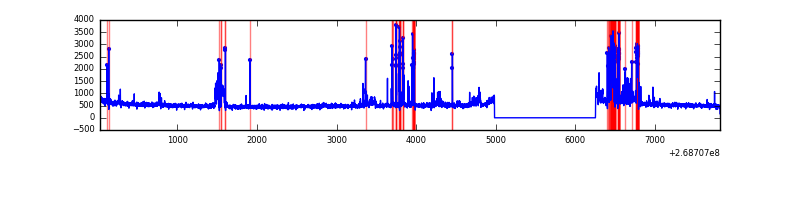 |
| C | 7796 | 6527 | 0 | 0 | 0.00% | 0.00% | 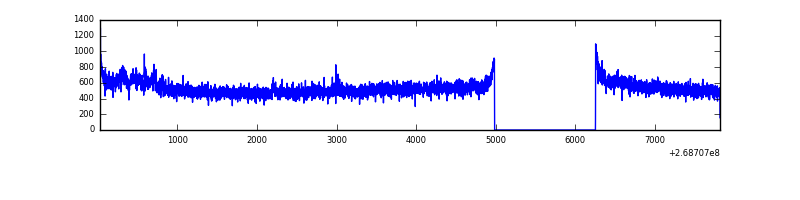 |
| D | 7796 | 6527 | 11 | 11 | 0.14% | 0.17% | 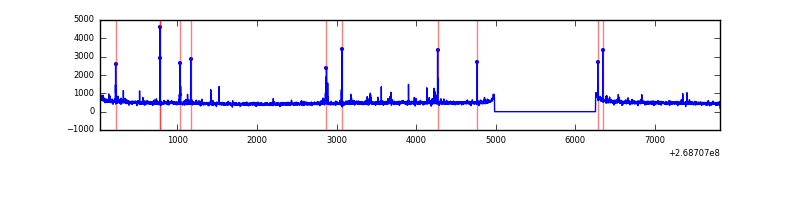 |
Top three noisy pixels from each quadrant. If the there are fewer than three noisy pixels in the level2.evt file, extra rows are filled as -1
| Pixel properties | Quadrant properties | ||||||
|---|---|---|---|---|---|---|---|
| Quadrant | DetID | PixID | Counts | Sigma | Mean | Median | Sigma |
| A | 1 | 162 | 97721 | 577.51 | 840 | 825 | 167.8 |
| A | 12 | 189 | 66224 | 389.78 | 840 | 825 | 167.8 |
| A | 1 | 178 | 44163 | 258.3 | 840 | 825 | 167.8 |
| B | 3 | 64 | 569599 | 3616.24 | 835 | 816 | 157.3 |
| B | 0 | 229 | 69340 | 435.67 | 835 | 816 | 157.3 |
| B | 12 | 111 | 17486 | 105.99 | 835 | 816 | 157.3 |
| C | 3 | 233 | 299840 | 1613.91 | 808 | 816 | 185.3 |
| C | 13 | 61 | 5939 | 27.65 | 808 | 816 | 185.3 |
| C | 3 | 232 | 3513 | 14.56 | 808 | 816 | 185.3 |
| D | 12 | 235 | 43387 | 203.79 | 800 | 782 | 209.1 |
| D | 2 | 120 | 40900 | 191.9 | 800 | 782 | 209.1 |
| D | 10 | 70 | 25874 | 120.02 | 800 | 782 | 209.1 |
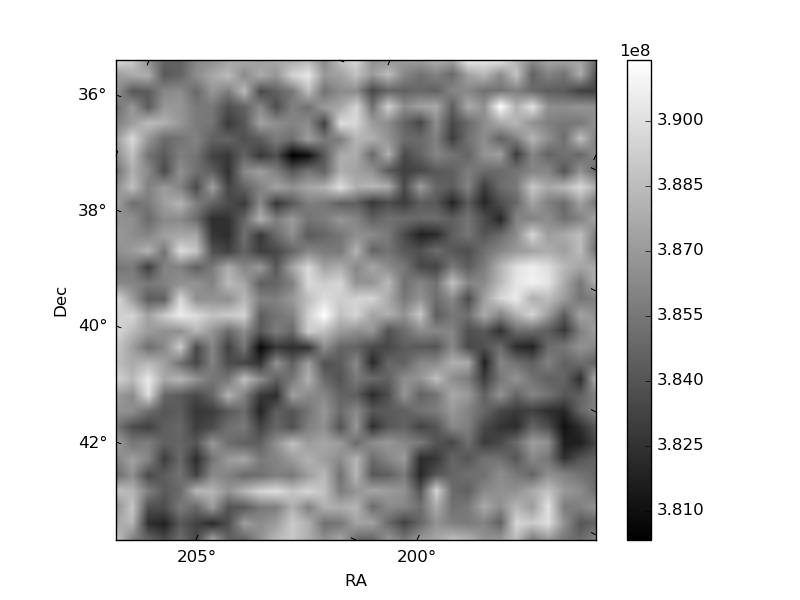
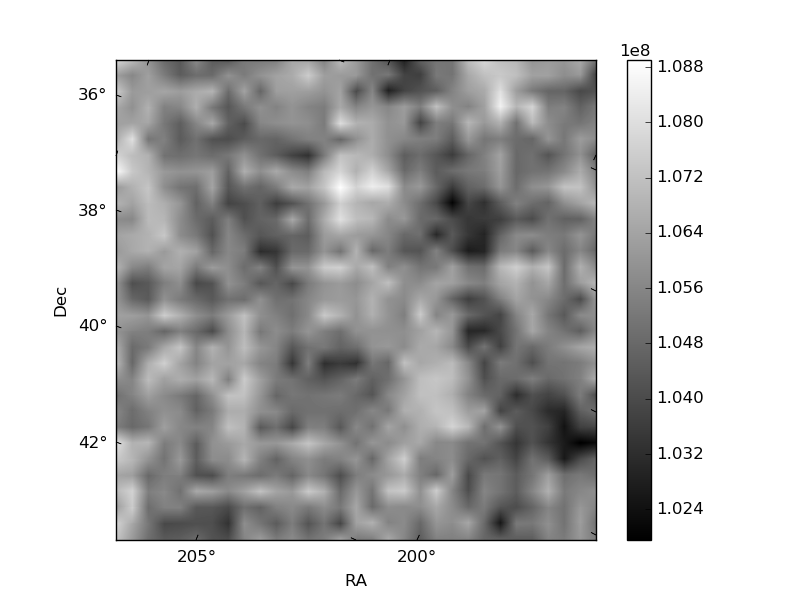
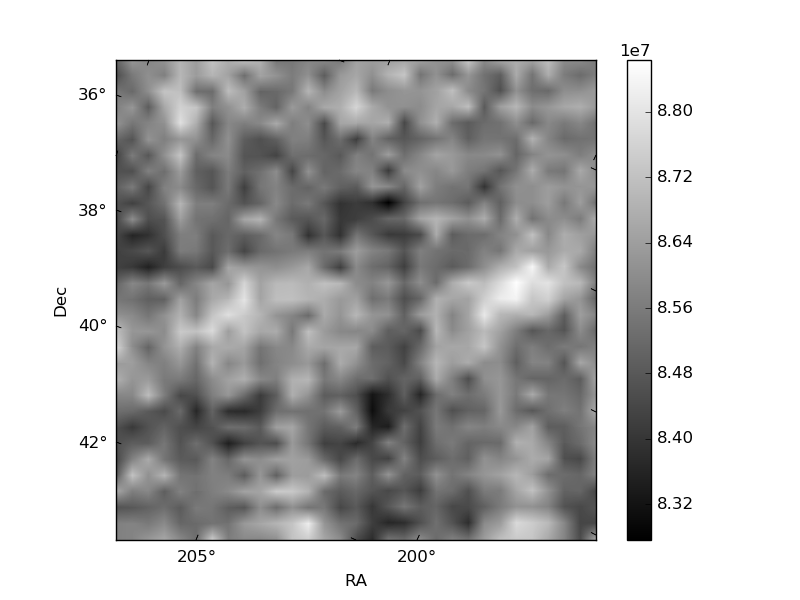
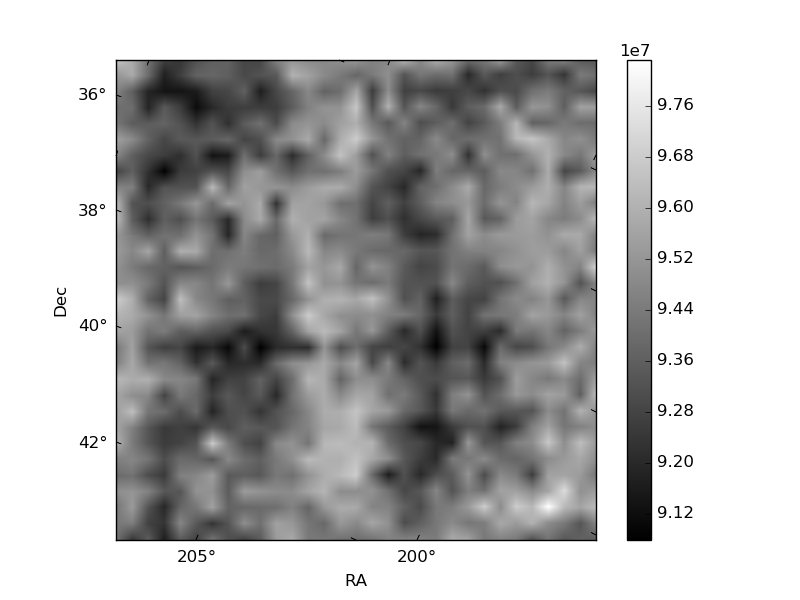
Histogram calculated using DETX and DETY for each event in the final _common_clean file
| Quadrant A | 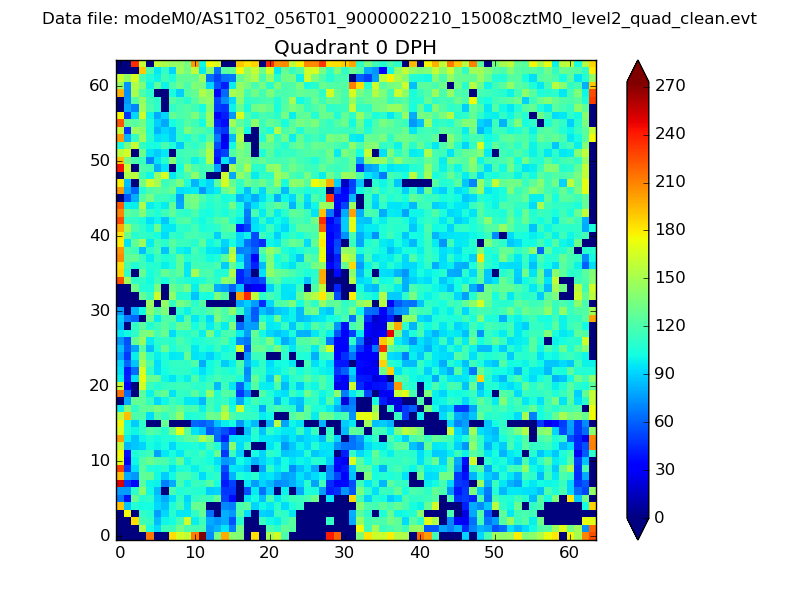 |
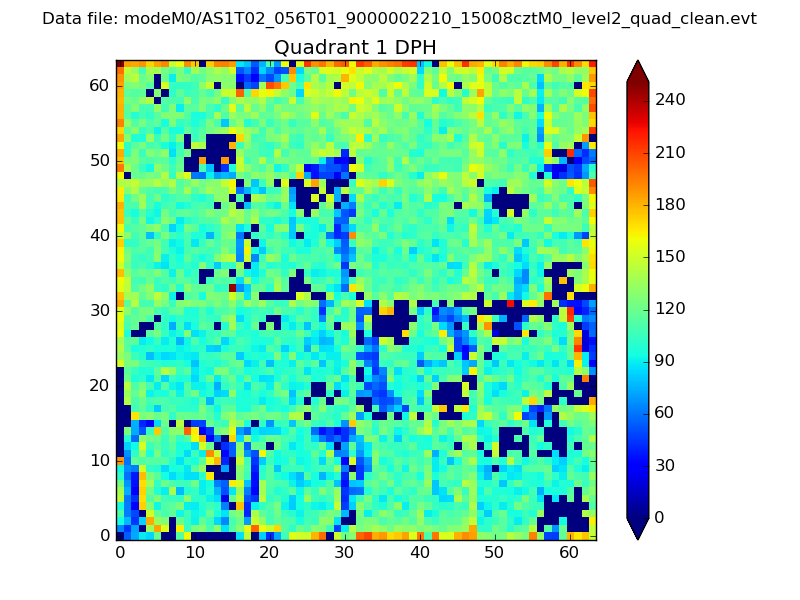 |
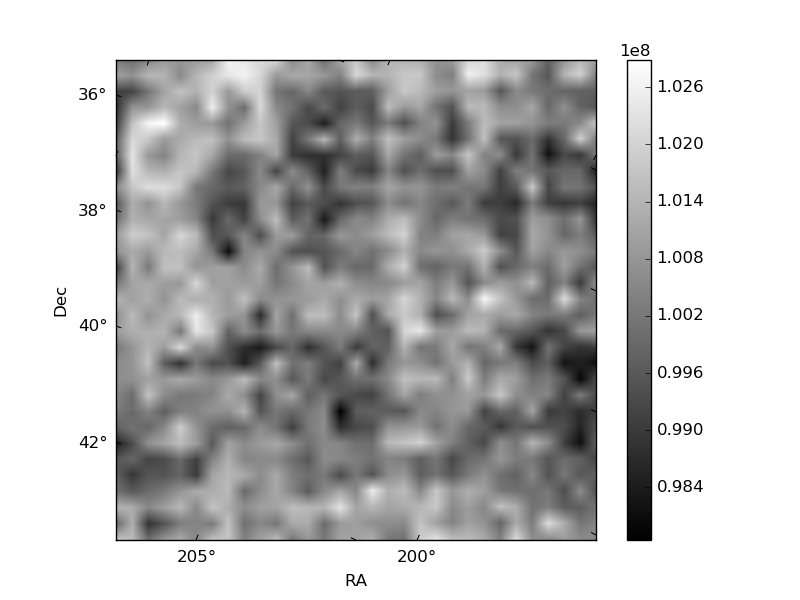
Quadrant B |
|---|---|---|---|
| Quadrant D |  |
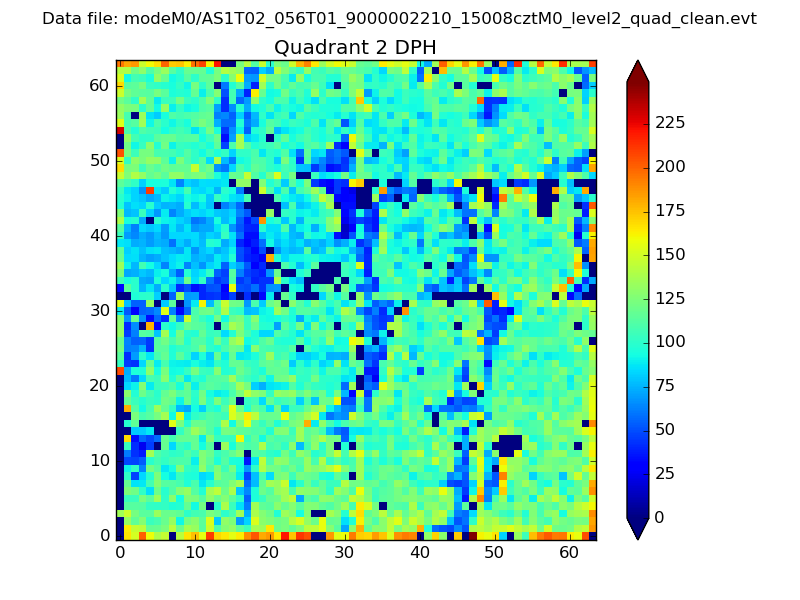 |
Quadrant C |
| Plot type | Count rate plots | Images |
|---|---|---|
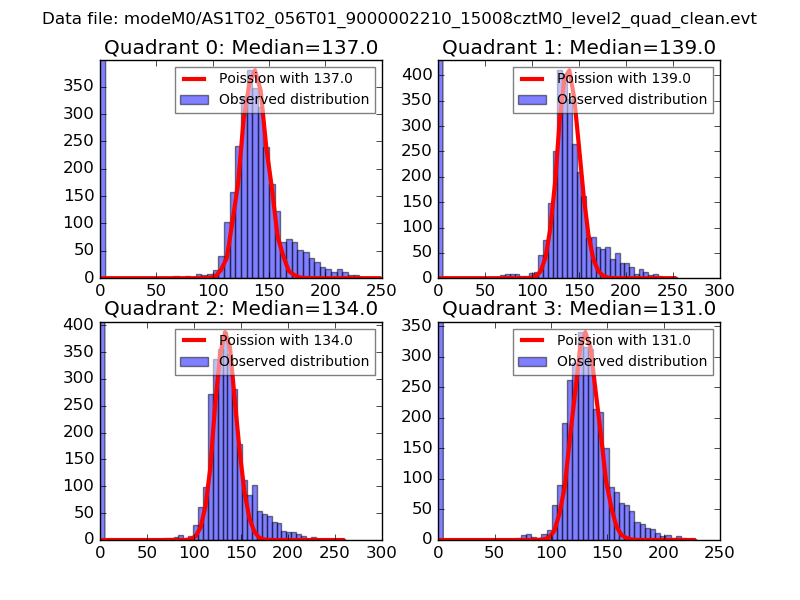
| Comparison with Poisson distribution Blue bars denote a histogram of data divided into 1 sec bins. Red curve is a Poisson curve with rate = median count rate of data. |
 |
 |
| Quadrant-wise count rates Data is divided into 100 sec bins |
 |
|
| Module-wise count rates for Quadrant A Data is divided into 100 sec bins |
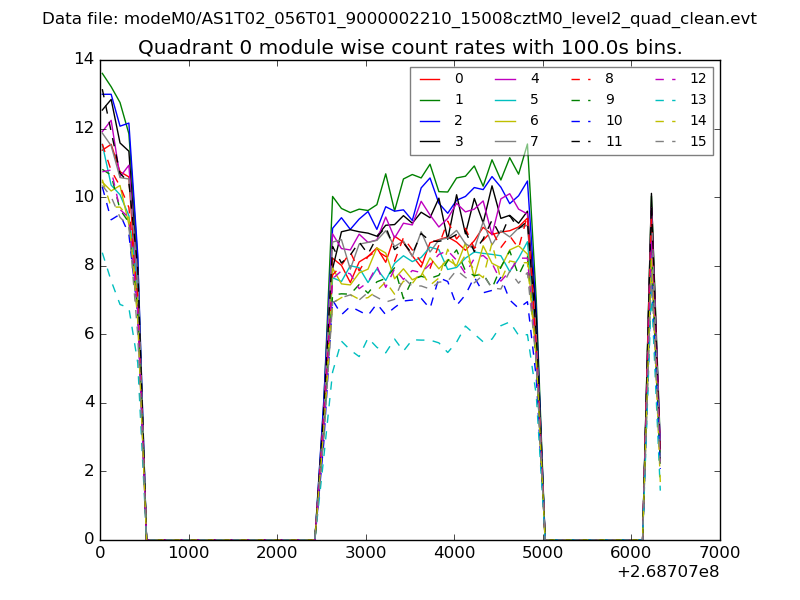 |
 |
| Module-wise count rates for Quadrant B Data is divided into 100 sec bins |
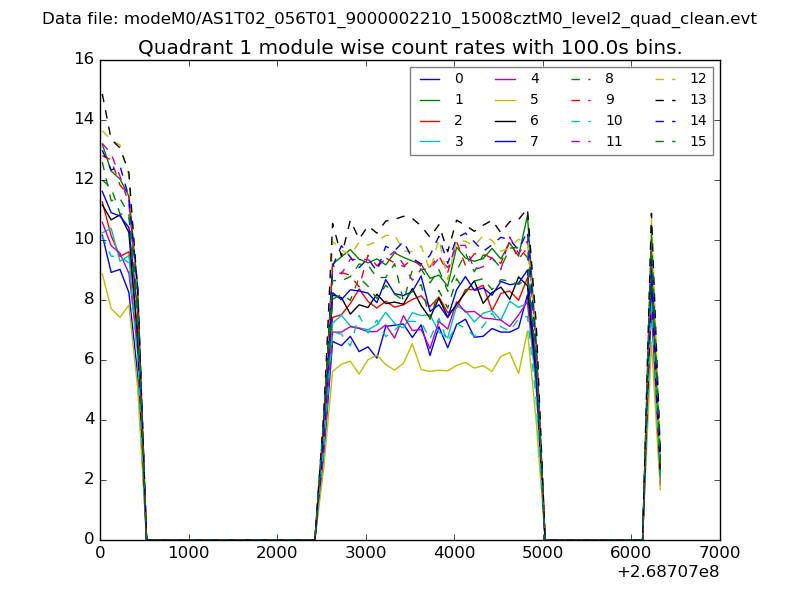 |
 |
| Module-wise count rates for Quadrant C Data is divided into 100 sec bins |
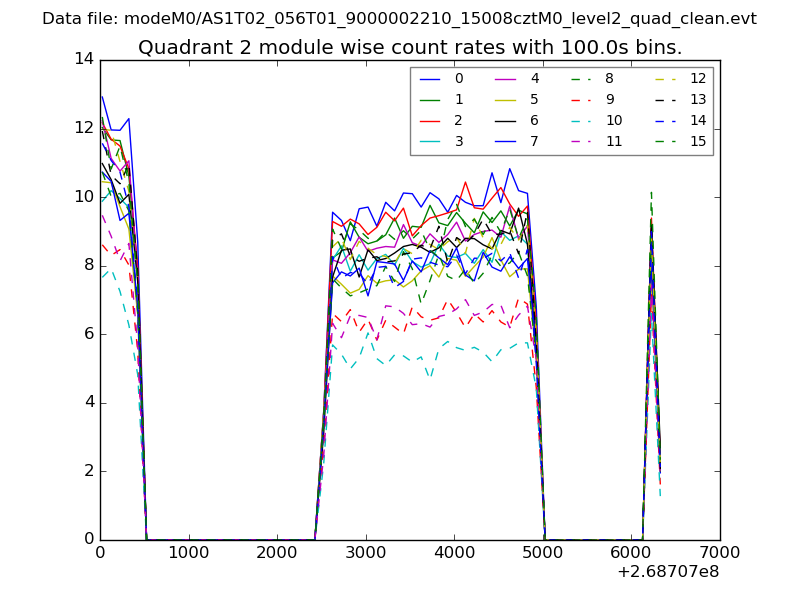 |
 |
| Module-wise count rates for Quadrant D Data is divided into 100 sec bins |
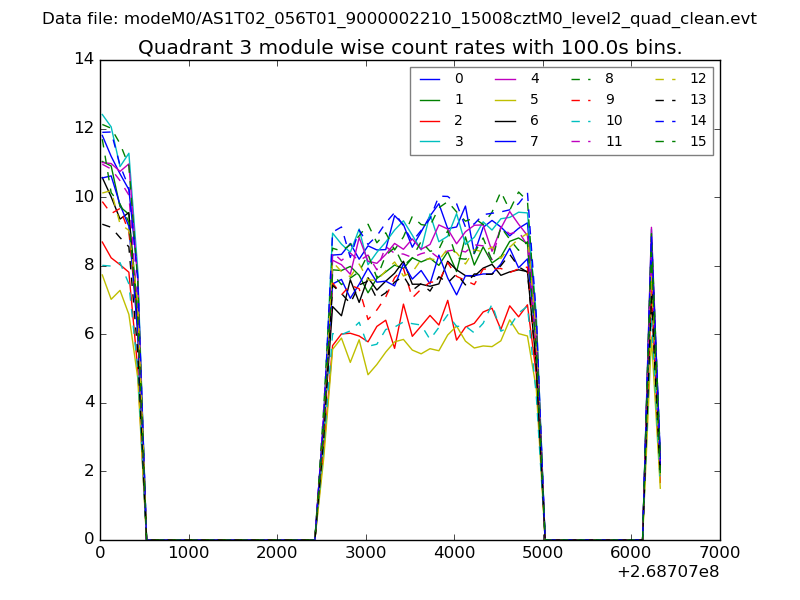 |
 |
| Parameter | Plot |
|---|---|
| CZT HV Monitor | 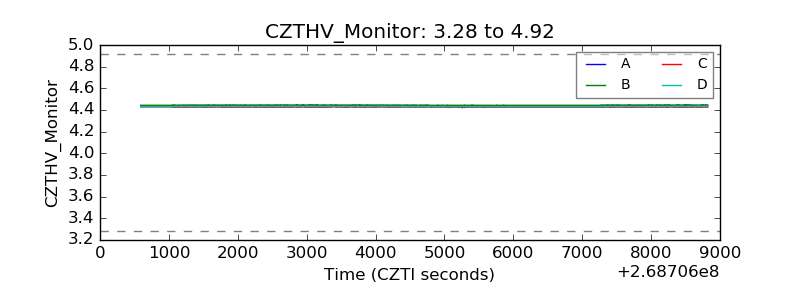 |
| D_VDD | 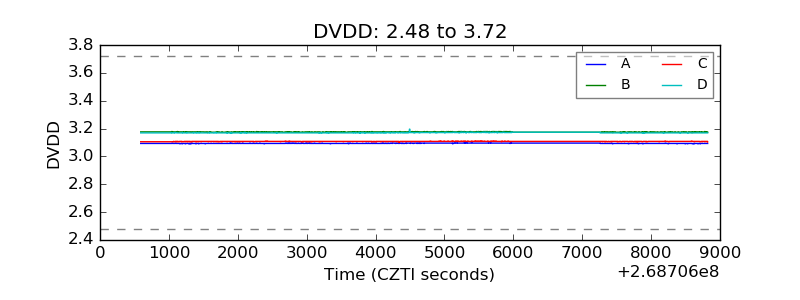 |
| Temperature 1 | 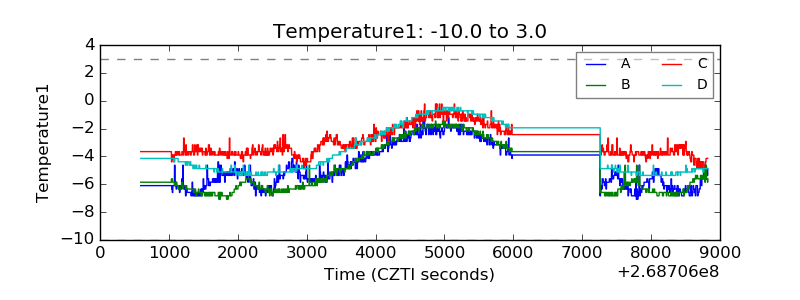 |
| Veto HV Monitor | 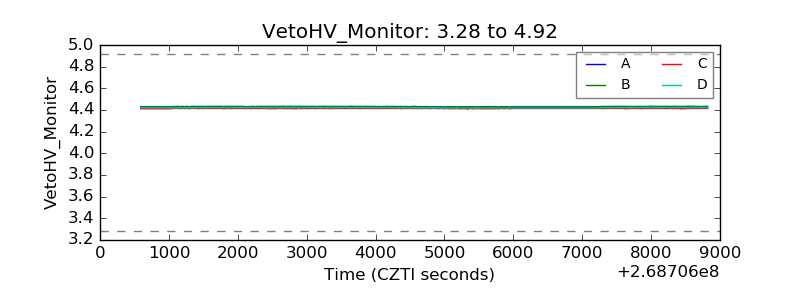 |
| Veto LLD | 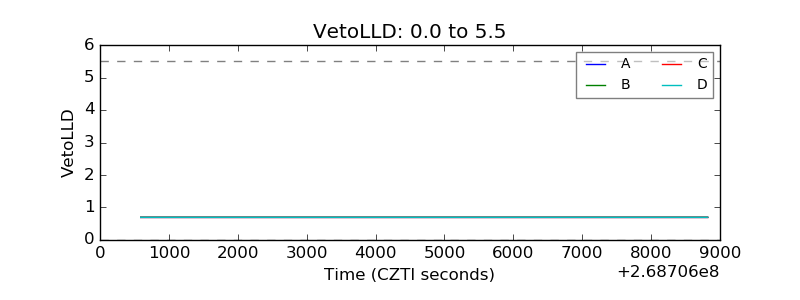 |
| Alpha Counter | 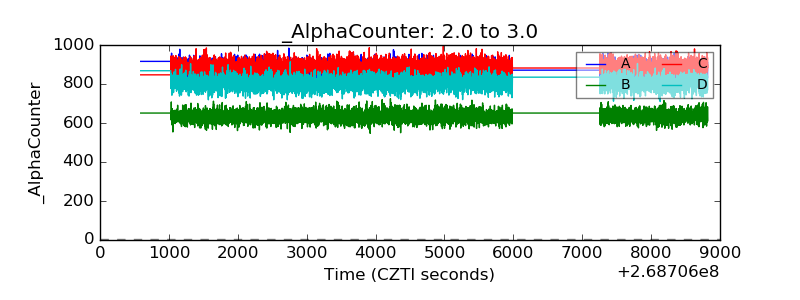 |
| _CPM_Rate | 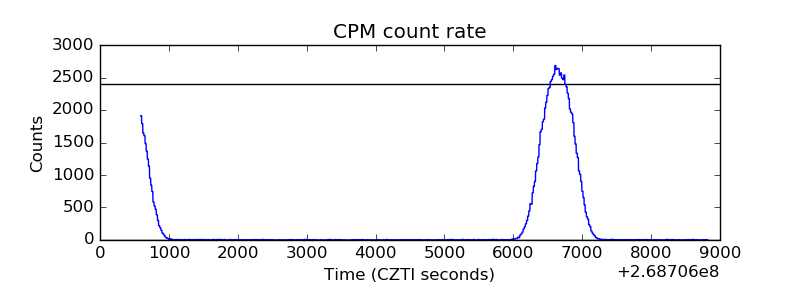 |
| CZT Counter |  |
| +2.5 Volts monitor |  |
| +5 Volts monitor |  |
| _ROLL_ROT | 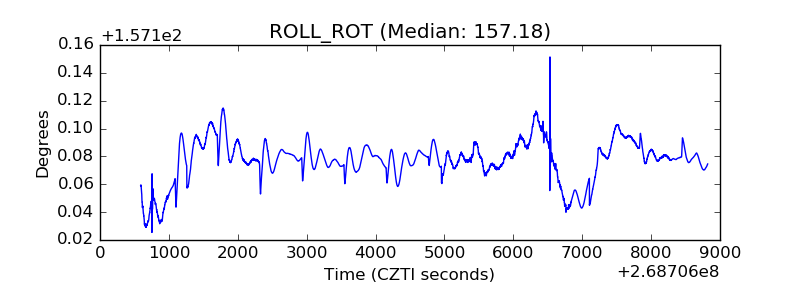 |
| _Roll_DEC | 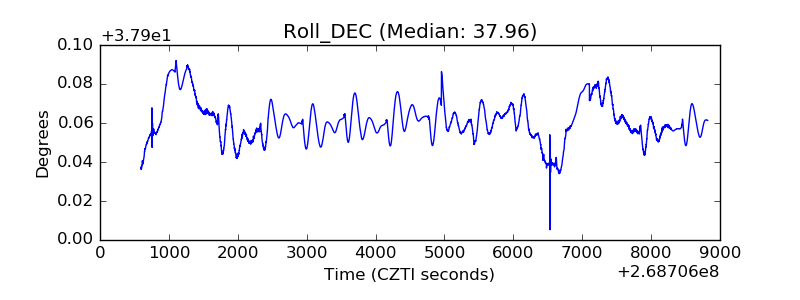 |
| _Roll_RA |  |
| Veto Counter | 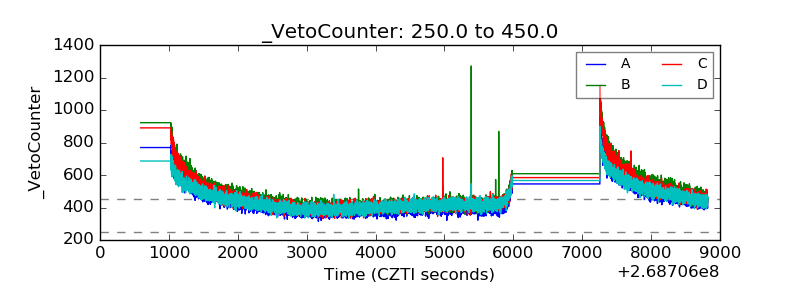 |