| Param | Original file | Final file |
|---|---|---|
| Filename | modeM0/AS1T02_057T01_9000002212cztM0_level2.fits | modeM0/AS1T02_057T01_9000002212cztM0_level2_quad_clean.evt |
| Size (bytes) | 852,353,280 | 933,528,960 |
| Size | 812.9 MB | 890.3 MB |
| Events in quadrant A | 5,165,662 | 5,773,261 |
| Events in quadrant B | 4,933,728 | 5,684,899 |
| Events in quadrant C | 5,052,582 | 5,473,256 |
| Events in quadrant D | 4,413,342 | 5,095,928 |
| Mode M0 | |||
|---|---|---|---|
| Quadrant | BADHDUFLAG | Total packets | Discarded packets |
| A | 0 | 210414 | 0 |
| B | 0 | 213062 | 0 |
| C | 0 | 192486 | 0 |
| D | 0 | 198691 | 0 |
| Mode SS | |||
|---|---|---|---|
| Quadrant | BADHDUFLAG | Total packets | Discarded packets |
| A | 0 | 1852 | 0 |
| B | 0 | 1852 | 0 |
| C | 0 | 1852 | 0 |
| D | 0 | 1852 | 0 |
| Mode M9 | |||
|---|---|---|---|
| Quadrant | BADHDUFLAG | Total packets | Discarded packets |
| A | 0 | 128 | 0 |
| B | 0 | 128 | 0 |
| C | 0 | 128 | 0 |
| D | 0 | 128 | 0 |
| Quadrant | Total seconds | Saturated seconds | Saturation percentage |
|---|---|---|---|
| A | 91143 | 1687 | 1.850938% |
| B | 91142 | 3391 | 3.720568% |
| C | 91143 | 1175 | 1.289183% |
| D | 91143 | 1589 | 1.743414% |
Noise dominated data is calculated using 1-second bins in cleaned event files. If a bin has >2000 counts, and if more than 50% of those come from <1% of pixels, then it is considered to be noise-dominated and hence unusable.
| Quadrant | # 1 sec bins | Bins with >0 counts | Bins with >2000 counts | High rate bins dominated by noise | Noise dominated (total time) | Noise dominated (detector-on time) | Marked lightcurve |
|---|---|---|---|---|---|---|---|
| A | 103698 | 91134 | 0 | 0 | 0.00% | 0.00% |  |
| B | 103698 | 91065 | 0 | 0 | 0.00% | 0.00% |  |
| C | 103698 | 91139 | 0 | 0 | 0.00% | 0.00% |  |
| D | 103698 | 91137 | 0 | 0 | 0.00% | 0.00% |  |
Top three noisy pixels from each quadrant. If the there are fewer than three noisy pixels in the level2.evt file, extra rows are filled as -1
| Pixel properties | Quadrant properties | ||||||
|---|---|---|---|---|---|---|---|
| Quadrant | DetID | PixID | Counts | Sigma | Mean | Median | Sigma |
| A | 0 | 29 | 5035 | 11.29 | 1346 | 1263 | 334.1 |
| A | 7 | 110 | 4165 | 8.69 | 1346 | 1263 | 334.1 |
| A | 0 | 30 | 3937 | 8.0 | 1346 | 1263 | 334.1 |
| B | 2 | 9 | 4281 | 12.21 | 1303 | 1247 | 248.5 |
| B | 14 | 254 | 3308 | 8.29 | 1303 | 1247 | 248.5 |
| B | 3 | 17 | 3192 | 7.82 | 1303 | 1247 | 248.5 |
| C | 12 | 241 | 3697 | 7.18 | 1335 | 1245 | 341.7 |
| C | 3 | 126 | 3408 | 6.33 | 1335 | 1245 | 341.7 |
| C | 2 | 191 | 3315 | 6.06 | 1335 | 1245 | 341.7 |
| D | 3 | 14 | 3321 | 6.42 | 1259 | 1142 | 339.2 |
| D | 6 | 231 | 3222 | 6.13 | 1259 | 1142 | 339.2 |
| D | 3 | 159 | 3130 | 5.86 | 1259 | 1142 | 339.2 |
Histogram calculated using DETX and DETY for each event in the final _common_clean file
| Quadrant A |  |
 |
Quadrant B |
|---|---|---|---|
| Quadrant D | 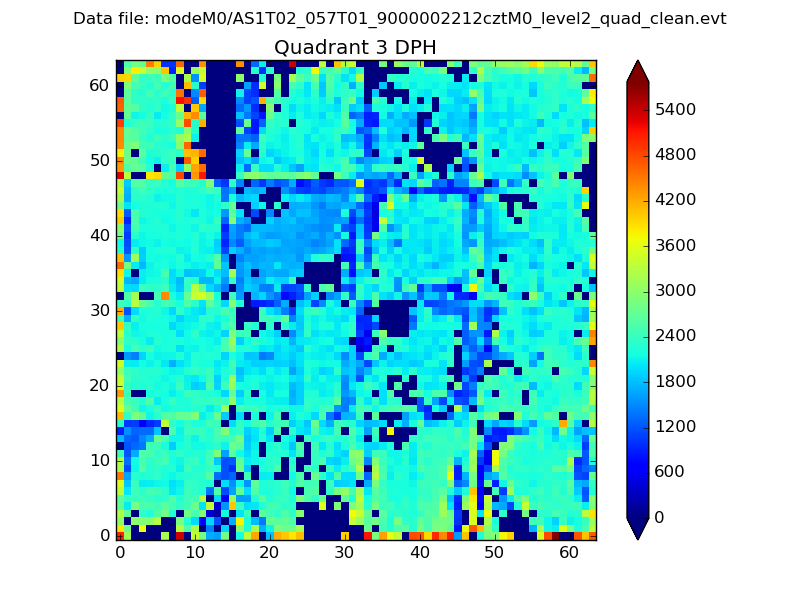 |
 |
Quadrant C |
| Plot type | Count rate plots | Images |
|---|---|---|
| Comparison with Poisson distribution Blue bars denote a histogram of data divided into 1 sec bins. Red curve is a Poisson curve with rate = median count rate of data. |
 |
 |
| Quadrant-wise count rates Data is divided into 100 sec bins |
 |
|
| Module-wise count rates for Quadrant A Data is divided into 100 sec bins |
 |
 |
| Module-wise count rates for Quadrant B Data is divided into 100 sec bins |
 |
 |
| Module-wise count rates for Quadrant C Data is divided into 100 sec bins |
 |
 |
| Module-wise count rates for Quadrant D Data is divided into 100 sec bins |
 |
 |
| Parameter | Plot |
|---|---|
| CZT HV Monitor |  |
| D_VDD |  |
| Temperature 1 |  |
| Veto HV Monitor |  |
| Veto LLD |  |
| Alpha Counter |  |
| _CPM_Rate |  |
| CZT Counter |  |
| +2.5 Volts monitor |  |
| +5 Volts monitor |  |
| _ROLL_ROT |  |
| _Roll_DEC |  |
| _Roll_RA |  |
| Veto Counter |  |