| Param | Original file | Final file |
|---|---|---|
| Filename | modeM0/AS1T02_057T01_9000002212_15013cztM0_level2.evt | modeM0/AS1T02_057T01_9000002212_15013cztM0_level2_quad_clean.evt |
| Size (bytes) | 501,649,920 | 91,670,400 |
| Size | 478.4 MB | 87.4 MB |
| Events in quadrant A | 3,912,002 | 575,445 |
| Events in quadrant B | 4,119,031 | 578,692 |
| Events in quadrant C | 3,420,285 | 568,043 |
| Events in quadrant D | 3,253,335 | 553,848 |
| Mode M0 | |||
|---|---|---|---|
| Quadrant | BADHDUFLAG | Total packets | Discarded packets |
| A | 0 | 16295 | 2 |
| B | 0 | 16794 | 1 |
| C | 0 | 14706 | 1 |
| D | 0 | 14874 | 1 |
| Mode SS | |||
|---|---|---|---|
| Quadrant | BADHDUFLAG | Total packets | Discarded packets |
| A | 0 | 146 | 0 |
| B | 0 | 146 | 0 |
| C | 0 | 146 | 0 |
| D | 0 | 146 | 0 |
| Mode M9 | |||
|---|---|---|---|
| Quadrant | BADHDUFLAG | Total packets | Discarded packets |
| A | 0 | 5 | 0 |
| B | 0 | 5 | 0 |
| C | 0 | 5 | 0 |
| D | 0 | 5 | 0 |
| Quadrant | Total seconds | Saturated seconds | Saturation percentage |
|---|---|---|---|
| A | 7178 | 149 | 2.075787% |
| B | 7178 | 321 | 4.471998% |
| C | 7178 | 106 | 1.476734% |
| D | 7178 | 124 | 1.727501% |
Noise dominated data is calculated using 1-second bins in cleaned event files. If a bin has >2000 counts, and if more than 50% of those come from <1% of pixels, then it is considered to be noise-dominated and hence unusable.
| Quadrant | # 1 sec bins | Bins with >0 counts | Bins with >2000 counts | High rate bins dominated by noise | Noise dominated (total time) | Noise dominated (detector-on time) | Marked lightcurve |
|---|---|---|---|---|---|---|---|
| A | 7679 | 7179 | 1 | 1 | 0.01% | 0.01% | 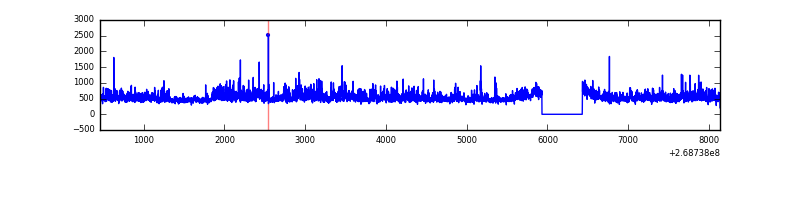 |
| B | 7679 | 7179 | 120 | 120 | 1.56% | 1.67% | 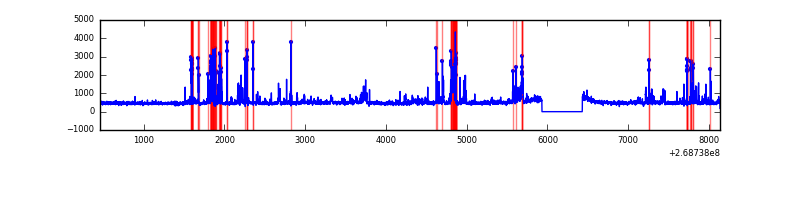 |
| C | 7679 | 7180 | 0 | 0 | 0.00% | 0.00% | 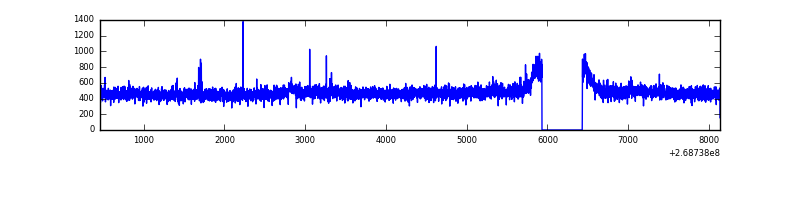 |
| D | 7679 | 7179 | 9 | 9 | 0.12% | 0.13% | 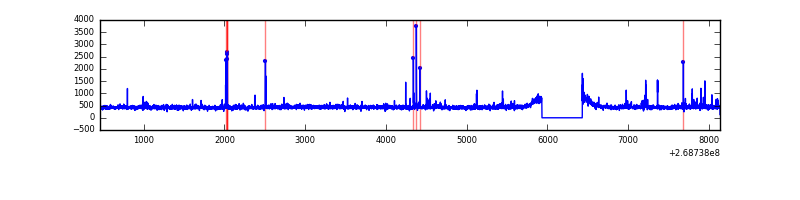 |
Top three noisy pixels from each quadrant. If the there are fewer than three noisy pixels in the level2.evt file, extra rows are filled as -1
| Pixel properties | Quadrant properties | ||||||
|---|---|---|---|---|---|---|---|
| Quadrant | DetID | PixID | Counts | Sigma | Mean | Median | Sigma |
| A | 1 | 162 | 200093 | 1161.48 | 853 | 835 | 171.6 |
| A | 12 | 189 | 136747 | 792.23 | 853 | 835 | 171.6 |
| A | 1 | 178 | 108907 | 629.95 | 853 | 835 | 171.6 |
| B | 3 | 64 | 547958 | 3415.5 | 841 | 820 | 160.2 |
| B | 0 | 229 | 188123 | 1169.24 | 841 | 820 | 160.2 |
| B | 10 | 16 | 35983 | 219.5 | 841 | 820 | 160.2 |
| C | 3 | 233 | 220537 | 1166.73 | 818 | 821 | 188.3 |
| C | 10 | 22 | 6601 | 30.69 | 818 | 821 | 188.3 |
| C | 13 | 61 | 5930 | 27.13 | 818 | 821 | 188.3 |
| D | 12 | 222 | 34687 | 170.81 | 822 | 797 | 198.4 |
| D | 10 | 70 | 27263 | 133.39 | 822 | 797 | 198.4 |
| D | 2 | 234 | 26621 | 130.15 | 822 | 797 | 198.4 |
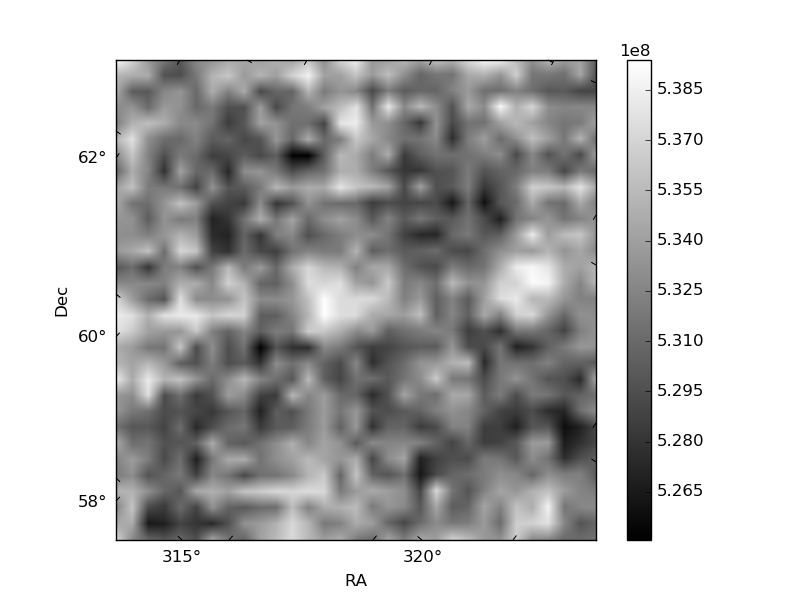
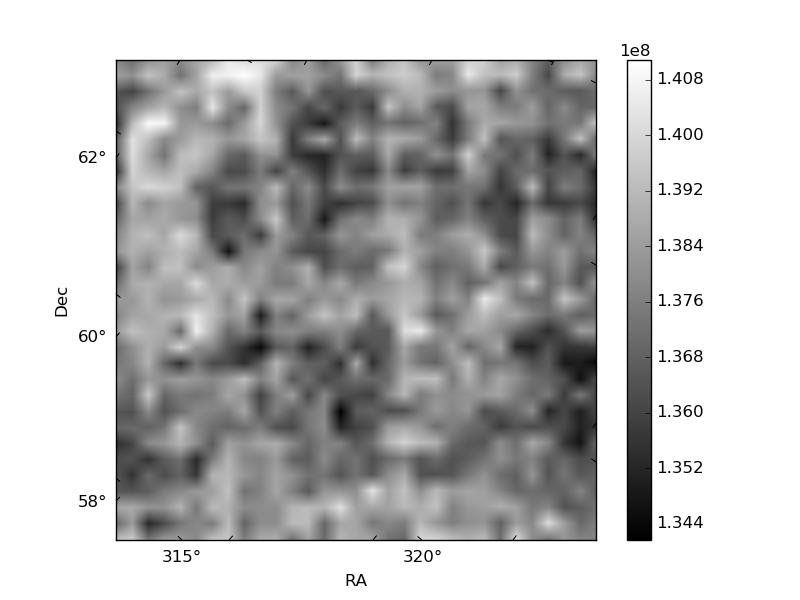
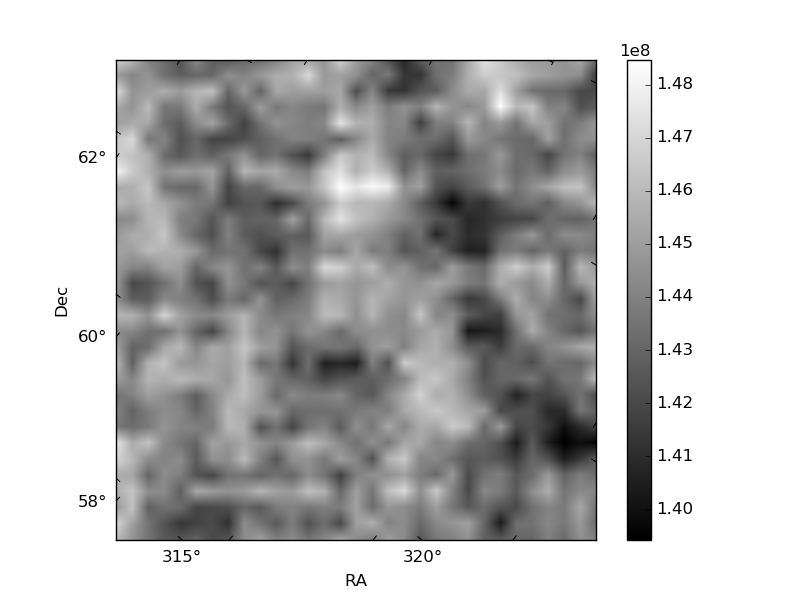
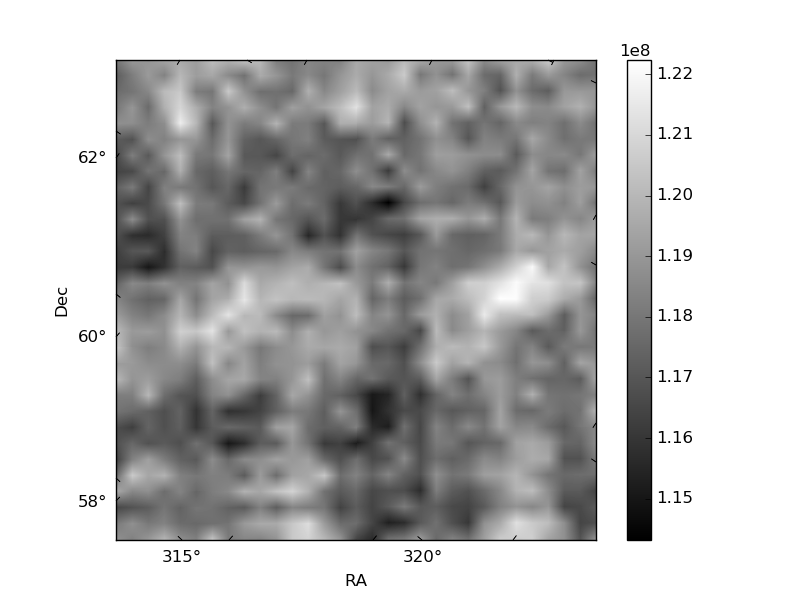
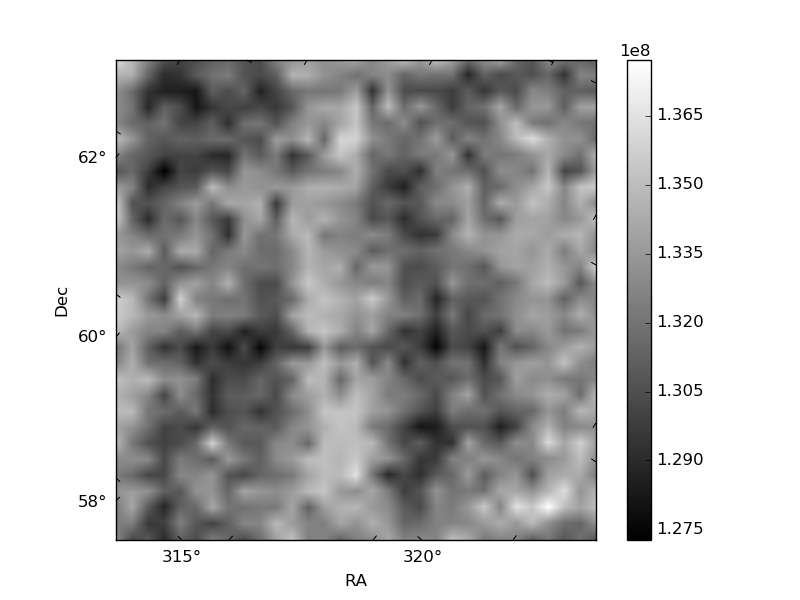
Histogram calculated using DETX and DETY for each event in the final _common_clean file
| Quadrant A | 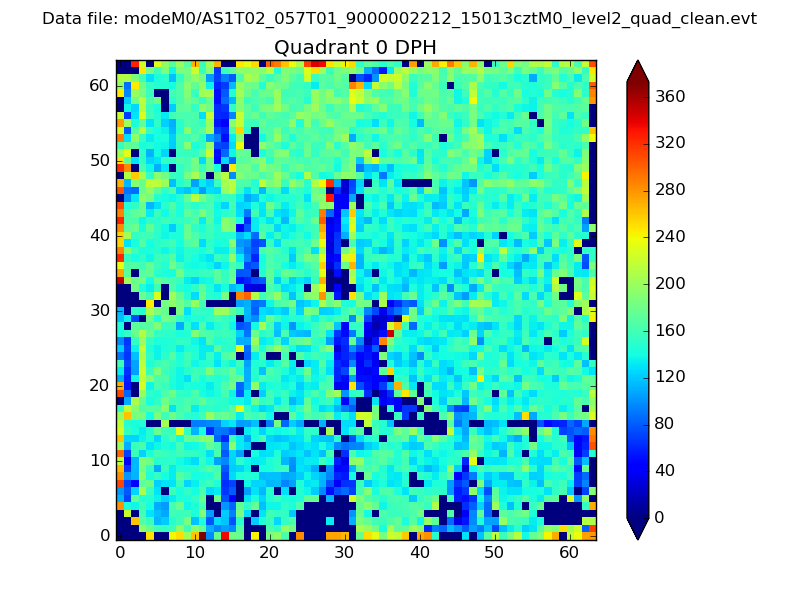 |
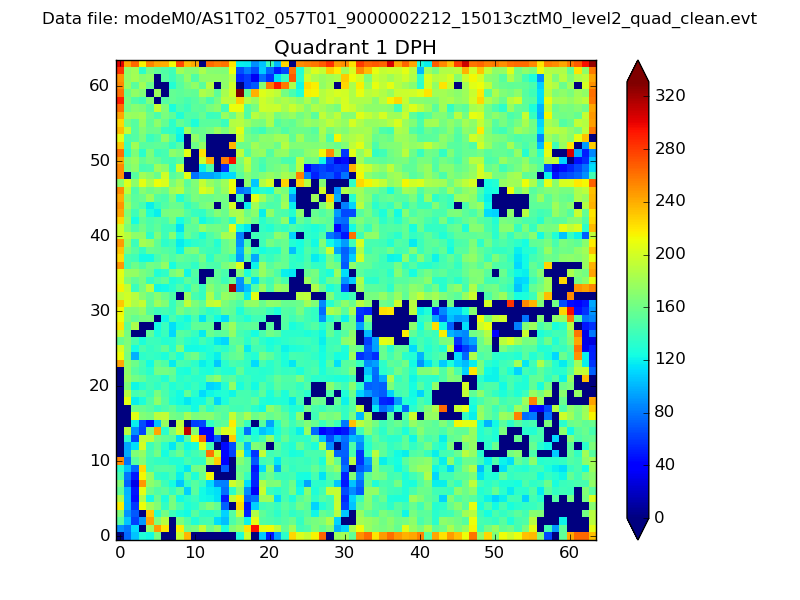 |
Quadrant B |
|---|---|---|---|
| Quadrant D | 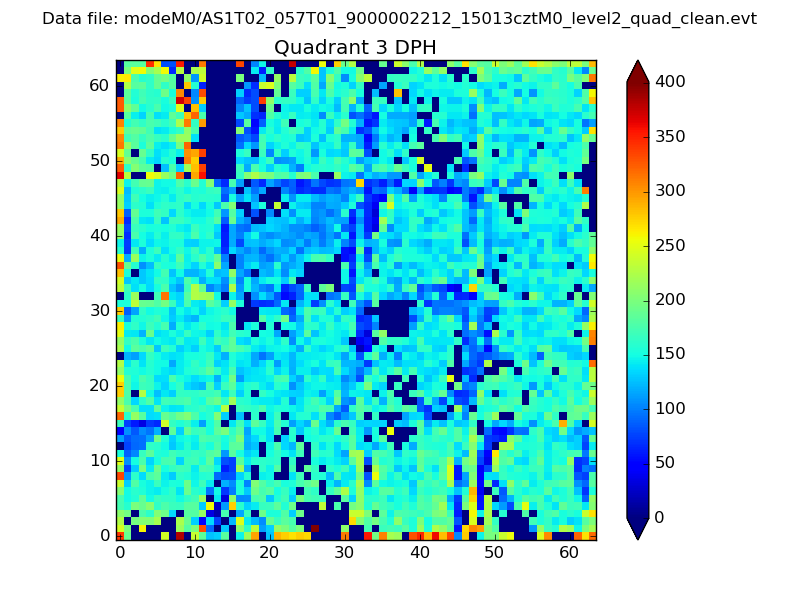 |
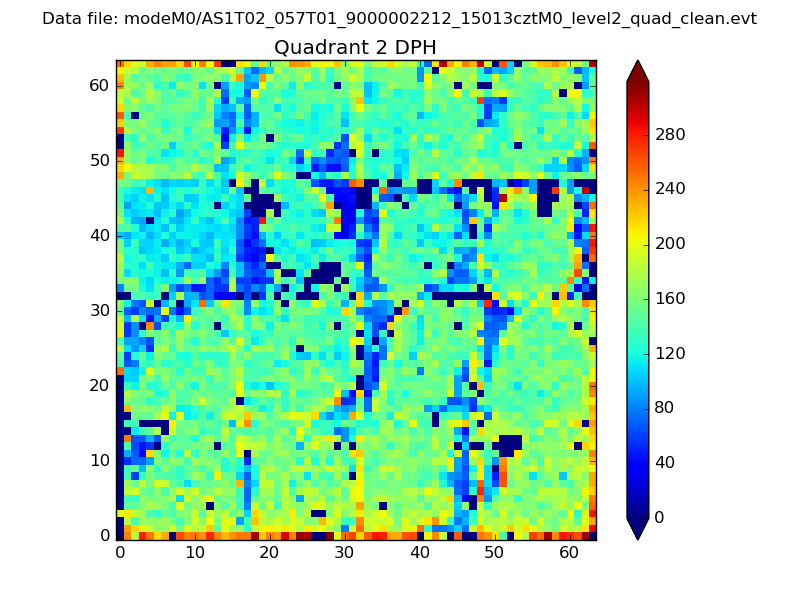 |
Quadrant C |
| Plot type | Count rate plots | Images |
|---|---|---|
| Comparison with Poisson distribution Blue bars denote a histogram of data divided into 1 sec bins. Red curve is a Poisson curve with rate = median count rate of data. |
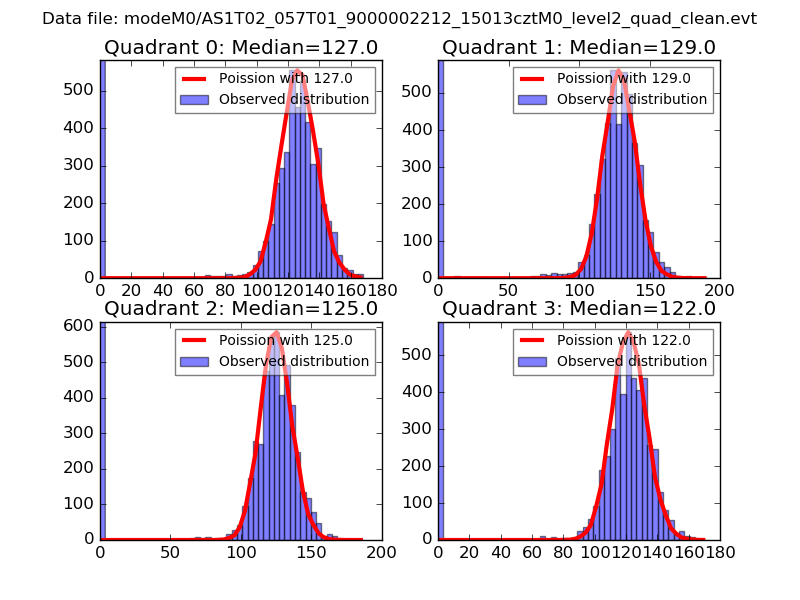 |
 |
| Quadrant-wise count rates Data is divided into 100 sec bins |
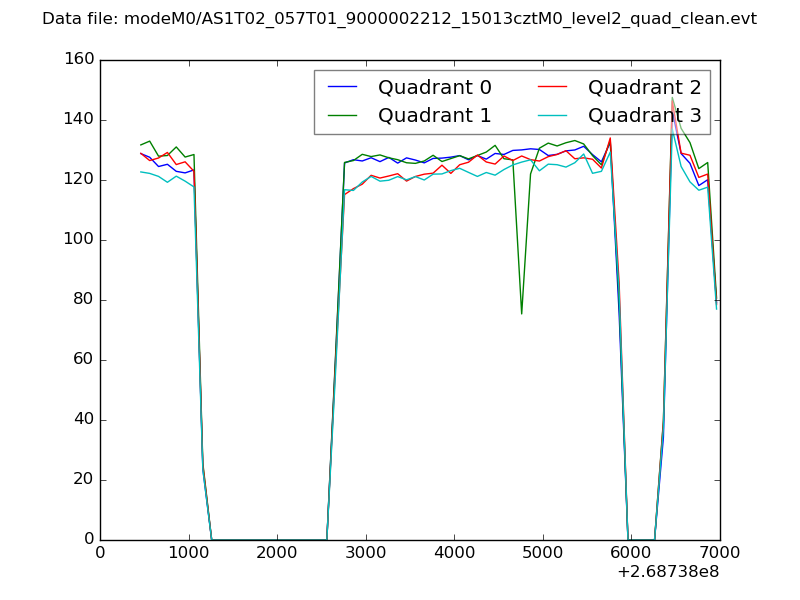 |
|
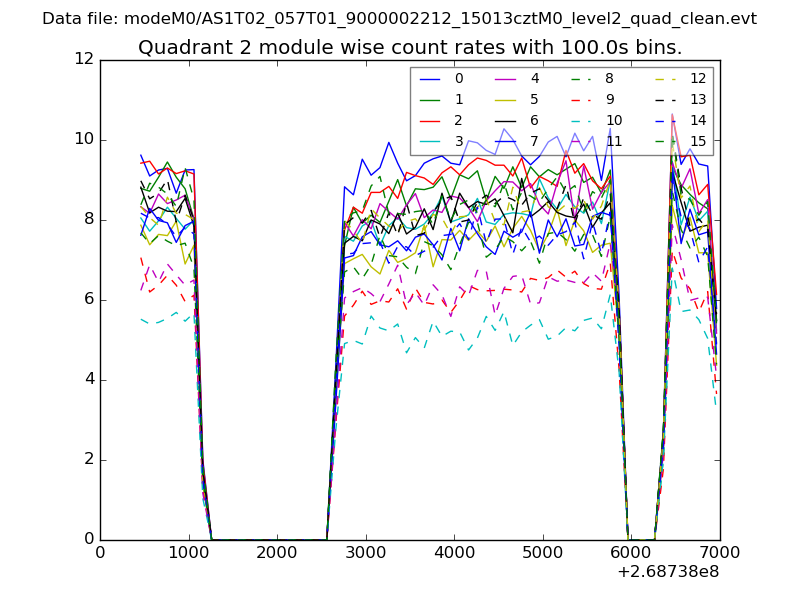
| Module-wise count rates for Quadrant A Data is divided into 100 sec bins |
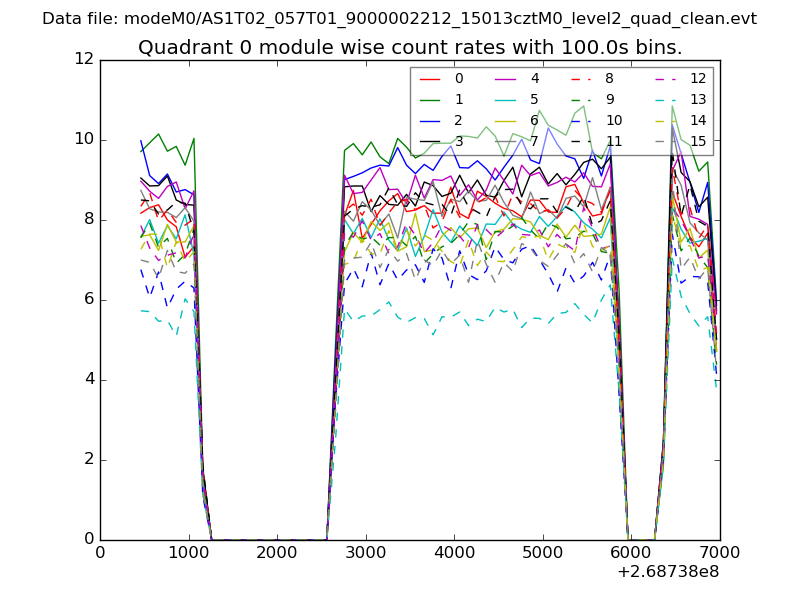 |
 |
| Module-wise count rates for Quadrant B Data is divided into 100 sec bins |
 |
 |
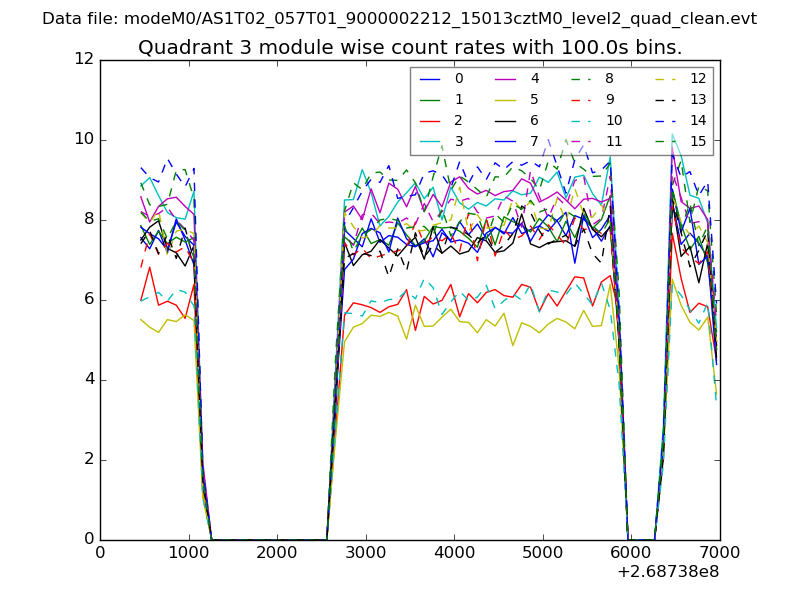
| Module-wise count rates for Quadrant C Data is divided into 100 sec bins |
 |
 |
| Module-wise count rates for Quadrant D Data is divided into 100 sec bins |
 |
 |
| Parameter | Plot |
|---|---|
| CZT HV Monitor |  |
| D_VDD | 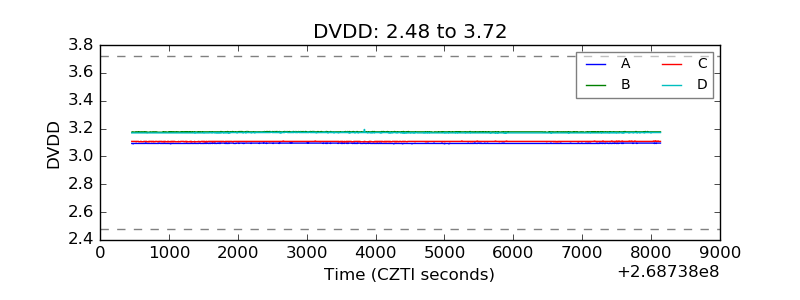 |
| Temperature 1 | 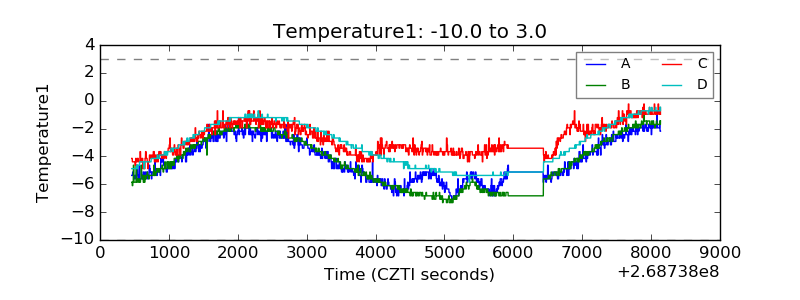 |
| Veto HV Monitor | 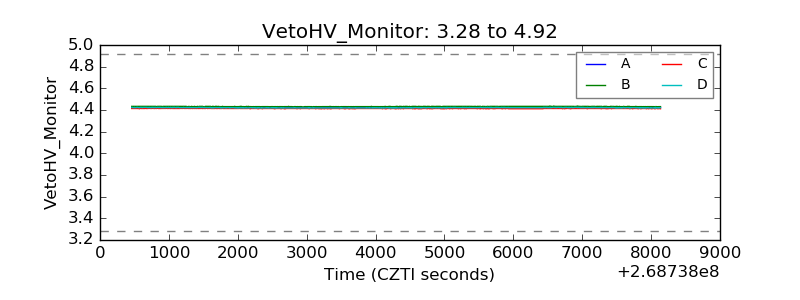 |
| Veto LLD | 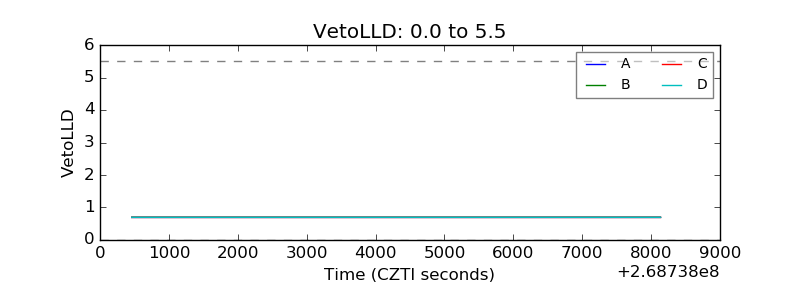 |
| Alpha Counter | 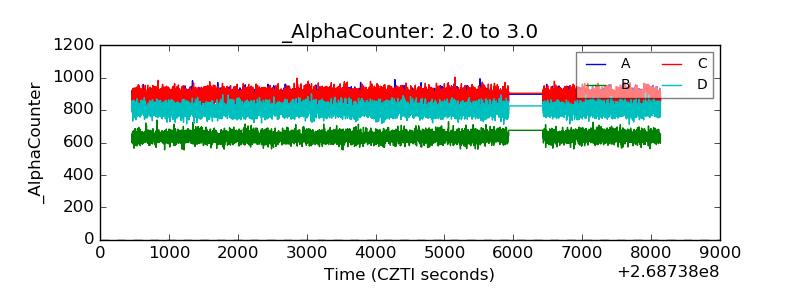 |
| _CPM_Rate | 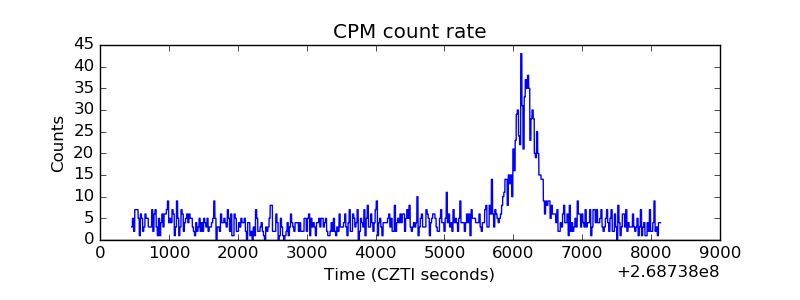 |
| CZT Counter | 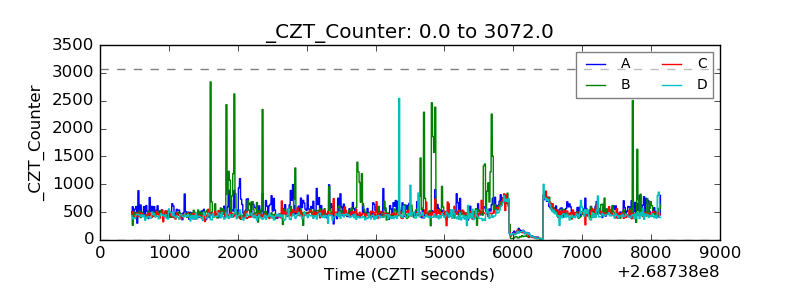 |
| +2.5 Volts monitor |  |
| +5 Volts monitor | 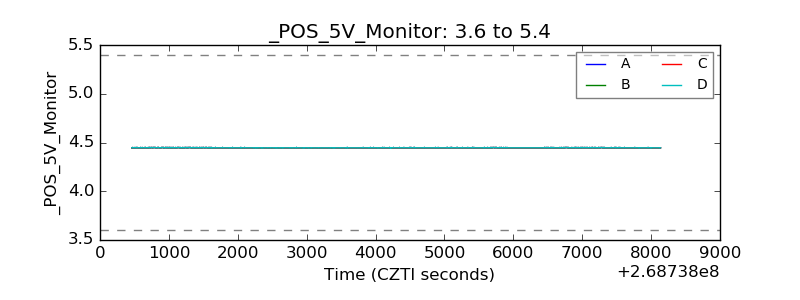 |
| _ROLL_ROT |  |
| _Roll_DEC | 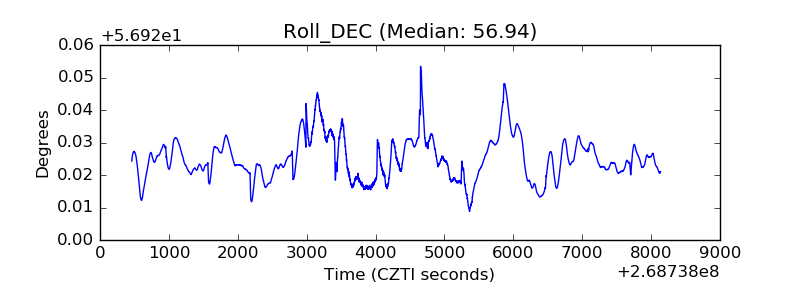 |
| _Roll_RA | 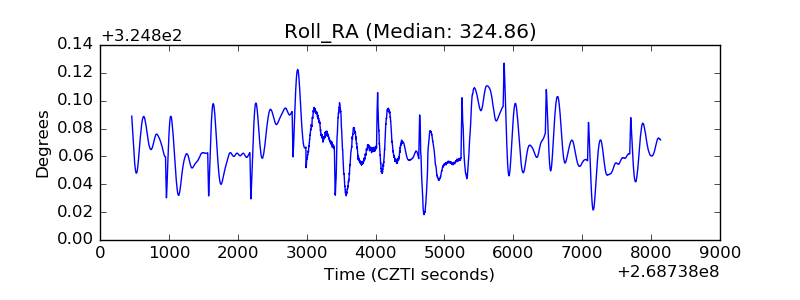 |
| Veto Counter |  |