| Param | Original file | Final file |
|---|---|---|
| Filename | modeM0/AS1T02_057T01_9000002212_15014cztM0_level2.evt | modeM0/AS1T02_057T01_9000002212_15014cztM0_level2_quad_clean.evt |
| Size (bytes) | 546,272,640 | 93,758,400 |
| Size | 521.0 MB | 89.4 MB |
| Events in quadrant A | 4,497,546 | 581,630 |
| Events in quadrant B | 4,352,461 | 584,684 |
| Events in quadrant C | 3,677,914 | 579,045 |
| Events in quadrant D | 3,496,377 | 561,207 |
| Mode M0 | |||
|---|---|---|---|
| Quadrant | BADHDUFLAG | Total packets | Discarded packets |
| A | 0 | 18392 | 3 |
| B | 0 | 17758 | 2 |
| C | 0 | 15773 | 2 |
| D | 0 | 15957 | 2 |
| Mode SS | |||
|---|---|---|---|
| Quadrant | BADHDUFLAG | Total packets | Discarded packets |
| A | 0 | 156 | 0 |
| B | 0 | 156 | 0 |
| C | 0 | 156 | 0 |
| D | 0 | 156 | 0 |
| Mode M9 | |||
|---|---|---|---|
| Quadrant | BADHDUFLAG | Total packets | Discarded packets |
| A | 0 | 2 | 0 |
| B | 0 | 2 | 0 |
| C | 0 | 2 | 0 |
| D | 0 | 3 | 0 |
| Quadrant | Total seconds | Saturated seconds | Saturation percentage |
|---|---|---|---|
| A | 7650 | 279 | 3.647059% |
| B | 7650 | 381 | 4.980392% |
| C | 7650 | 164 | 2.143791% |
| D | 7650 | 188 | 2.457516% |
Noise dominated data is calculated using 1-second bins in cleaned event files. If a bin has >2000 counts, and if more than 50% of those come from <1% of pixels, then it is considered to be noise-dominated and hence unusable.
| Quadrant | # 1 sec bins | Bins with >0 counts | Bins with >2000 counts | High rate bins dominated by noise | Noise dominated (total time) | Noise dominated (detector-on time) | Marked lightcurve |
|---|---|---|---|---|---|---|---|
| A | 7876 | 7651 | 20 | 20 | 0.25% | 0.26% | 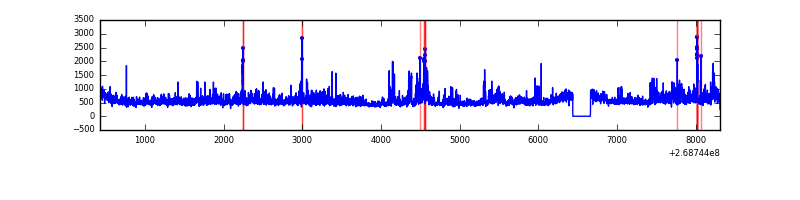 |
| B | 7876 | 7651 | 100 | 100 | 1.27% | 1.31% | 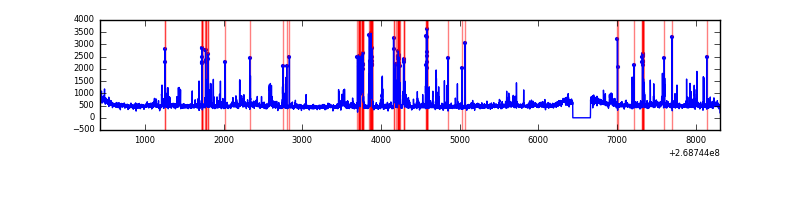 |
| C | 7876 | 7652 | 0 | 0 | 0.00% | 0.00% | 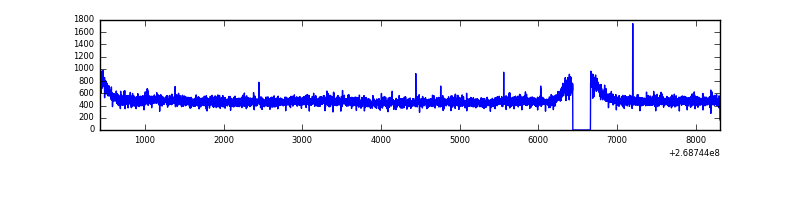 |
| D | 7876 | 7652 | 15 | 15 | 0.19% | 0.20% | 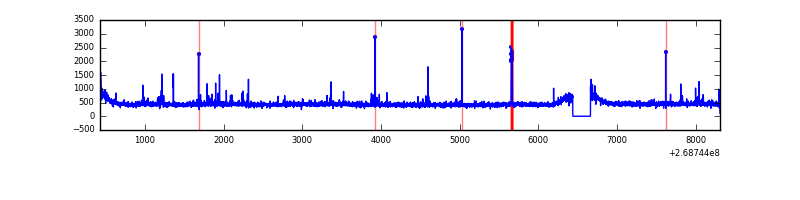 |
Top three noisy pixels from each quadrant. If the there are fewer than three noisy pixels in the level2.evt file, extra rows are filled as -1
| Pixel properties | Quadrant properties | ||||||
|---|---|---|---|---|---|---|---|
| Quadrant | DetID | PixID | Counts | Sigma | Mean | Median | Sigma |
| A | 1 | 162 | 219713 | 1183.47 | 916 | 897 | 184.9 |
| A | 15 | 239 | 190763 | 1026.89 | 916 | 897 | 184.9 |
| A | 12 | 189 | 139591 | 750.13 | 916 | 897 | 184.9 |
| B | 3 | 64 | 367909 | 2124.06 | 909 | 884 | 172.8 |
| B | 0 | 229 | 261939 | 1510.79 | 909 | 884 | 172.8 |
| B | 0 | 197 | 55266 | 314.72 | 909 | 884 | 172.8 |
| C | 3 | 233 | 230455 | 1130.74 | 881 | 882 | 203.0 |
| C | 13 | 61 | 6420 | 27.28 | 881 | 882 | 203.0 |
| C | 0 | 207 | 5793 | 24.19 | 881 | 882 | 203.0 |
| D | 2 | 120 | 30222 | 135.61 | 887 | 857 | 216.5 |
| D | 2 | 234 | 29763 | 133.49 | 887 | 857 | 216.5 |
| D | 15 | 0 | 27852 | 124.67 | 887 | 857 | 216.5 |
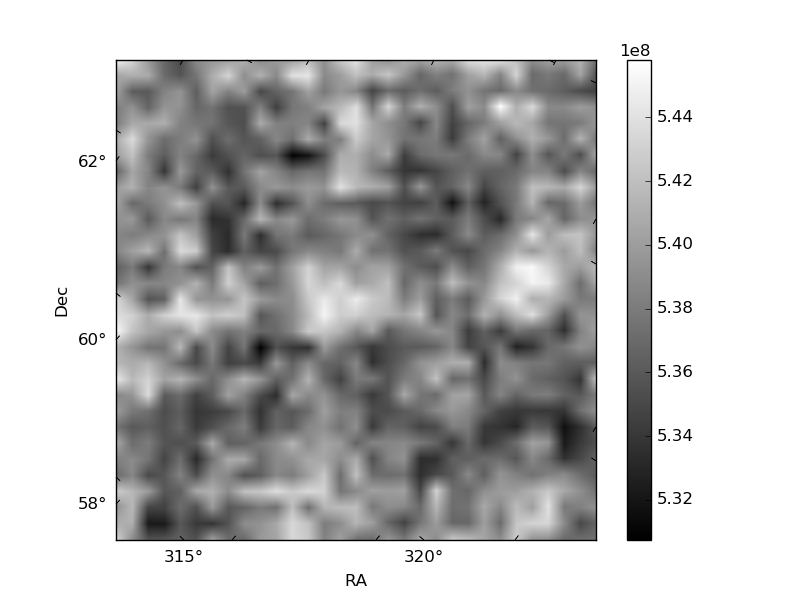
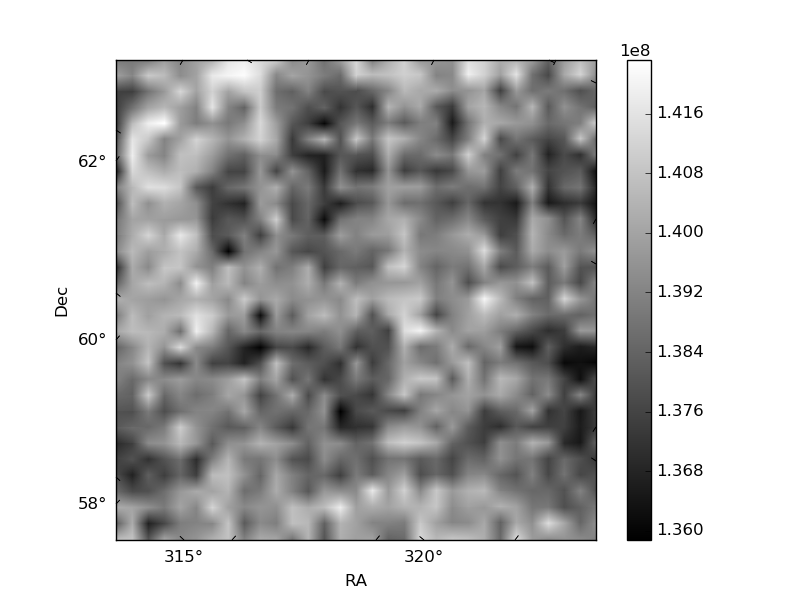
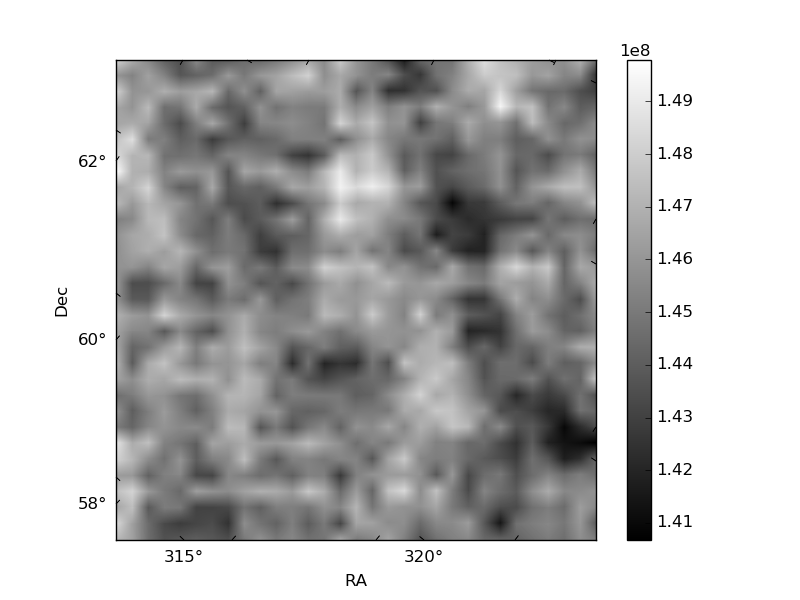
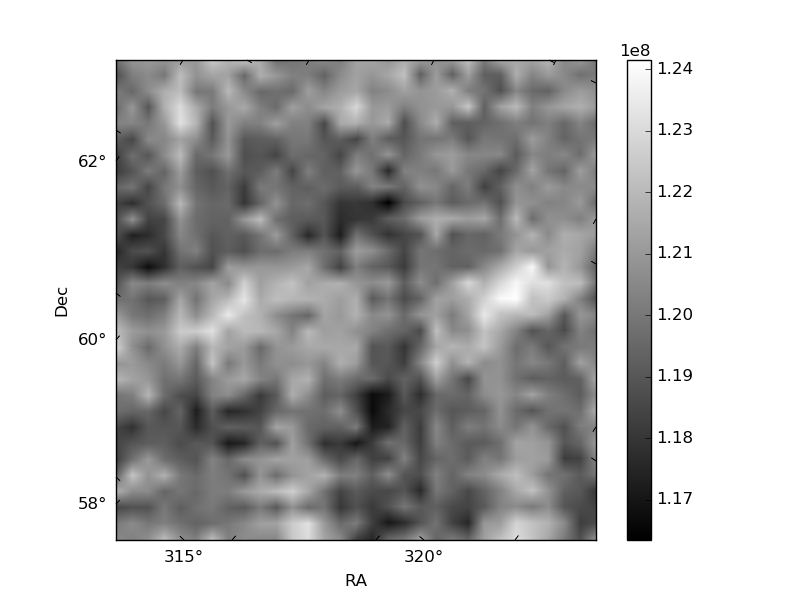
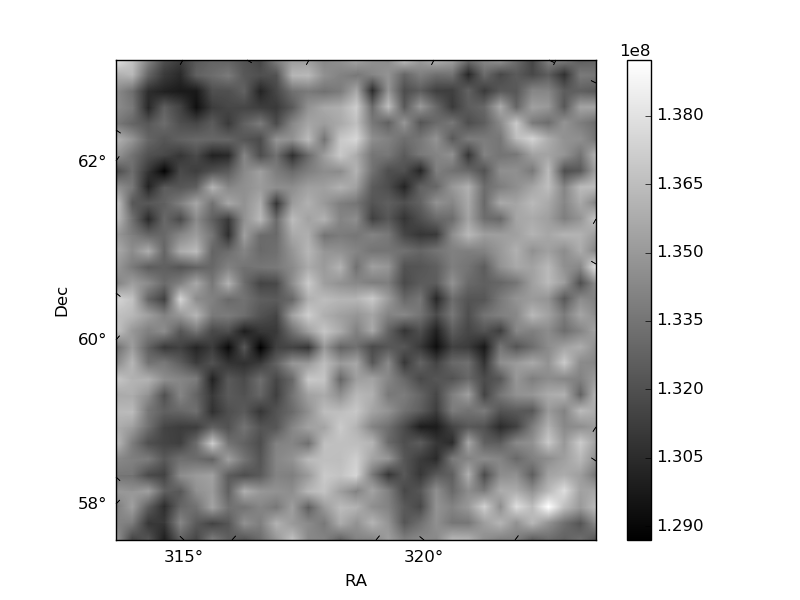
Histogram calculated using DETX and DETY for each event in the final _common_clean file
| Quadrant A | 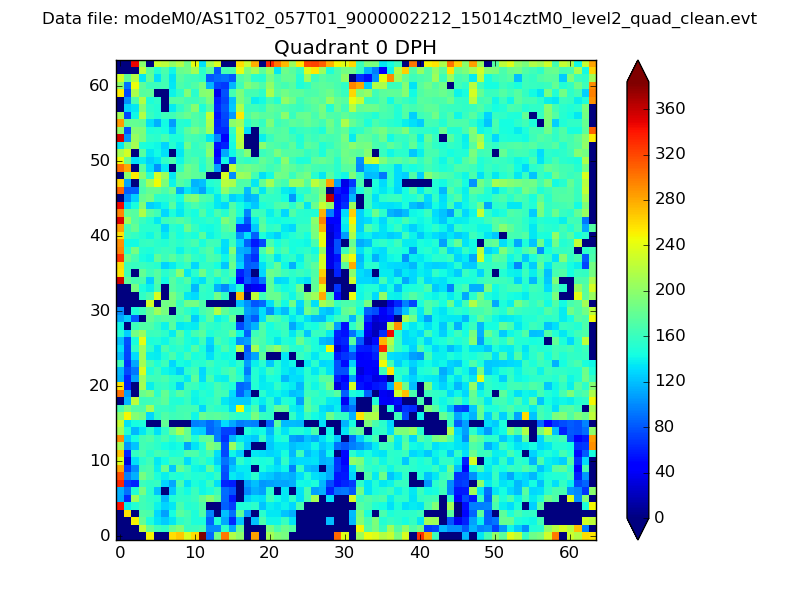 |
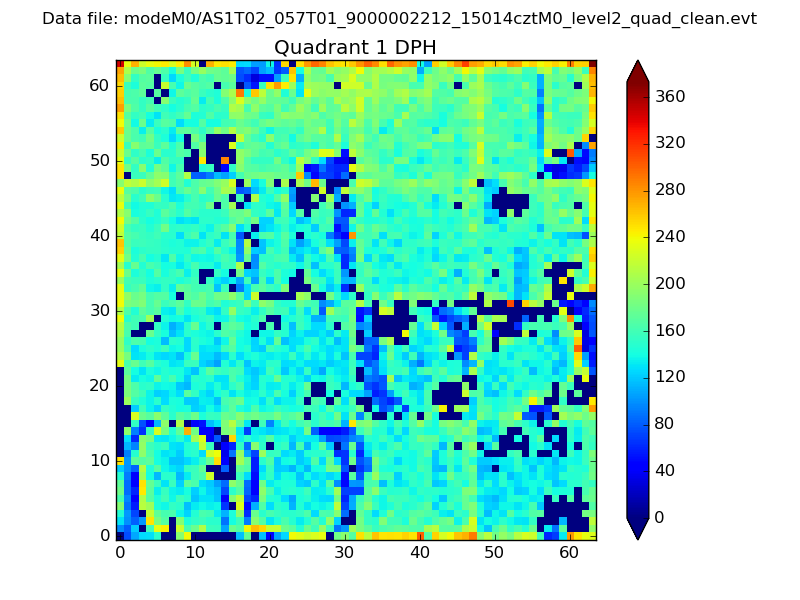 |
Quadrant B |
|---|---|---|---|
| Quadrant D | 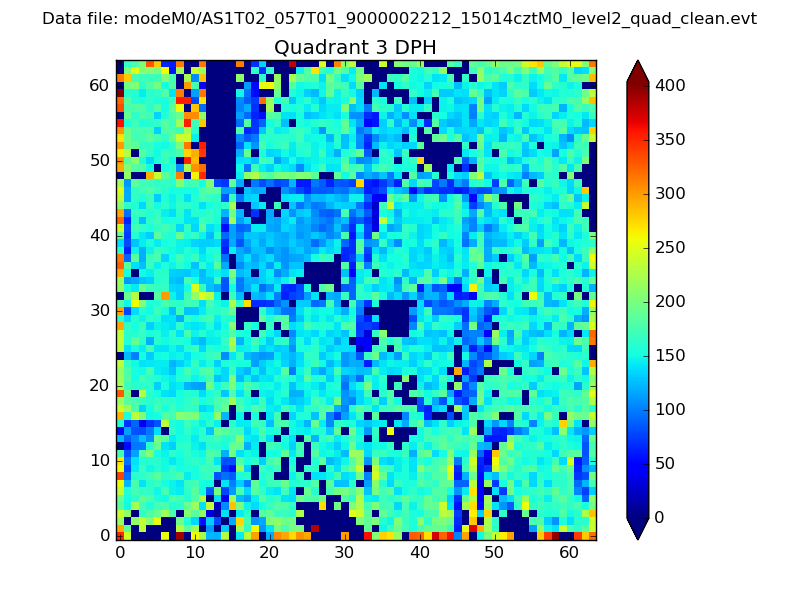 |
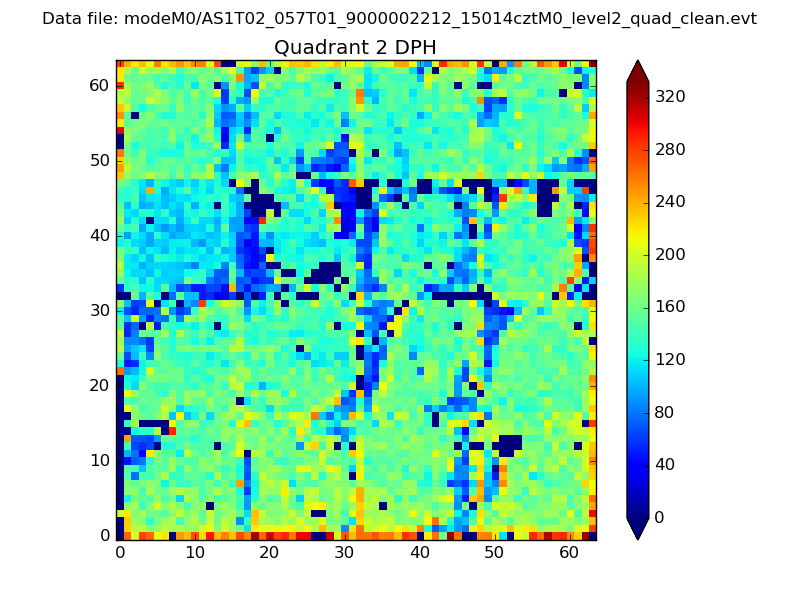 |
Quadrant C |
| Plot type | Count rate plots | Images |
|---|---|---|
| Comparison with Poisson distribution Blue bars denote a histogram of data divided into 1 sec bins. Red curve is a Poisson curve with rate = median count rate of data. |
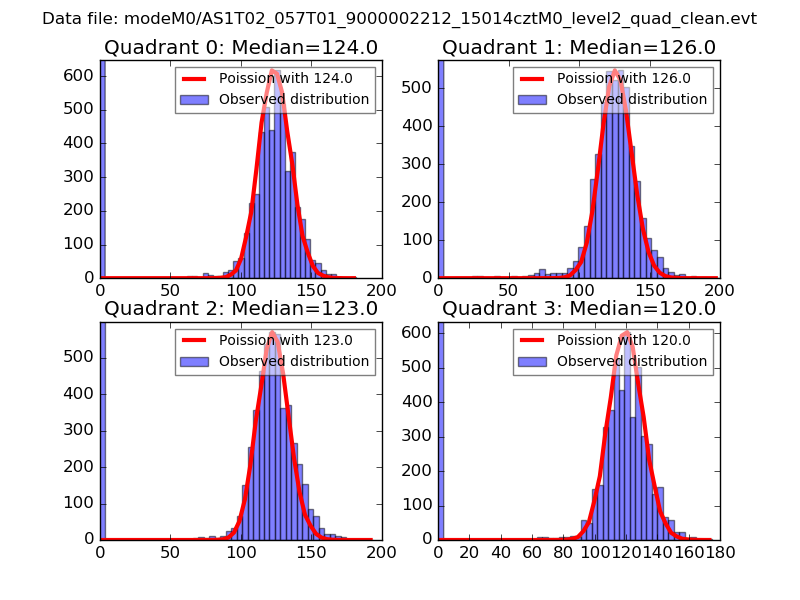 |
 |
| Quadrant-wise count rates Data is divided into 100 sec bins |
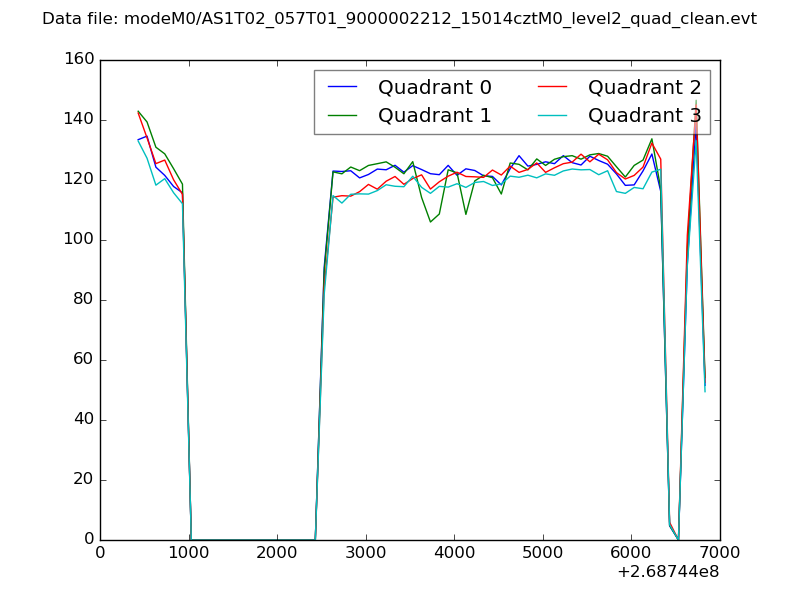 |
|
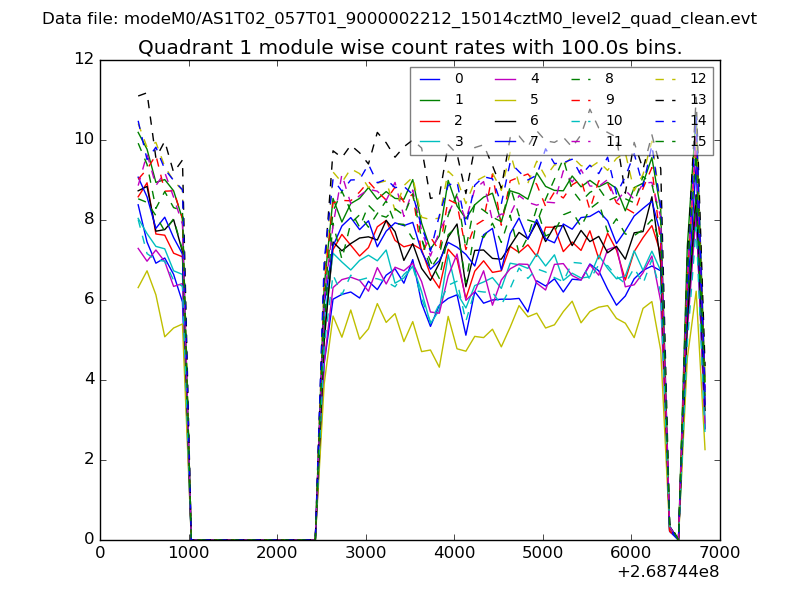
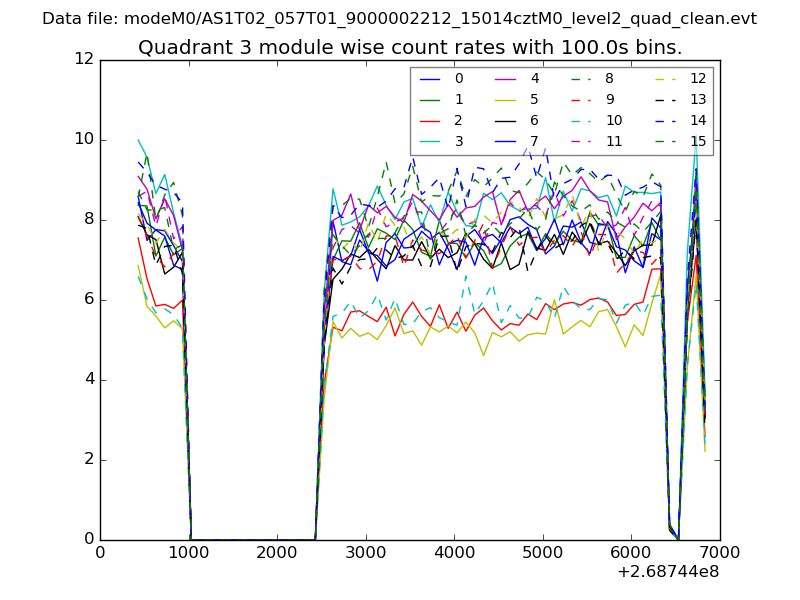
| Module-wise count rates for Quadrant A Data is divided into 100 sec bins |
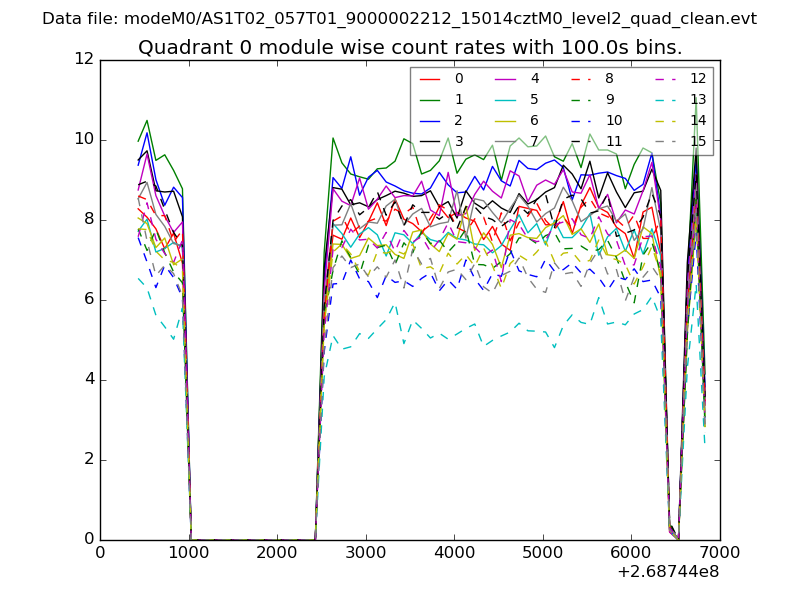 |
 |
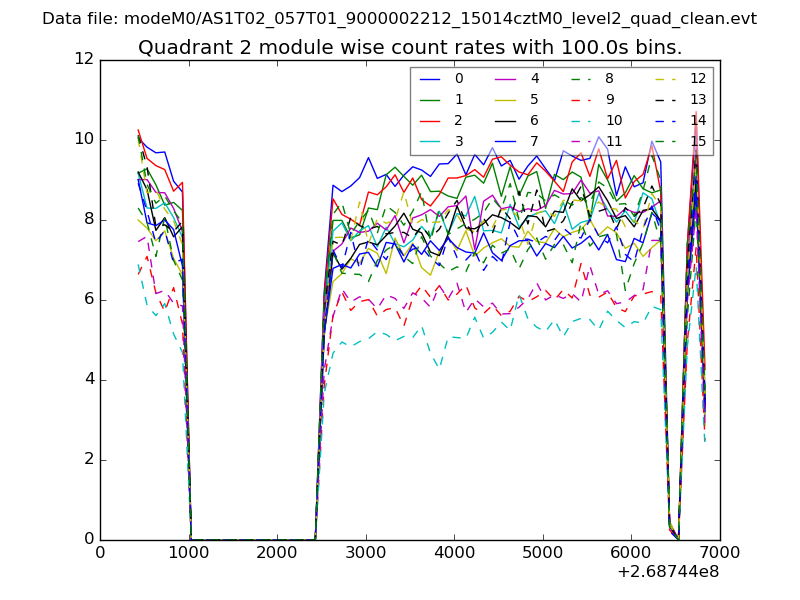
| Module-wise count rates for Quadrant B Data is divided into 100 sec bins |
 |
 |
| Module-wise count rates for Quadrant C Data is divided into 100 sec bins |
 |
 |
| Module-wise count rates for Quadrant D Data is divided into 100 sec bins |
 |
 |
| Parameter | Plot |
|---|---|
| CZT HV Monitor | 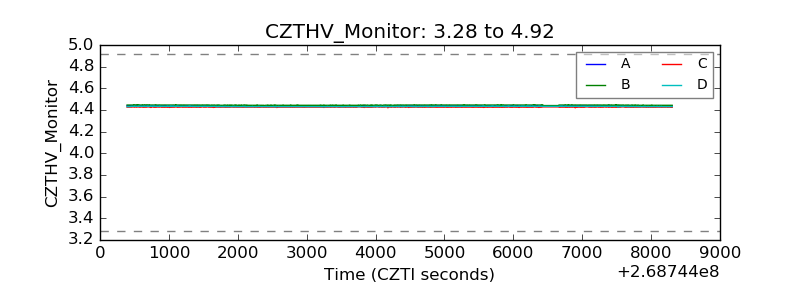 |
| D_VDD |  |
| Temperature 1 | 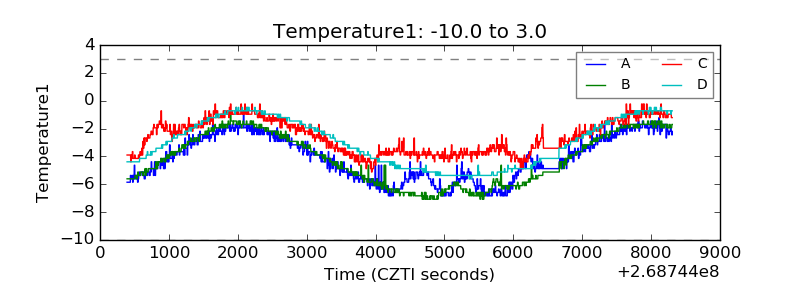 |
| Veto HV Monitor | 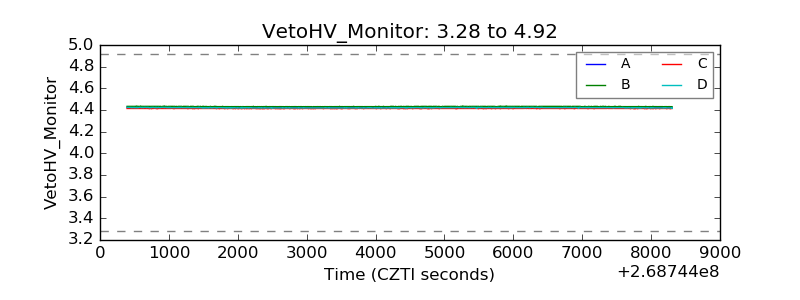 |
| Veto LLD | 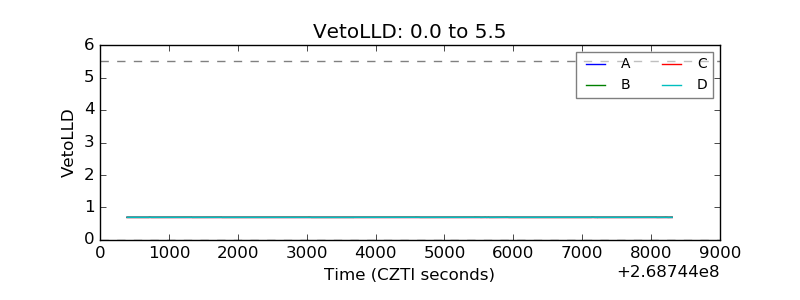 |
| Alpha Counter | 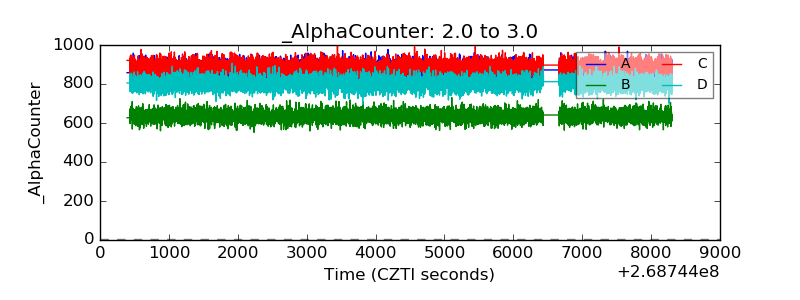 |
| _CPM_Rate | 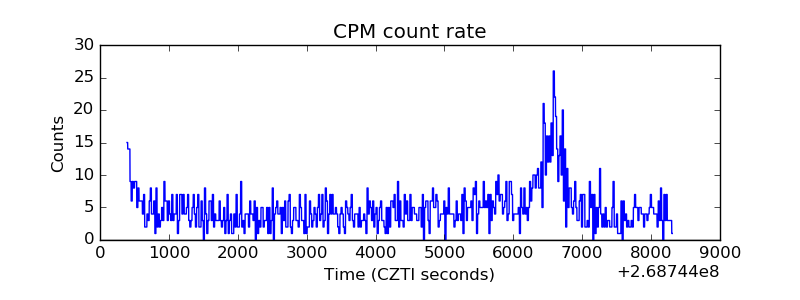 |
| CZT Counter | 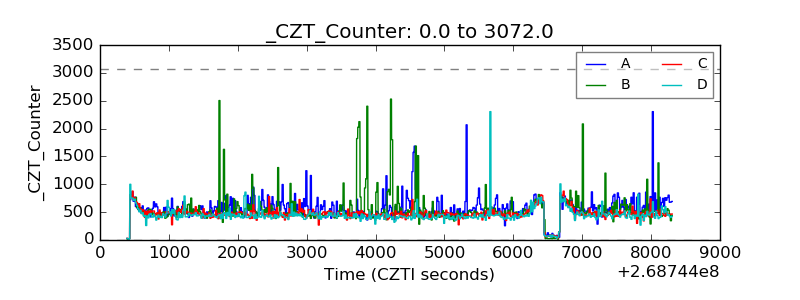 |
| +2.5 Volts monitor | 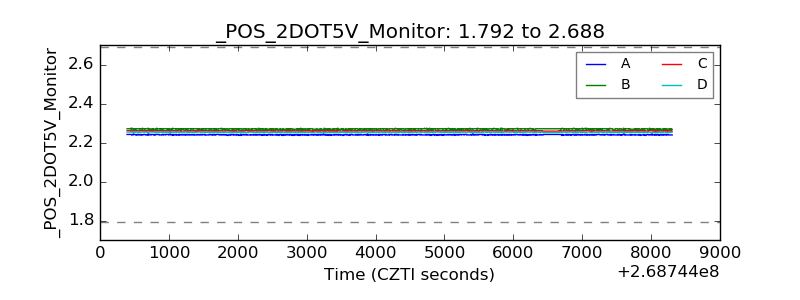 |
| +5 Volts monitor |  |
| _ROLL_ROT | 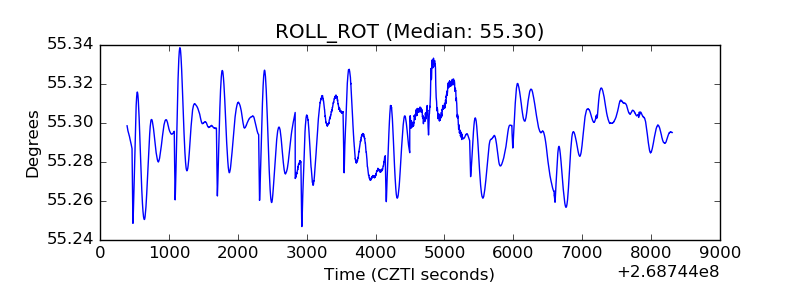 |
| _Roll_DEC | 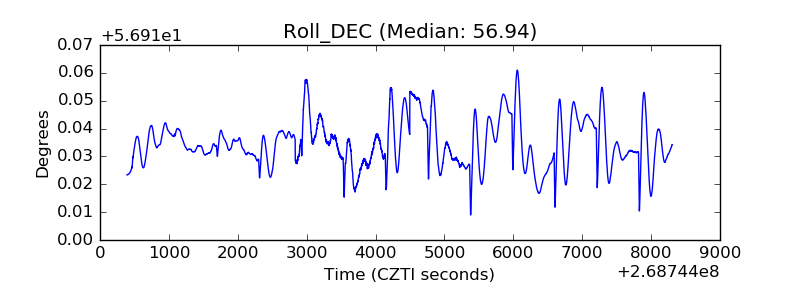 |
| _Roll_RA | 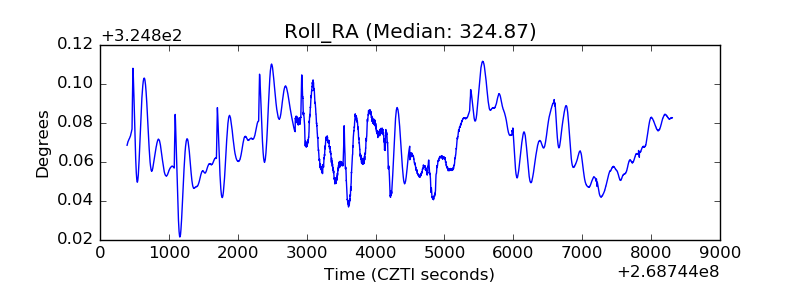 |
| Veto Counter |  |