| Param | Original file | Final file |
|---|---|---|
| Filename | modeM0/AS1T02_057T01_9000002212_15018cztM0_level2.evt | modeM0/AS1T02_057T01_9000002212_15018cztM0_level2_quad_clean.evt |
| Size (bytes) | 1,267,963,200 | 266,486,400 |
| Size | 1.2 GB | 254.1 MB |
| Events in quadrant A | 10,951,305 | 1,720,371 |
| Events in quadrant B | 9,371,491 | 1,731,617 |
| Events in quadrant C | 8,518,226 | 1,705,235 |
| Events in quadrant D | 8,330,671 | 1,661,773 |
| Mode M0 | |||
|---|---|---|---|
| Quadrant | BADHDUFLAG | Total packets | Discarded packets |
| A | 0 | 44695 | 4 |
| B | 0 | 39986 | 3 |
| C | 0 | 37058 | 3 |
| D | 0 | 38011 | 3 |
| Mode SS | |||
|---|---|---|---|
| Quadrant | BADHDUFLAG | Total packets | Discarded packets |
| A | 0 | 368 | 0 |
| B | 0 | 368 | 0 |
| C | 0 | 368 | 0 |
| D | 0 | 368 | 0 |
| Mode M9 | |||
|---|---|---|---|
| Quadrant | BADHDUFLAG | Total packets | Discarded packets |
| A | 0 | 21 | 0 |
| B | 0 | 21 | 0 |
| C | 0 | 21 | 0 |
| D | 0 | 21 | 0 |
| Quadrant | Total seconds | Saturated seconds | Saturation percentage |
|---|---|---|---|
| A | 18183 | 295 | 1.622395% |
| B | 18183 | 330 | 1.814882% |
| C | 18183 | 87 | 0.478469% |
| D | 18184 | 168 | 0.923889% |
Noise dominated data is calculated using 1-second bins in cleaned event files. If a bin has >2000 counts, and if more than 50% of those come from <1% of pixels, then it is considered to be noise-dominated and hence unusable.
| Quadrant | # 1 sec bins | Bins with >0 counts | Bins with >2000 counts | High rate bins dominated by noise | Noise dominated (total time) | Noise dominated (detector-on time) | Marked lightcurve |
|---|---|---|---|---|---|---|---|
| A | 20254 | 18186 | 90 | 90 | 0.44% | 0.49% | 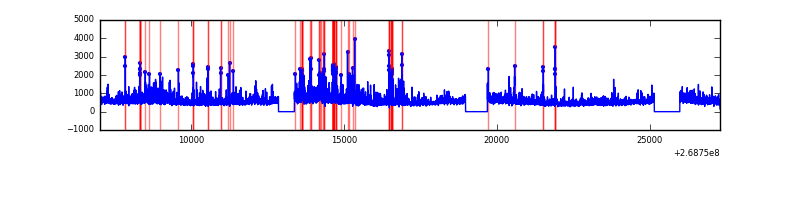 |
| B | 20254 | 18186 | 108 | 108 | 0.53% | 0.59% | 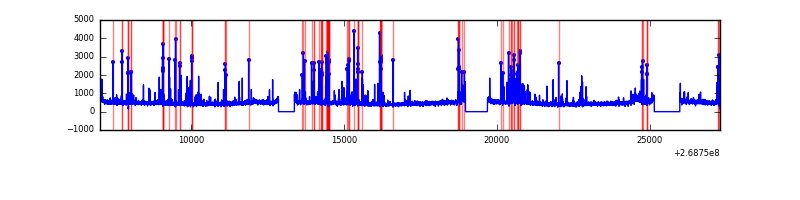 |
| C | 20254 | 18186 | 0 | 0 | 0.00% | 0.00% | 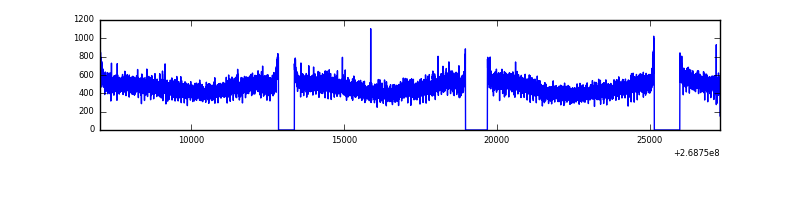 |
| D | 20255 | 18188 | 59 | 59 | 0.29% | 0.32% | 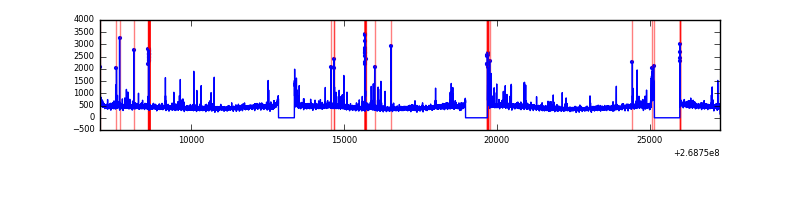 |
Top three noisy pixels from each quadrant. If the there are fewer than three noisy pixels in the level2.evt file, extra rows are filled as -1
| Pixel properties | Quadrant properties | ||||||
|---|---|---|---|---|---|---|---|
| Quadrant | DetID | PixID | Counts | Sigma | Mean | Median | Sigma |
| A | 15 | 239 | 1316842 | 3110.47 | 2120 | 2078 | 422.7 |
| A | 1 | 162 | 552122 | 1301.29 | 2120 | 2078 | 422.7 |
| A | 1 | 178 | 288520 | 677.66 | 2120 | 2078 | 422.7 |
| B | 3 | 64 | 502305 | 1257.36 | 2117 | 2063 | 397.9 |
| B | 0 | 245 | 177241 | 440.31 | 2117 | 2063 | 397.9 |
| B | 0 | 197 | 116794 | 288.38 | 2117 | 2063 | 397.9 |
| C | 3 | 233 | 494505 | 1041.88 | 2057 | 2068 | 472.6 |
| C | 13 | 61 | 15009 | 27.38 | 2057 | 2068 | 472.6 |
| C | 8 | 222 | 6831 | 10.08 | 2057 | 2068 | 472.6 |
| D | 12 | 222 | 159745 | 317.53 | 2059 | 1998 | 496.8 |
| D | 15 | 0 | 90154 | 177.45 | 2059 | 1998 | 496.8 |
| D | 7 | 38 | 77709 | 152.4 | 2059 | 1998 | 496.8 |
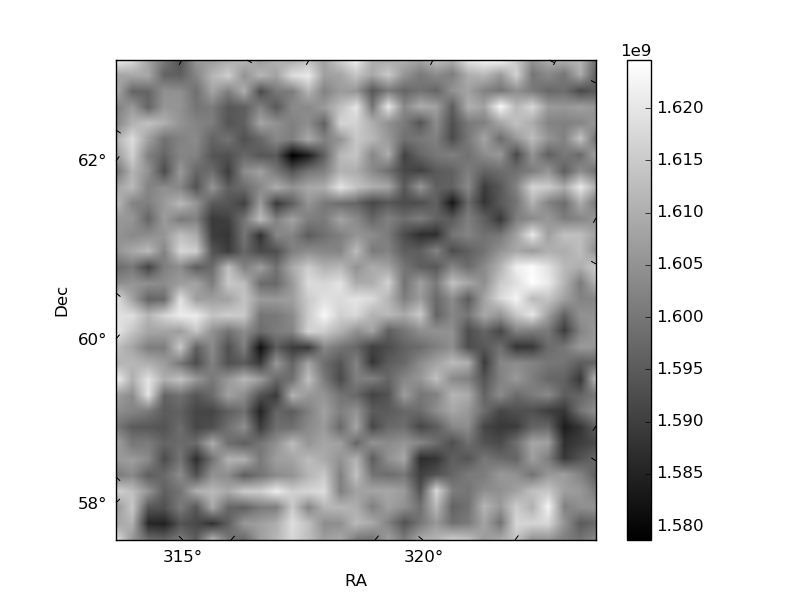
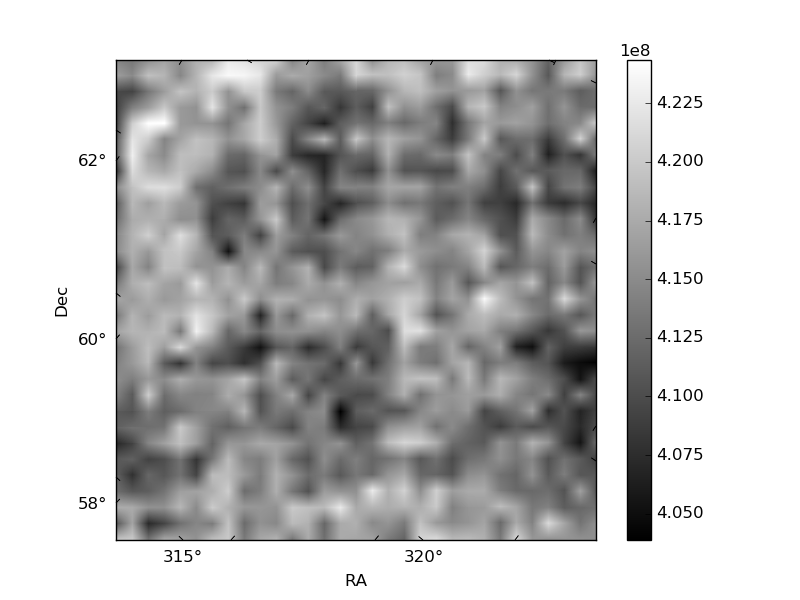
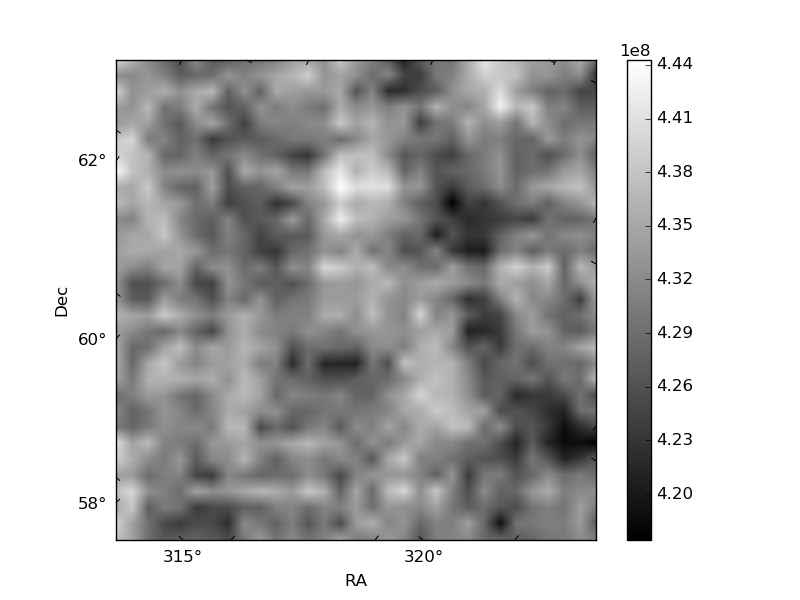
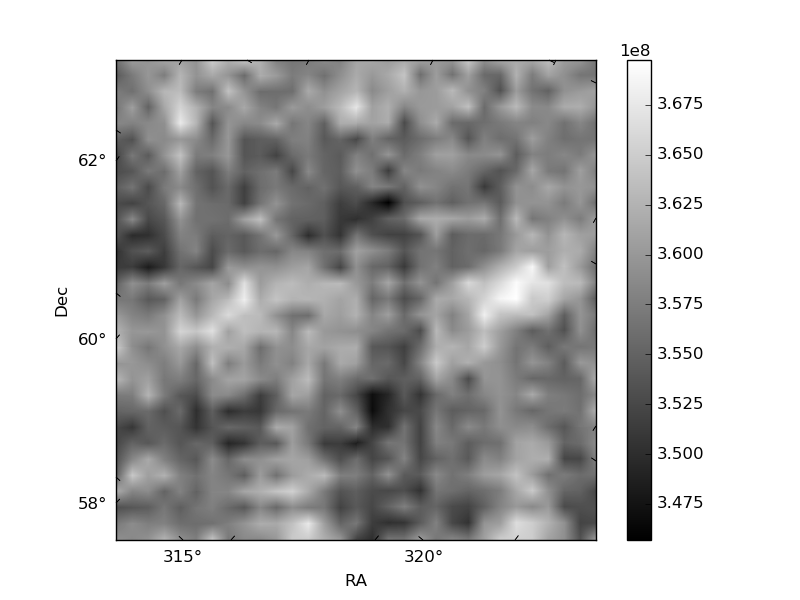
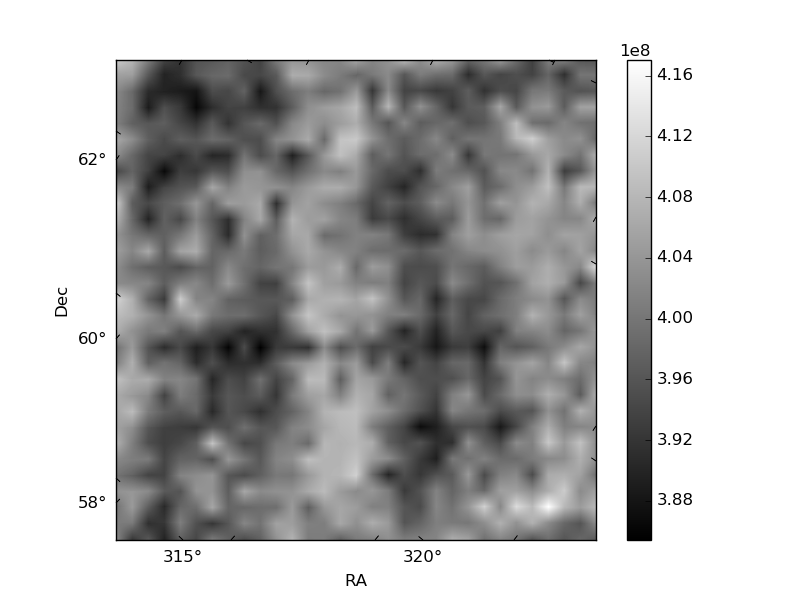
Histogram calculated using DETX and DETY for each event in the final _common_clean file
| Quadrant A | 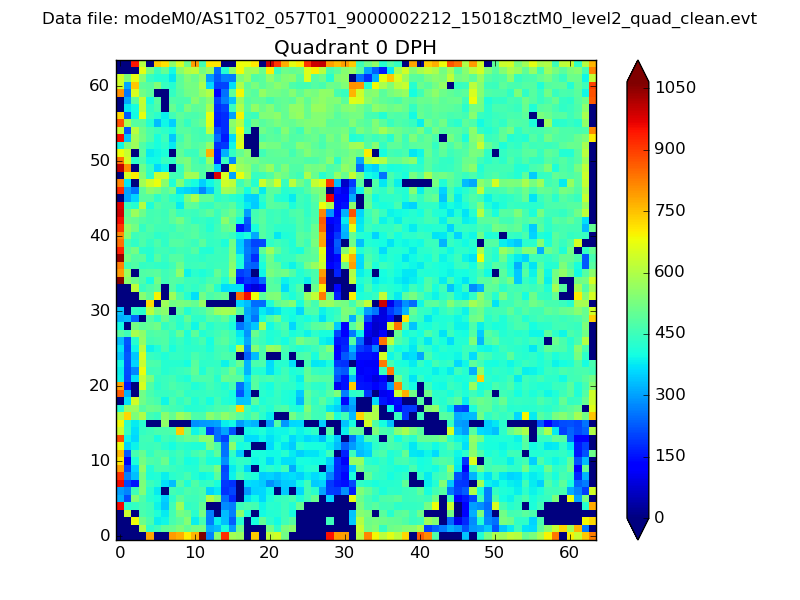 |
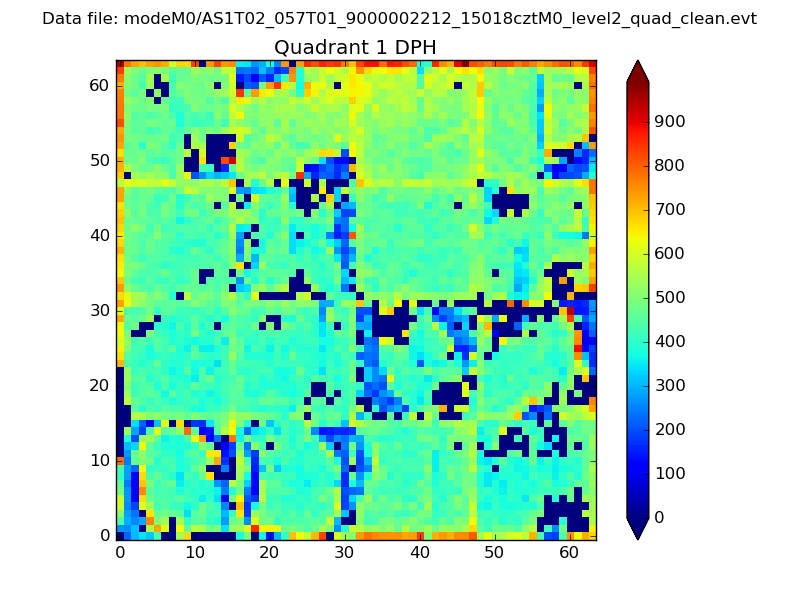 |
Quadrant B |
|---|---|---|---|
| Quadrant D | 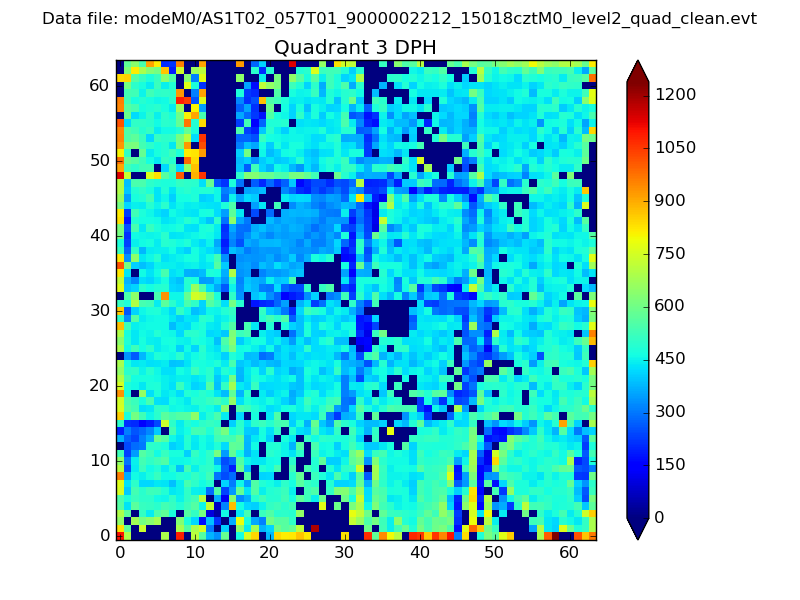 |
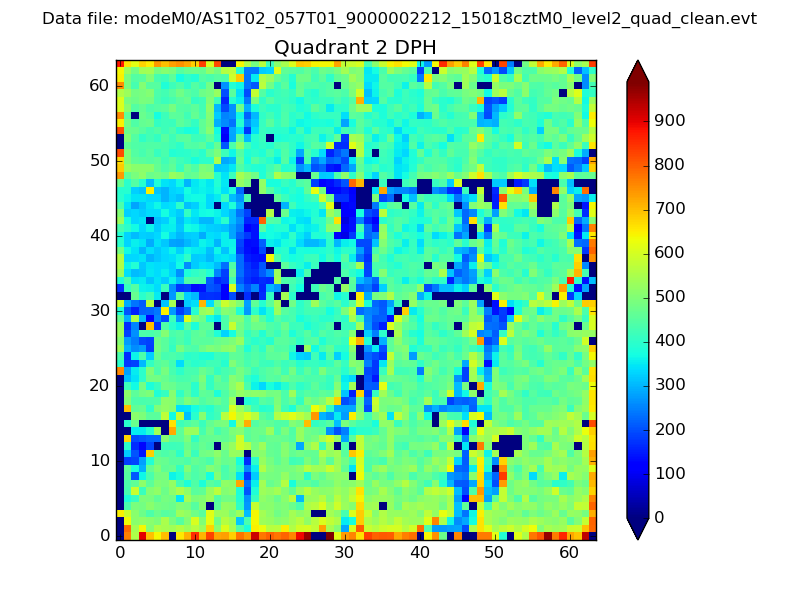 |
Quadrant C |
| Plot type | Count rate plots | Images |
|---|---|---|
| Comparison with Poisson distribution Blue bars denote a histogram of data divided into 1 sec bins. Red curve is a Poisson curve with rate = median count rate of data. |
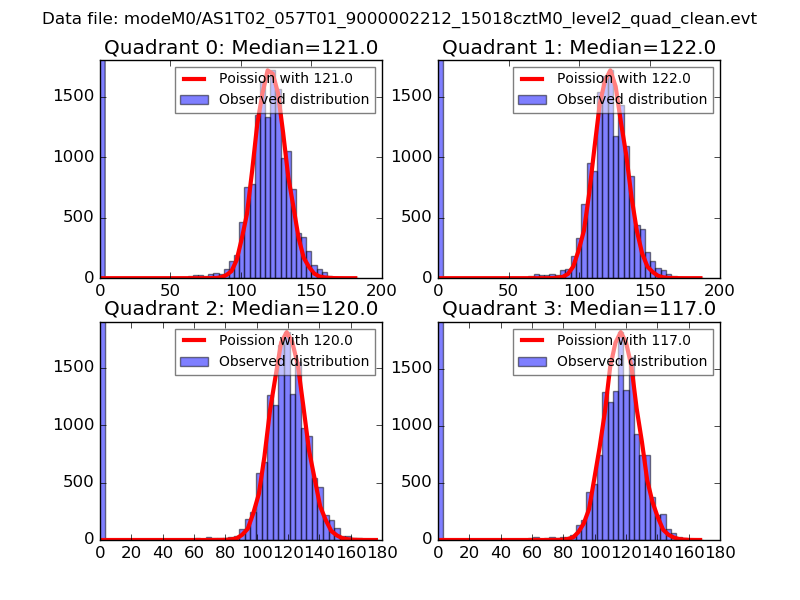 |
 |
| Quadrant-wise count rates Data is divided into 100 sec bins |
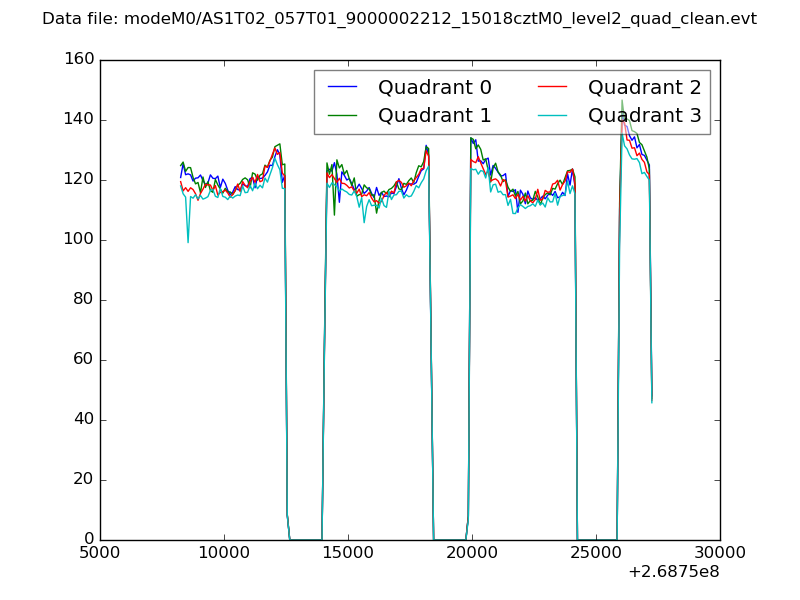 |
|
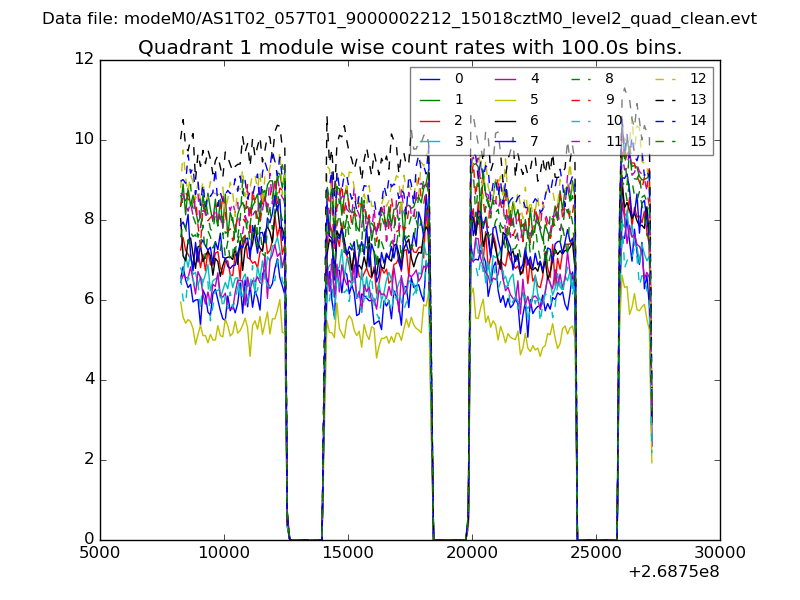
| Module-wise count rates for Quadrant A Data is divided into 100 sec bins |
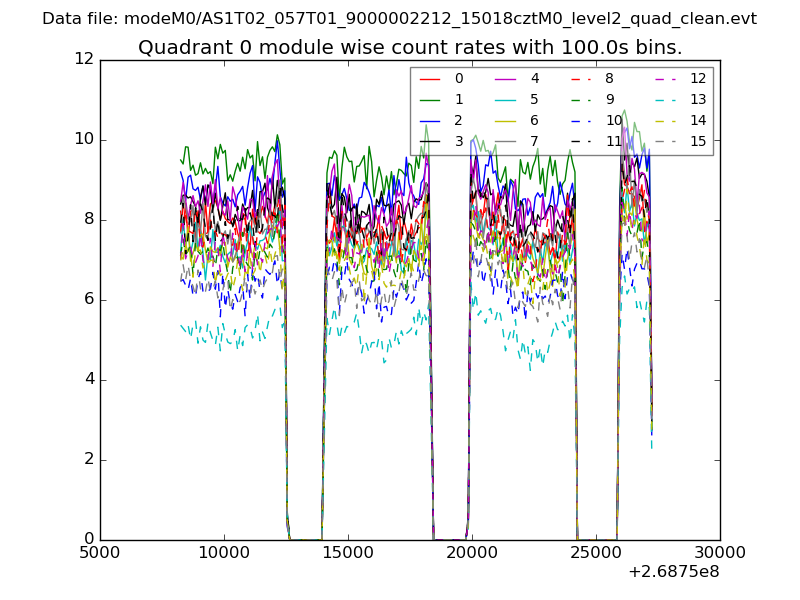 |
 |
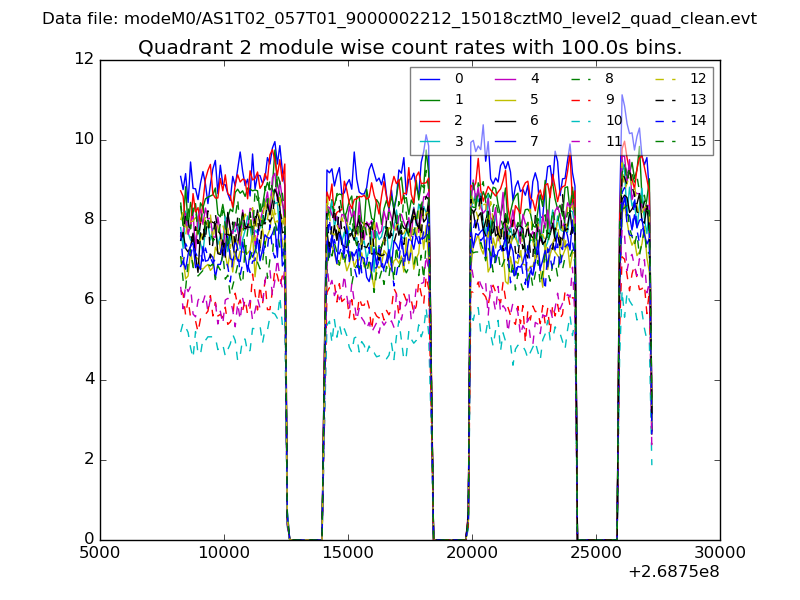
| Module-wise count rates for Quadrant B Data is divided into 100 sec bins |
 |
 |
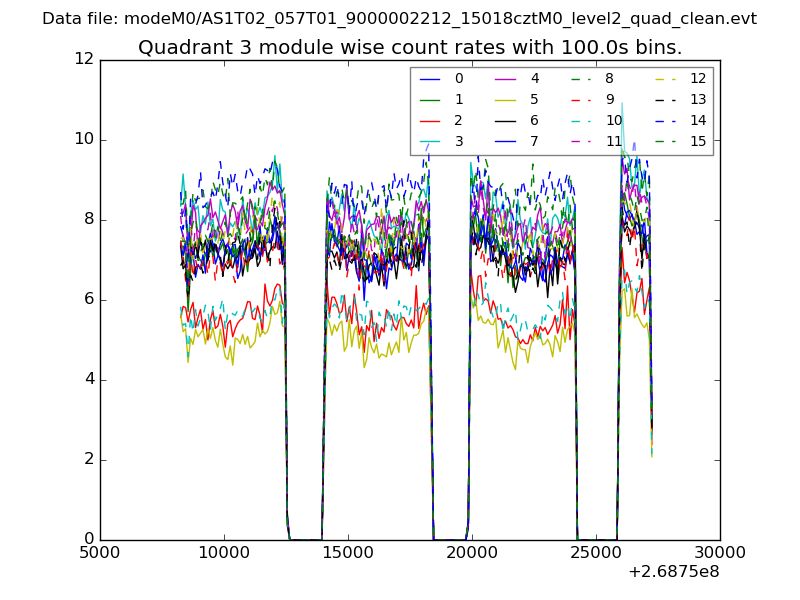
| Module-wise count rates for Quadrant C Data is divided into 100 sec bins |
 |
 |
| Module-wise count rates for Quadrant D Data is divided into 100 sec bins |
 |
 |
| Parameter | Plot |
|---|---|
| CZT HV Monitor | 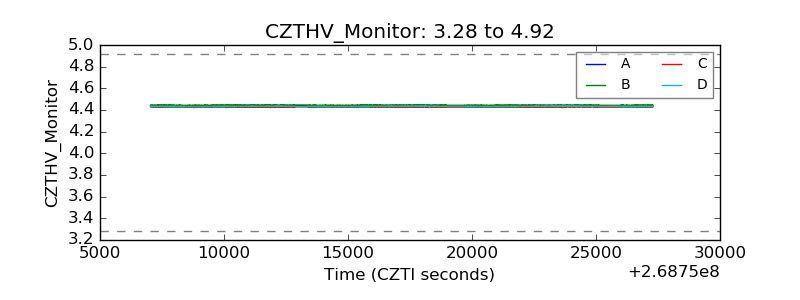 |
| D_VDD | 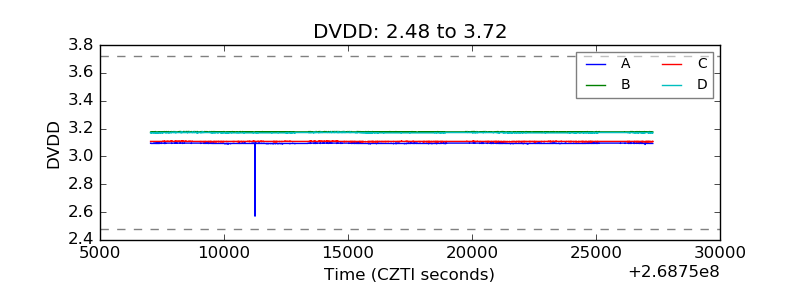 |
| Temperature 1 | 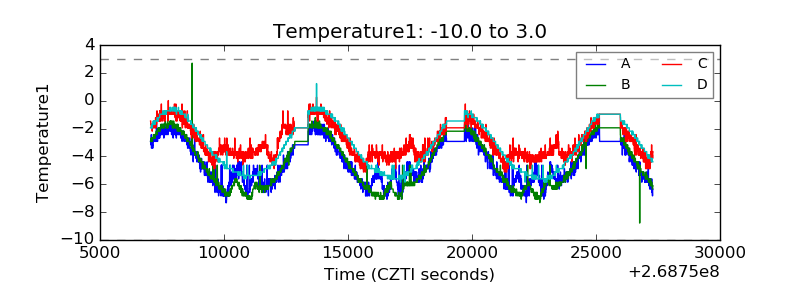 |
| Veto HV Monitor | 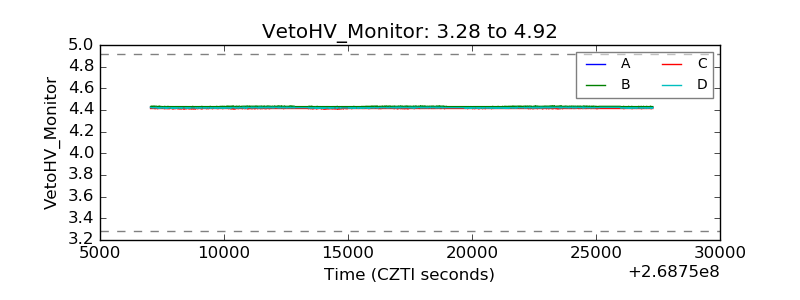 |
| Veto LLD | 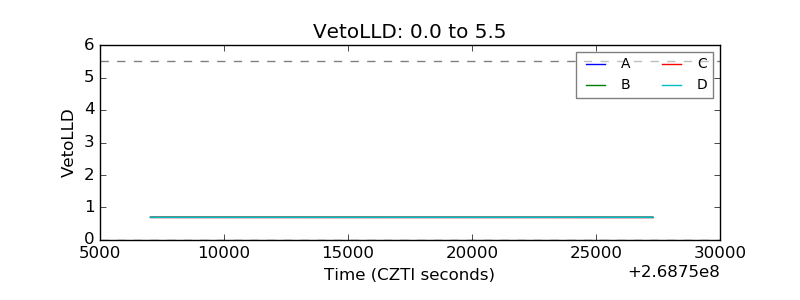 |
| Alpha Counter | 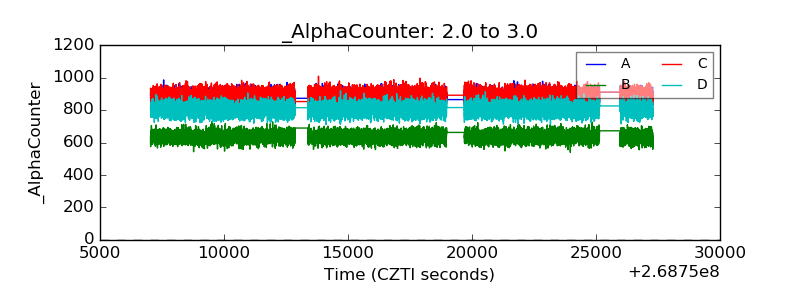 |
| _CPM_Rate | 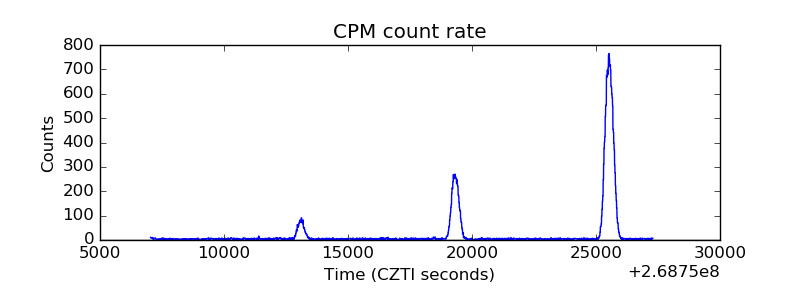 |
| CZT Counter | 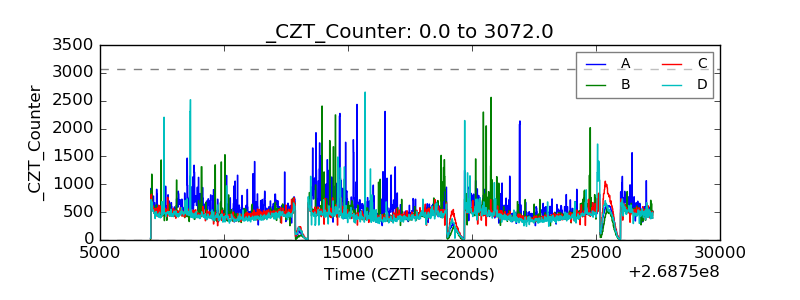 |
| +2.5 Volts monitor | 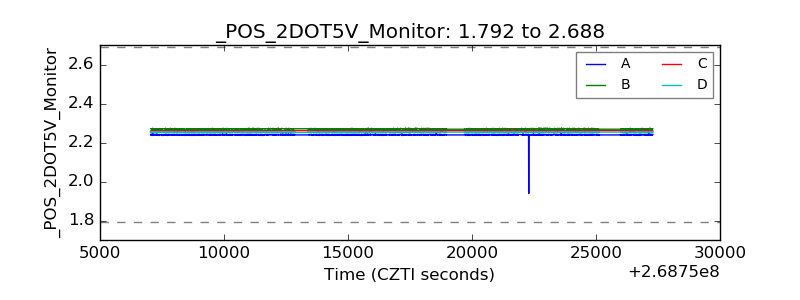 |
| +5 Volts monitor |  |
| _ROLL_ROT | 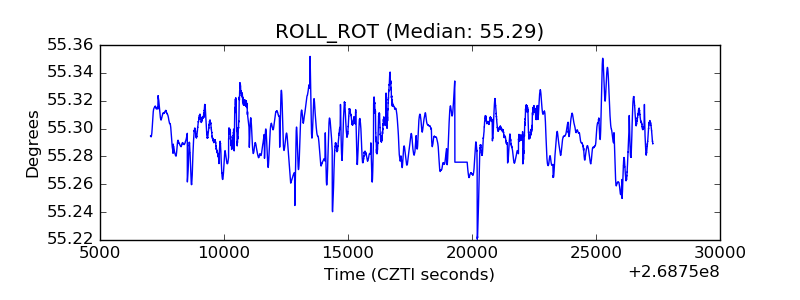 |
| _Roll_DEC | 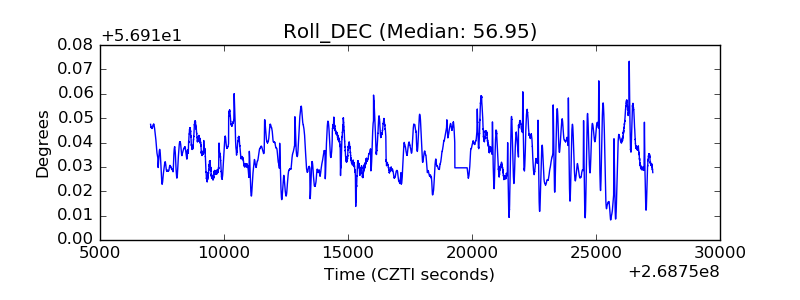 |
| _Roll_RA | 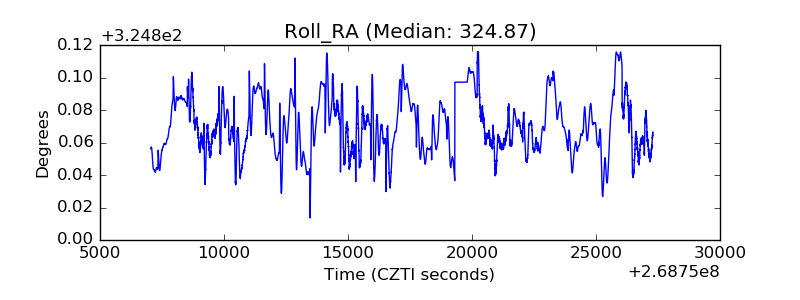 |
| Veto Counter | 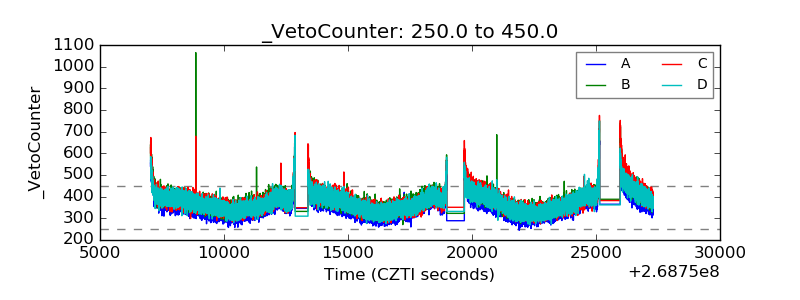 |