| Param | Original file | Final file |
|---|---|---|
| Filename | modeM0/AS1T02_057T01_9000002212_15020cztM0_level2.evt | modeM0/AS1T02_057T01_9000002212_15020cztM0_level2_quad_clean.evt |
| Size (bytes) | 457,773,120 | 99,967,680 |
| Size | 436.6 MB | 95.3 MB |
| Events in quadrant A | 3,472,438 | 647,166 |
| Events in quadrant B | 3,401,427 | 658,739 |
| Events in quadrant C | 3,543,424 | 647,614 |
| Events in quadrant D | 3,005,814 | 621,654 |
| Mode M0 | |||
|---|---|---|---|
| Quadrant | BADHDUFLAG | Total packets | Discarded packets |
| A | 0 | 14633 | 3 |
| B | 0 | 14469 | 2 |
| C | 0 | 15027 | 2 |
| D | 0 | 13688 | 2 |
| Mode SS | |||
|---|---|---|---|
| Quadrant | BADHDUFLAG | Total packets | Discarded packets |
| A | 0 | 132 | 0 |
| B | 0 | 132 | 0 |
| C | 0 | 132 | 0 |
| D | 0 | 132 | 0 |
| Mode M9 | |||
|---|---|---|---|
| Quadrant | BADHDUFLAG | Total packets | Discarded packets |
| A | 0 | 20 | 0 |
| B | 0 | 20 | 0 |
| C | 0 | 20 | 0 |
| D | 0 | 20 | 0 |
| Quadrant | Total seconds | Saturated seconds | Saturation percentage |
|---|---|---|---|
| A | 6483 | 34 | 0.524449% |
| B | 6483 | 107 | 1.650470% |
| C | 6483 | 118 | 1.820145% |
| D | 6483 | 30 | 0.462749% |
Noise dominated data is calculated using 1-second bins in cleaned event files. If a bin has >2000 counts, and if more than 50% of those come from <1% of pixels, then it is considered to be noise-dominated and hence unusable.
| Quadrant | # 1 sec bins | Bins with >0 counts | Bins with >2000 counts | High rate bins dominated by noise | Noise dominated (total time) | Noise dominated (detector-on time) | Marked lightcurve |
|---|---|---|---|---|---|---|---|
| A | 7619 | 6485 | 0 | 0 | 0.00% | 0.00% | 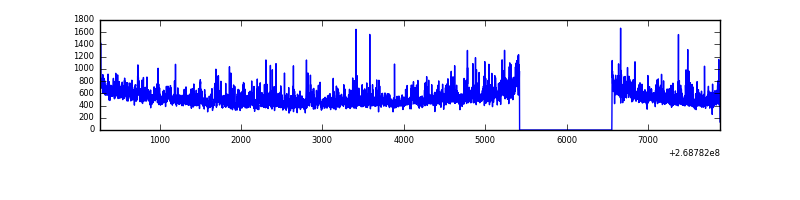 |
| B | 7619 | 6484 | 45 | 45 | 0.59% | 0.69% | 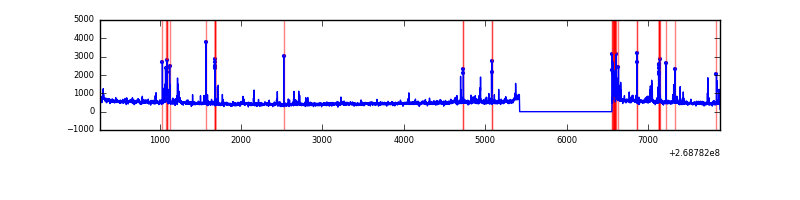 |
| C | 7619 | 6484 | 63 | 63 | 0.83% | 0.97% | 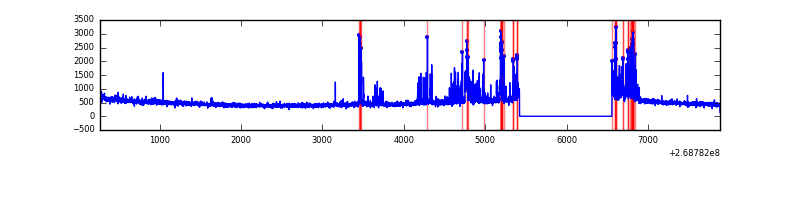 |
| D | 7619 | 6485 | 12 | 12 | 0.16% | 0.19% | 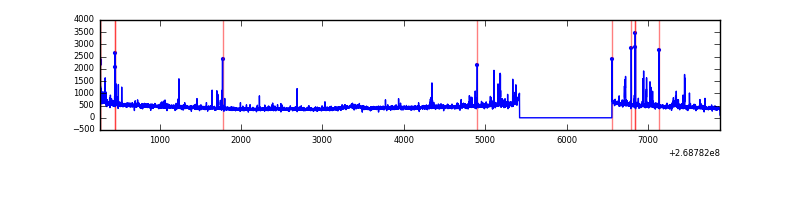 |
Top three noisy pixels from each quadrant. If the there are fewer than three noisy pixels in the level2.evt file, extra rows are filled as -1
| Pixel properties | Quadrant properties | ||||||
|---|---|---|---|---|---|---|---|
| Quadrant | DetID | PixID | Counts | Sigma | Mean | Median | Sigma |
| A | 1 | 162 | 167244 | 1077.49 | 765 | 749 | 154.5 |
| A | 12 | 189 | 111467 | 716.52 | 765 | 749 | 154.5 |
| A | 1 | 178 | 87724 | 562.87 | 765 | 749 | 154.5 |
| B | 0 | 229 | 236264 | 1635.73 | 768 | 749 | 144.0 |
| B | 3 | 64 | 110501 | 762.26 | 768 | 749 | 144.0 |
| B | 3 | 209 | 18031 | 120.03 | 768 | 749 | 144.0 |
| C | 9 | 236 | 477715 | 2788.49 | 747 | 751 | 171.0 |
| C | 3 | 233 | 116757 | 678.21 | 747 | 751 | 171.0 |
| C | 0 | 207 | 25576 | 145.14 | 747 | 751 | 171.0 |
| D | 10 | 70 | 67265 | 374.03 | 743 | 720 | 177.9 |
| D | 2 | 136 | 54320 | 301.27 | 743 | 720 | 177.9 |
| D | 12 | 222 | 25720 | 140.52 | 743 | 720 | 177.9 |
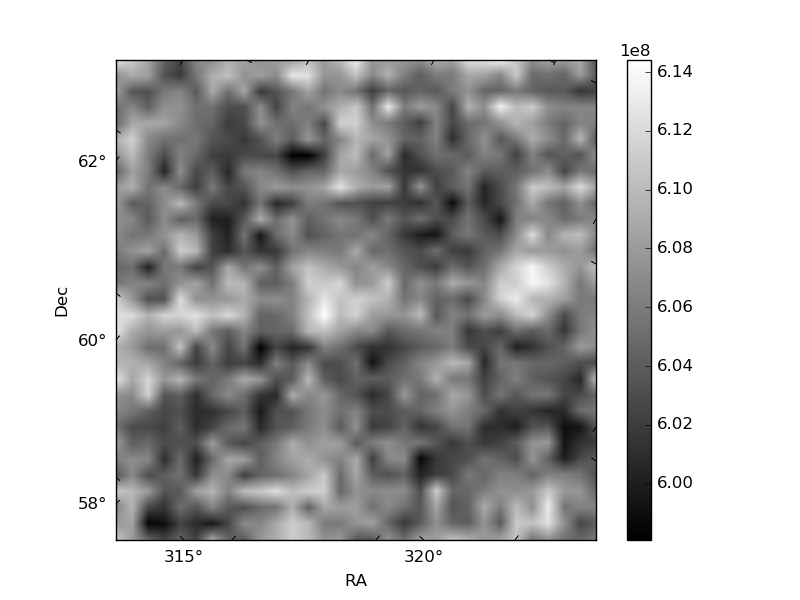
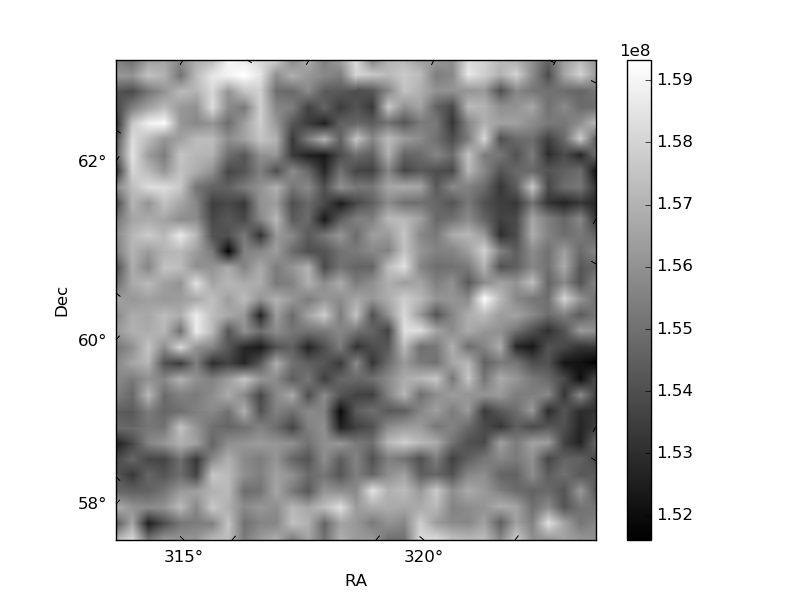
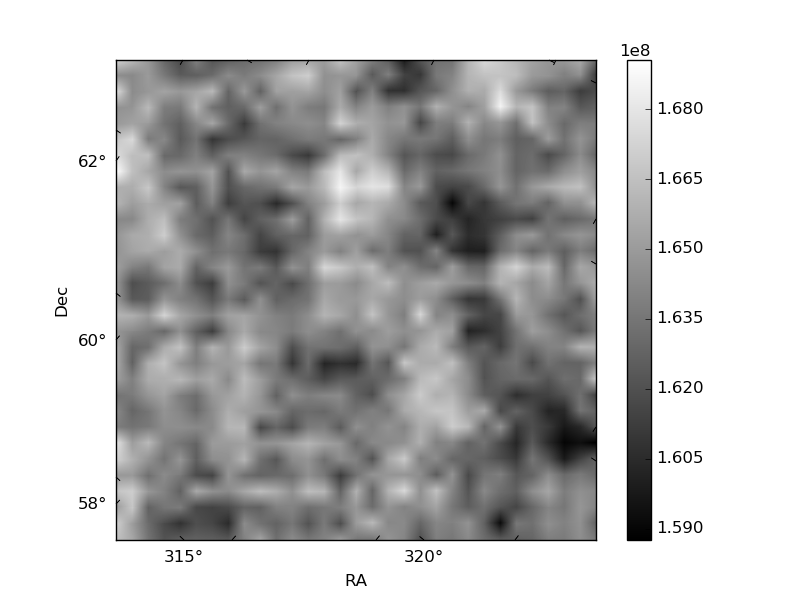
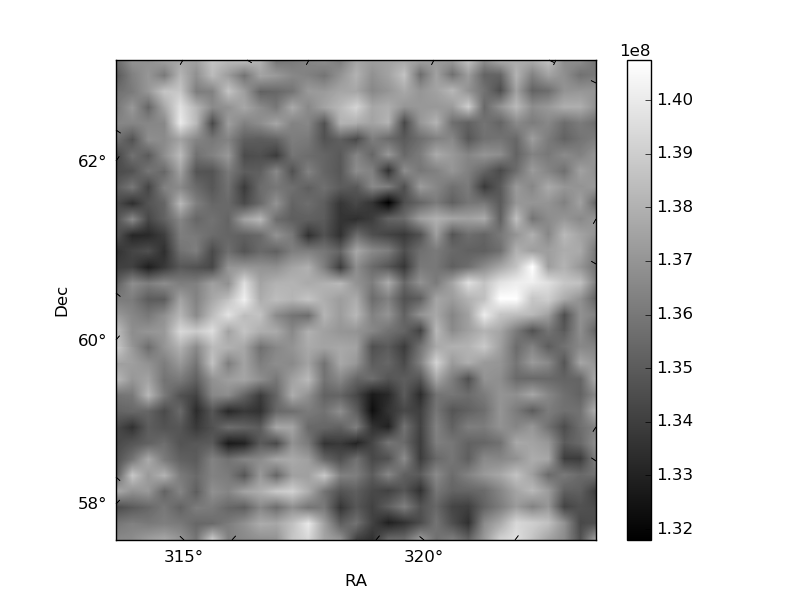
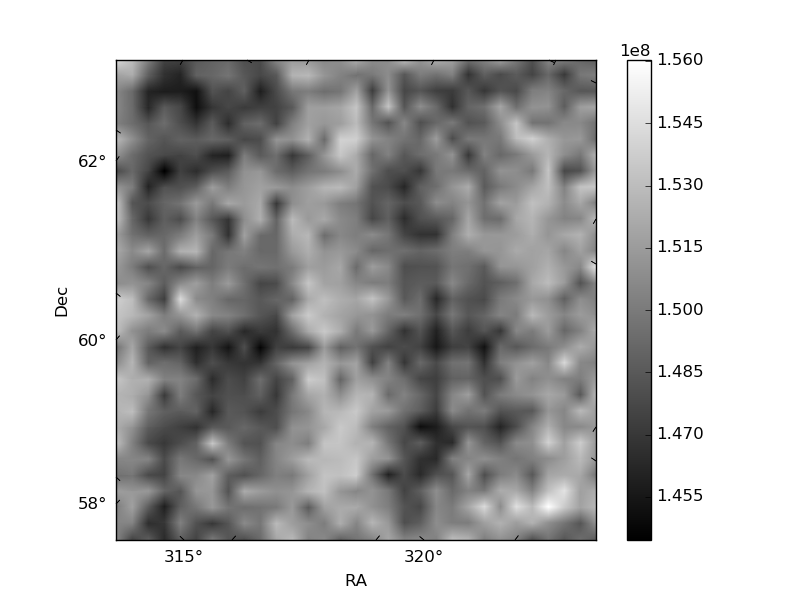
Histogram calculated using DETX and DETY for each event in the final _common_clean file
| Quadrant A | 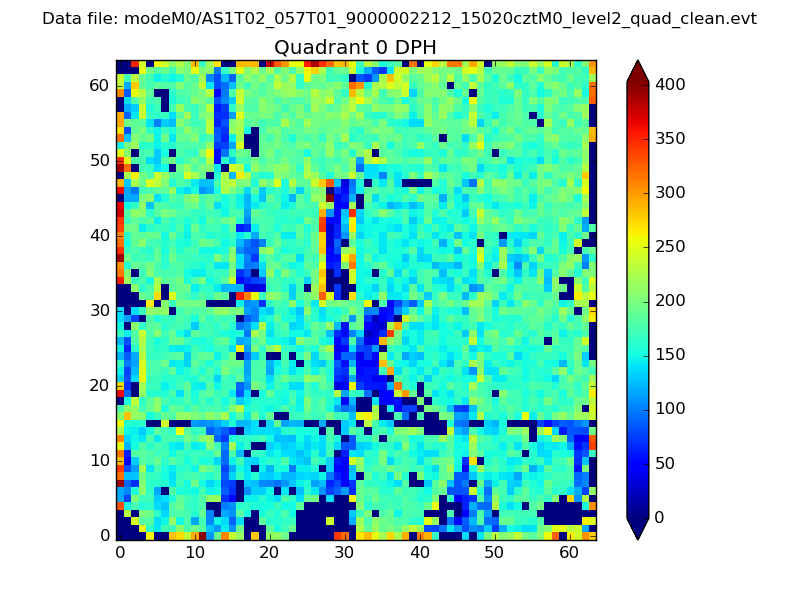 |
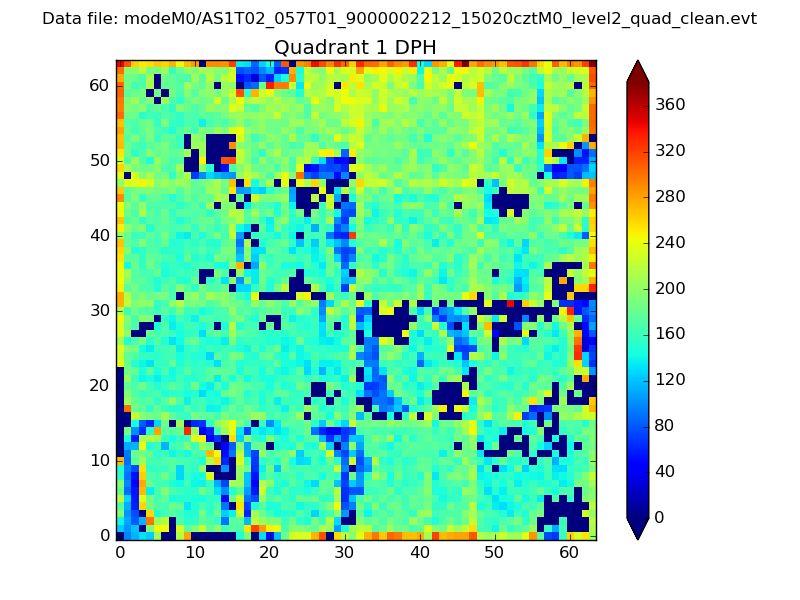 |
Quadrant B |
|---|---|---|---|
| Quadrant D | 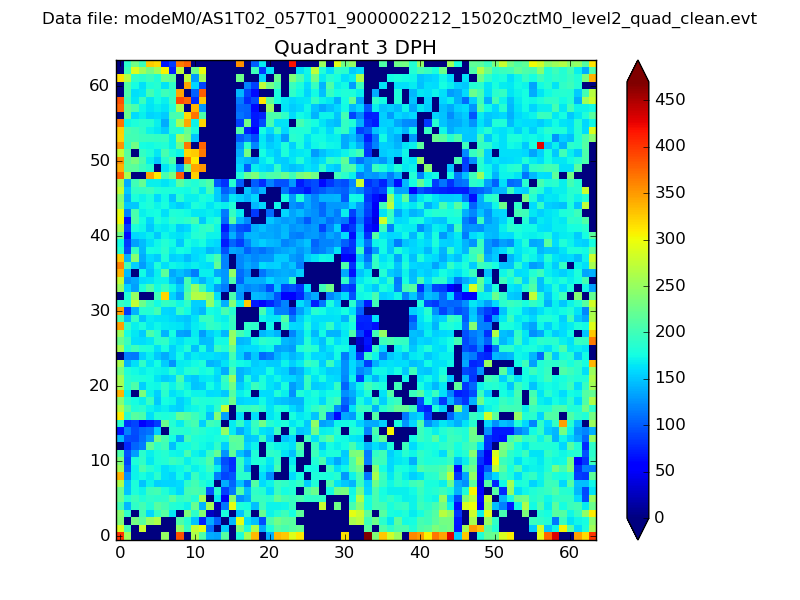 |
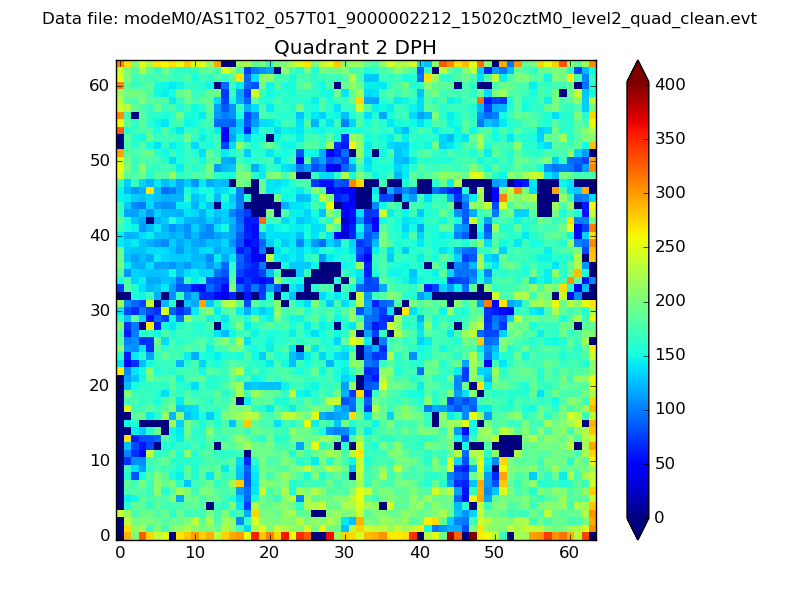 |
Quadrant C |
| Plot type | Count rate plots | Images |
|---|---|---|
| Comparison with Poisson distribution Blue bars denote a histogram of data divided into 1 sec bins. Red curve is a Poisson curve with rate = median count rate of data. |
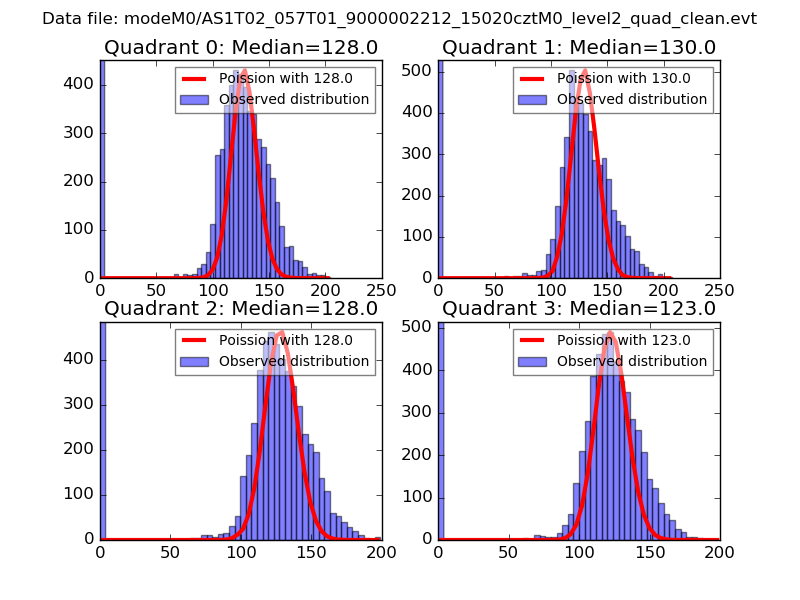 |
 |
| Quadrant-wise count rates Data is divided into 100 sec bins |
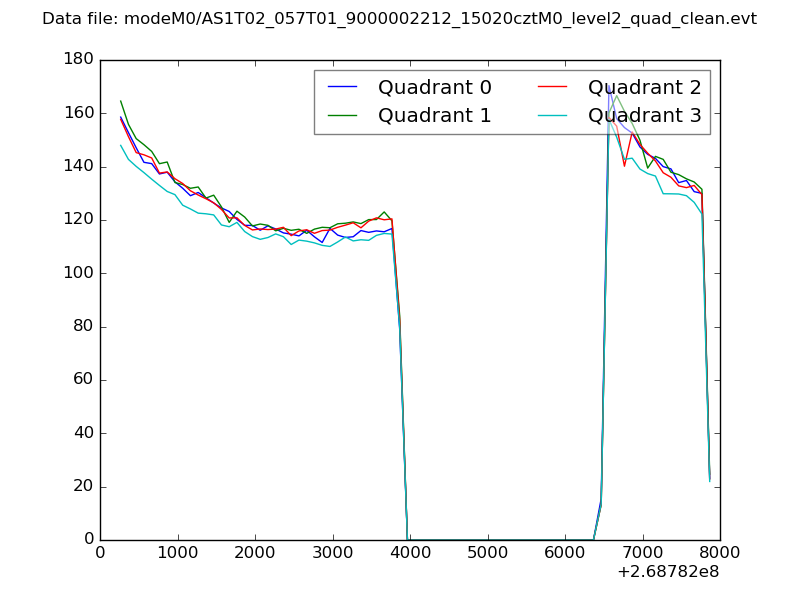 |
|
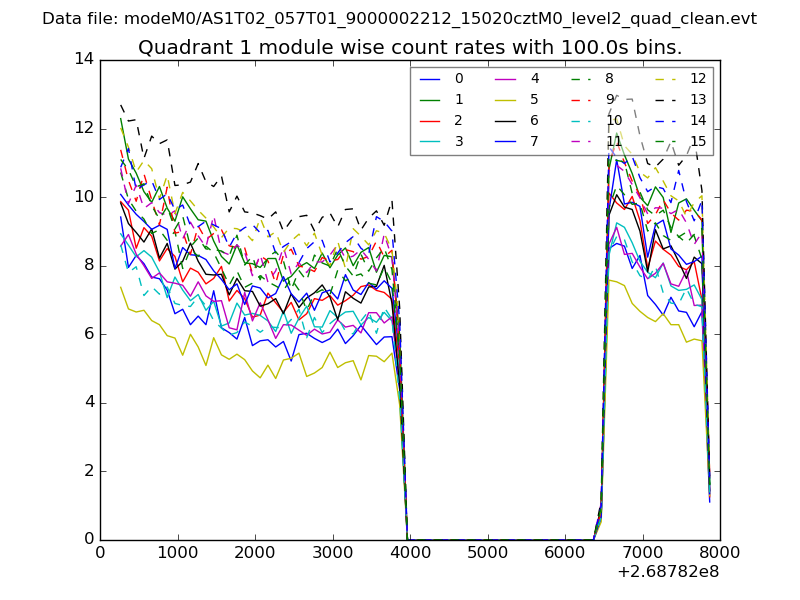
| Module-wise count rates for Quadrant A Data is divided into 100 sec bins |
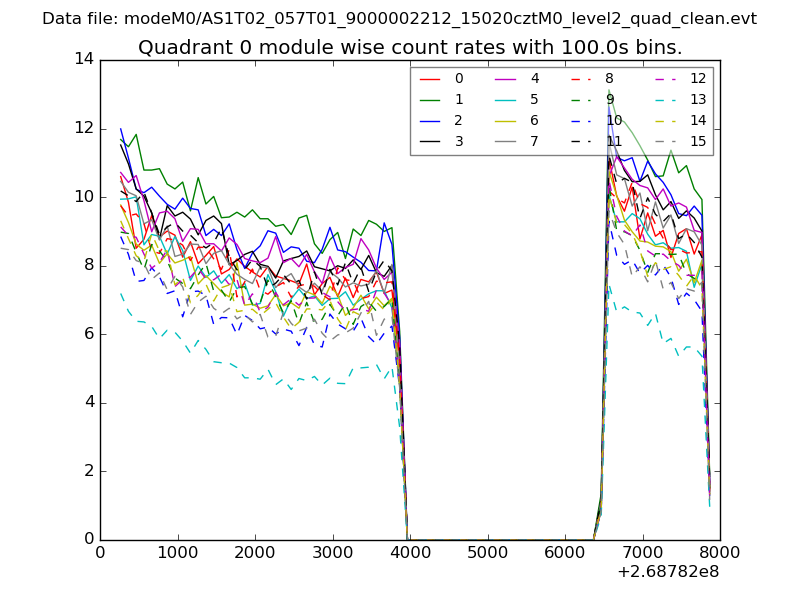 |
 |
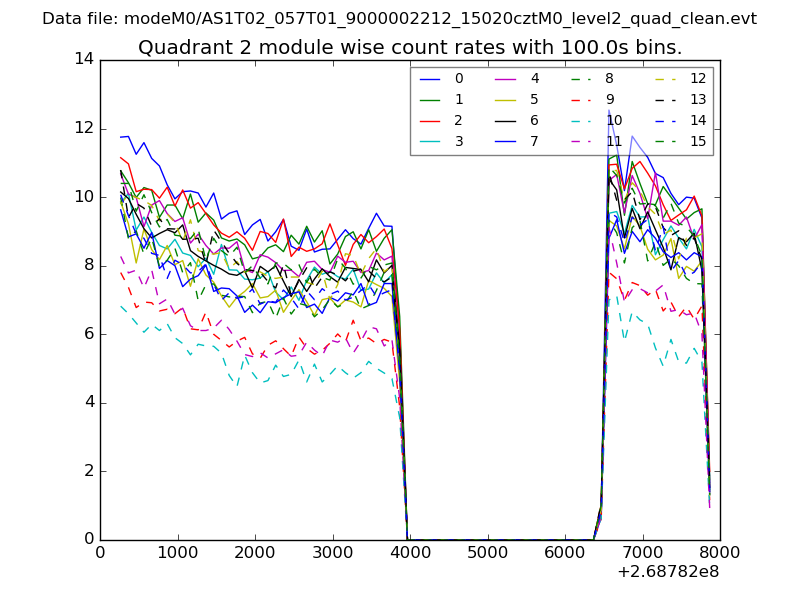
| Module-wise count rates for Quadrant B Data is divided into 100 sec bins |
 |
 |
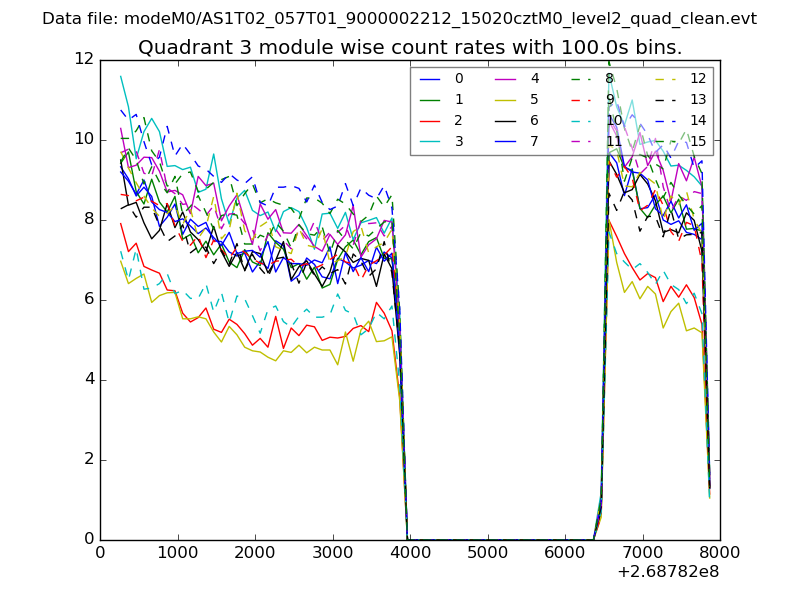
| Module-wise count rates for Quadrant C Data is divided into 100 sec bins |
 |
 |
| Module-wise count rates for Quadrant D Data is divided into 100 sec bins |
 |
 |
| Parameter | Plot |
|---|---|
| CZT HV Monitor | 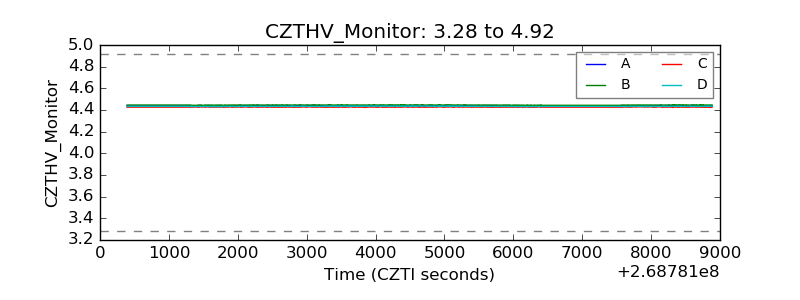 |
| D_VDD | 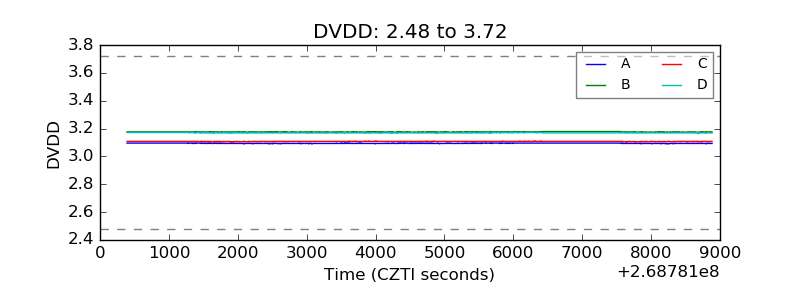 |
| Temperature 1 | 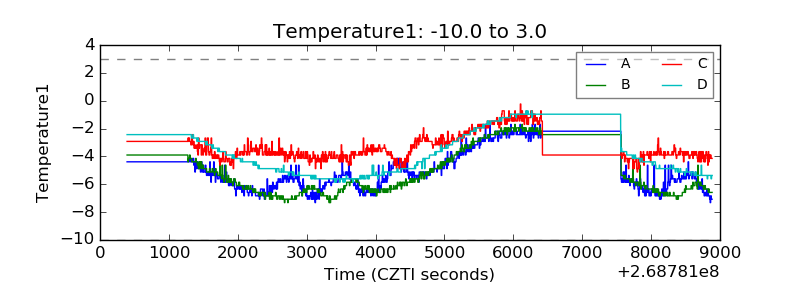 |
| Veto HV Monitor | 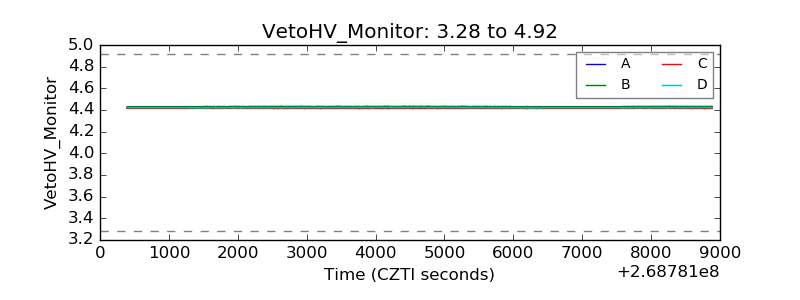 |
| Veto LLD | 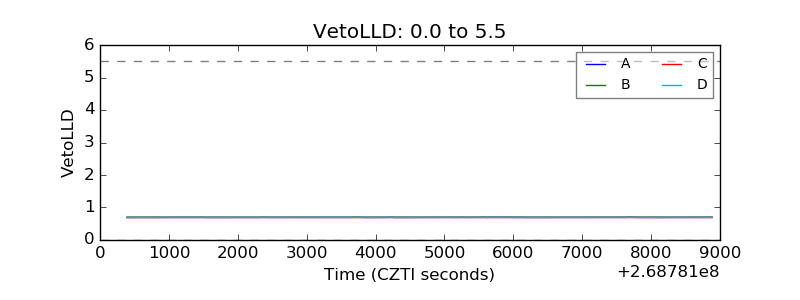 |
| Alpha Counter | 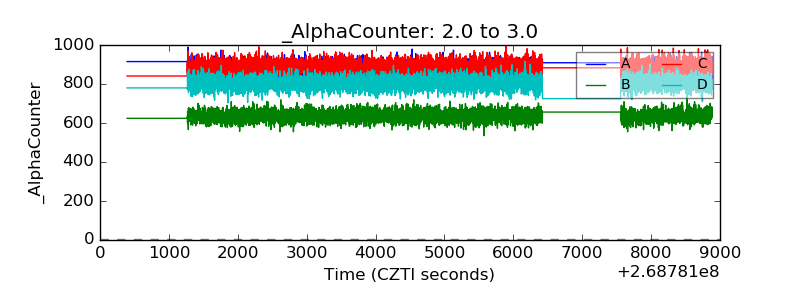 |
| _CPM_Rate | 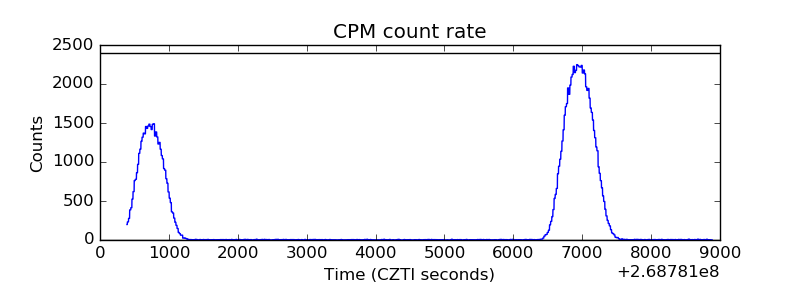 |
| CZT Counter | 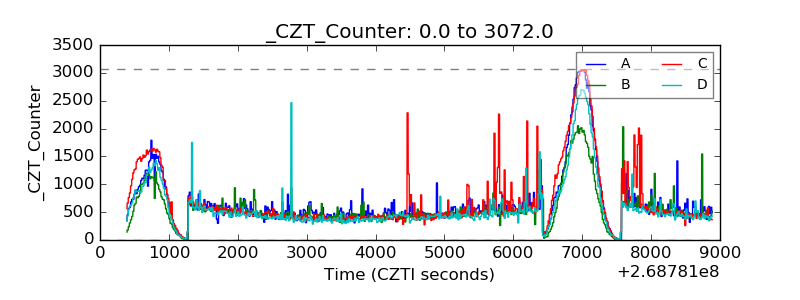 |
| +2.5 Volts monitor |  |
| +5 Volts monitor |  |
| _ROLL_ROT |  |
| _Roll_DEC | 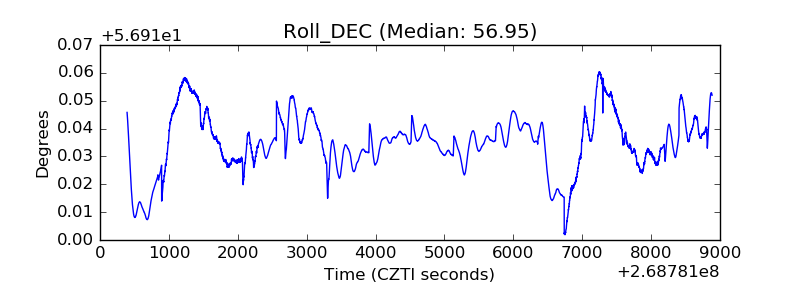 |
| _Roll_RA | 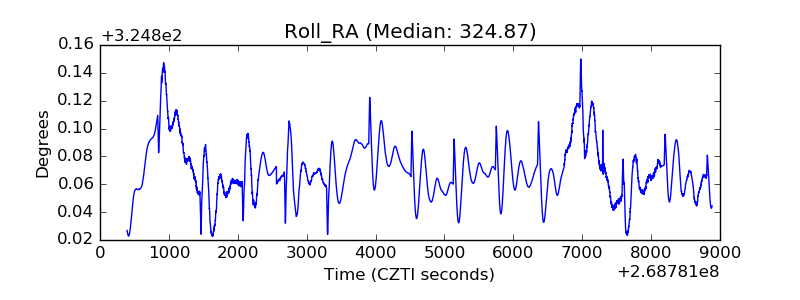 |
| Veto Counter |  |