| Param | Original file | Final file |
|---|---|---|
| Filename | modeM0/AS1T02_057T01_9000002212_15023cztM0_level2.evt | modeM0/AS1T02_057T01_9000002212_15023cztM0_level2_quad_clean.evt |
| Size (bytes) | 540,743,040 | 106,200,000 |
| Size | 515.7 MB | 101.3 MB |
| Events in quadrant A | 3,530,588 | 703,404 |
| Events in quadrant B | 3,857,489 | 720,167 |
| Events in quadrant C | 3,268,739 | 699,427 |
| Events in quadrant D | 5,279,634 | 640,340 |
| Mode M0 | |||
|---|---|---|---|
| Quadrant | BADHDUFLAG | Total packets | Discarded packets |
| A | 0 | 14684 | 3 |
| B | 0 | 15570 | 2 |
| C | 0 | 13802 | 2 |
| D | 0 | 20088 | 2 |
| Mode SS | |||
|---|---|---|---|
| Quadrant | BADHDUFLAG | Total packets | Discarded packets |
| A | 0 | 132 | 0 |
| B | 0 | 132 | 0 |
| C | 0 | 132 | 0 |
| D | 0 | 132 | 0 |
| Mode M9 | |||
|---|---|---|---|
| Quadrant | BADHDUFLAG | Total packets | Discarded packets |
| A | 0 | 21 | 0 |
| B | 0 | 21 | 0 |
| C | 0 | 21 | 0 |
| D | 0 | 22 | 0 |
| Quadrant | Total seconds | Saturated seconds | Saturation percentage |
|---|---|---|---|
| A | 6499 | 38 | 0.584705% |
| B | 6499 | 174 | 2.677335% |
| C | 6499 | 40 | 0.615479% |
| D | 6499 | 407 | 6.262502% |
Noise dominated data is calculated using 1-second bins in cleaned event files. If a bin has >2000 counts, and if more than 50% of those come from <1% of pixels, then it is considered to be noise-dominated and hence unusable.
| Quadrant | # 1 sec bins | Bins with >0 counts | Bins with >2000 counts | High rate bins dominated by noise | Noise dominated (total time) | Noise dominated (detector-on time) | Marked lightcurve |
|---|---|---|---|---|---|---|---|
| A | 7800 | 6502 | 3 | 3 | 0.04% | 0.05% | 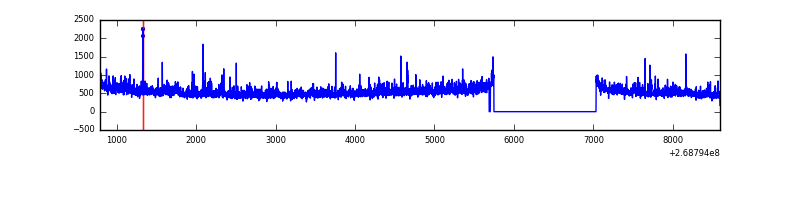 |
| B | 7800 | 6502 | 118 | 118 | 1.51% | 1.81% | 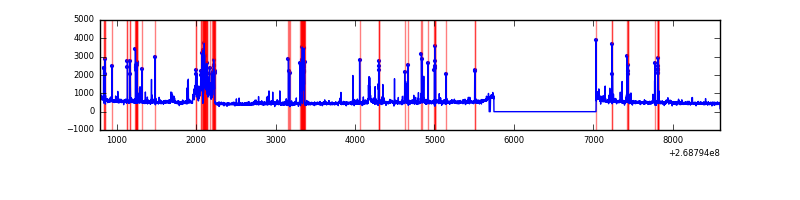 |
| C | 7800 | 6502 | 11 | 11 | 0.14% | 0.17% | 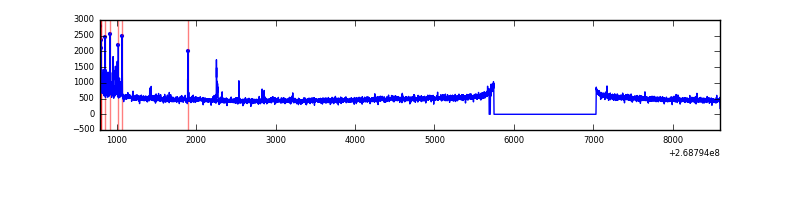 |
| D | 7800 | 6502 | 434 | 434 | 5.56% | 6.67% | 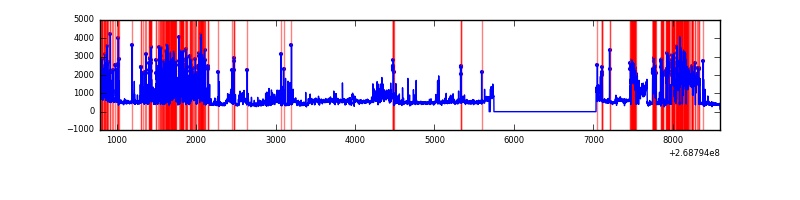 |
Top three noisy pixels from each quadrant. If the there are fewer than three noisy pixels in the level2.evt file, extra rows are filled as -1
| Pixel properties | Quadrant properties | ||||||
|---|---|---|---|---|---|---|---|
| Quadrant | DetID | PixID | Counts | Sigma | Mean | Median | Sigma |
| A | 1 | 162 | 180412 | 1137.82 | 795 | 781 | 157.9 |
| A | 1 | 178 | 94965 | 596.58 | 795 | 781 | 157.9 |
| A | 1 | 161 | 82212 | 515.8 | 795 | 781 | 157.9 |
| B | 3 | 64 | 703520 | 4762.84 | 798 | 779 | 147.5 |
| B | 0 | 229 | 23431 | 153.52 | 798 | 779 | 147.5 |
| B | 12 | 111 | 16712 | 107.99 | 798 | 779 | 147.5 |
| C | 3 | 233 | 159618 | 902.08 | 769 | 773 | 176.1 |
| C | 9 | 236 | 80802 | 454.48 | 769 | 773 | 176.1 |
| C | 0 | 207 | 27728 | 153.08 | 769 | 773 | 176.1 |
| D | 7 | 223 | 1107688 | 6207.62 | 747 | 725 | 178.3 |
| D | 2 | 136 | 1088651 | 6100.86 | 747 | 725 | 178.3 |
| D | 10 | 70 | 180753 | 1009.56 | 747 | 725 | 178.3 |
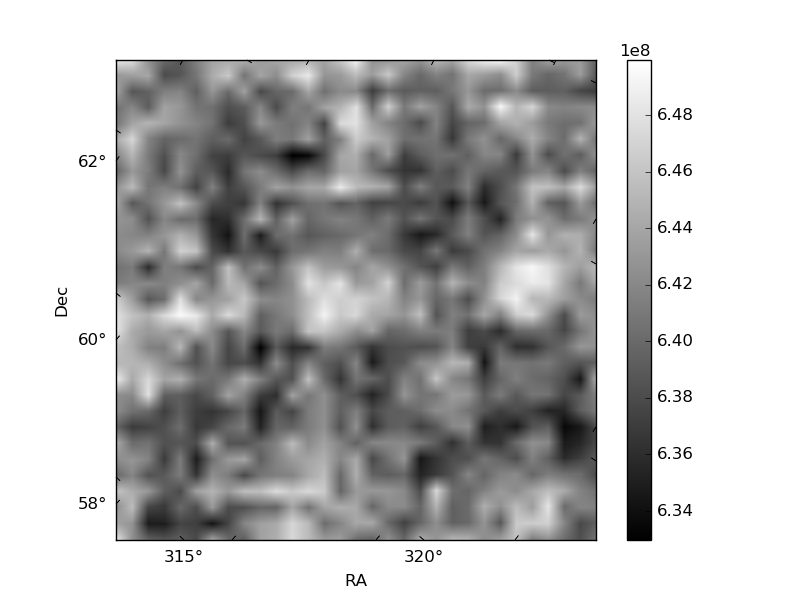
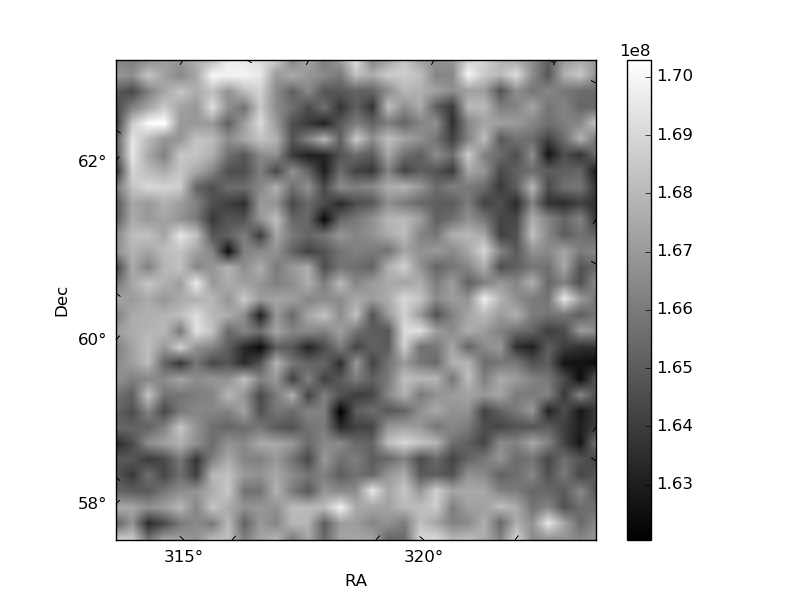
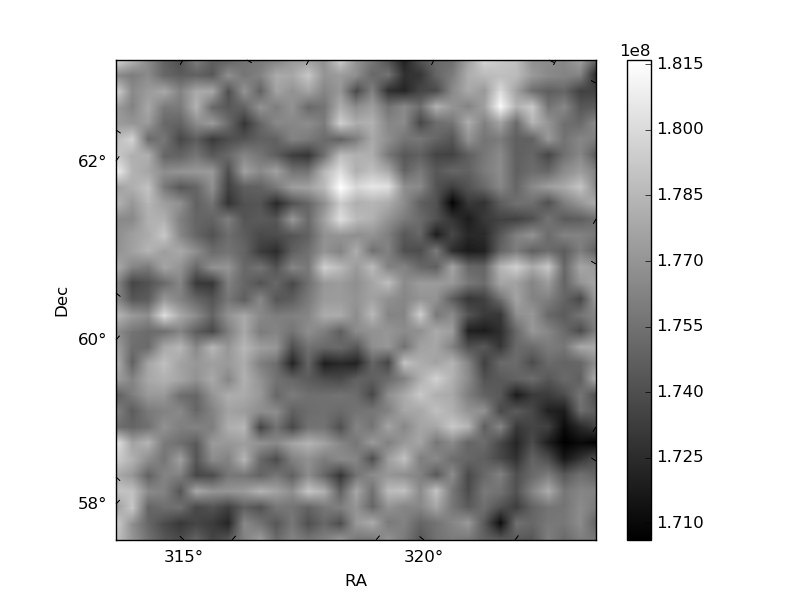
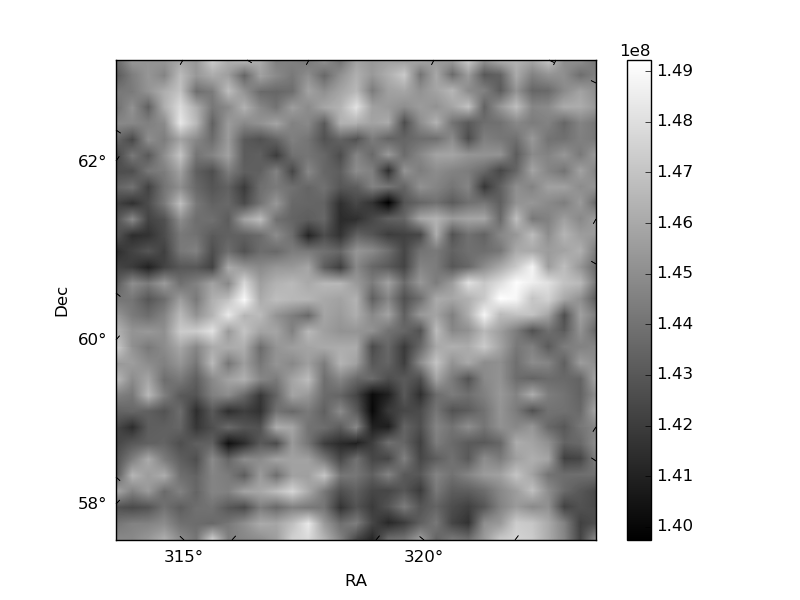
Histogram calculated using DETX and DETY for each event in the final _common_clean file
| Quadrant A | 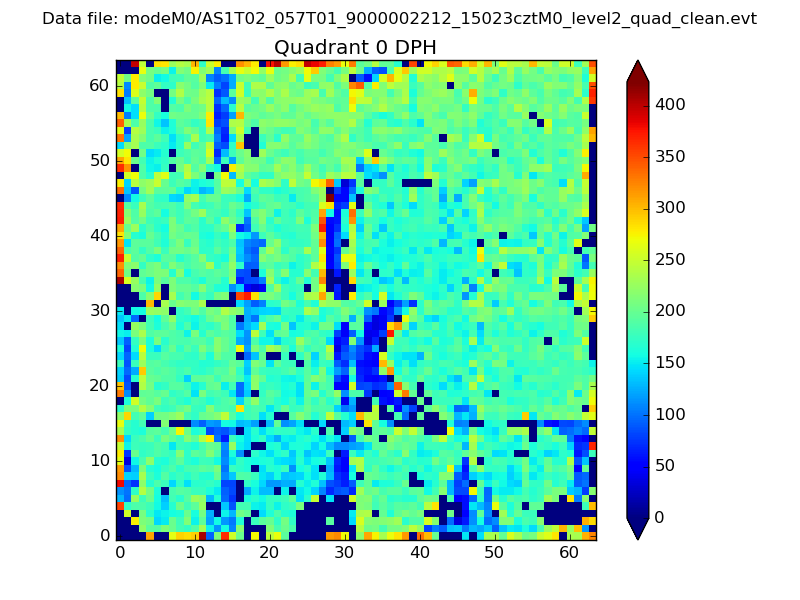 |
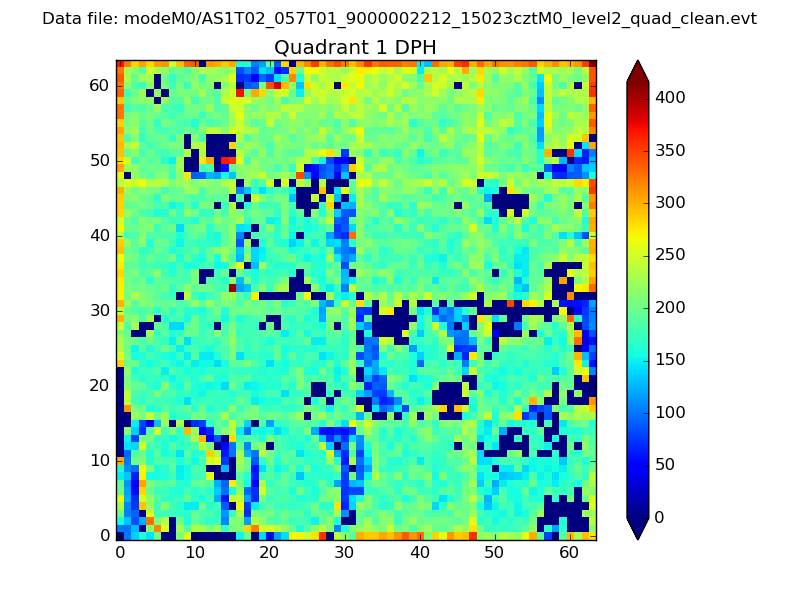 |
Quadrant B |
|---|---|---|---|
| Quadrant D | 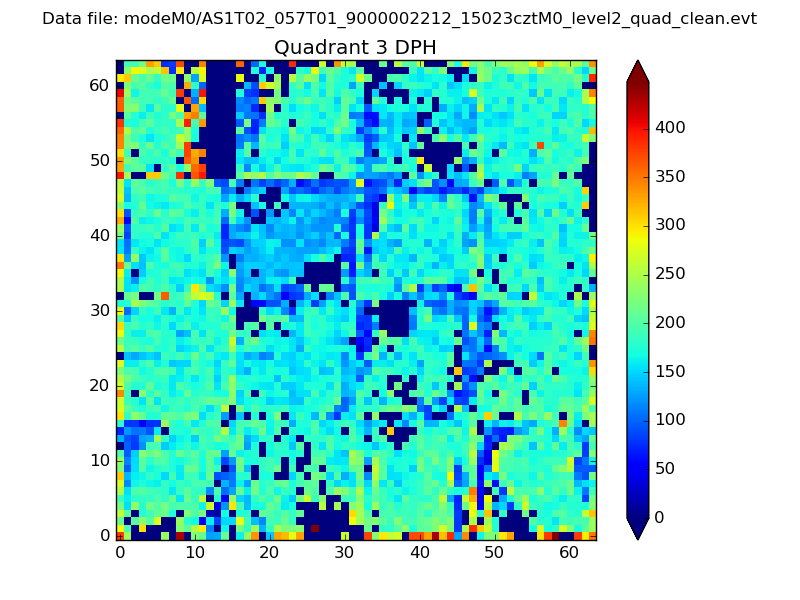 |
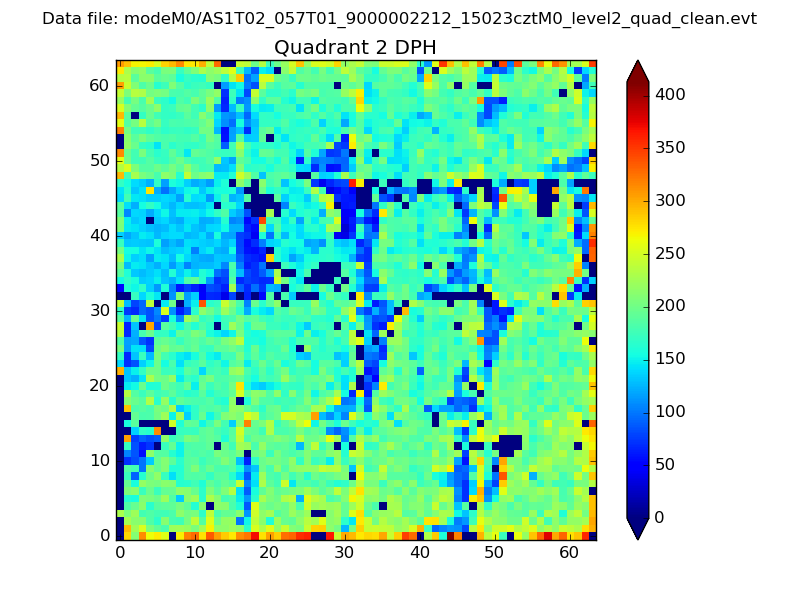 |
Quadrant C |
| Plot type | Count rate plots | Images |
|---|---|---|
| Comparison with Poisson distribution Blue bars denote a histogram of data divided into 1 sec bins. Red curve is a Poisson curve with rate = median count rate of data. |
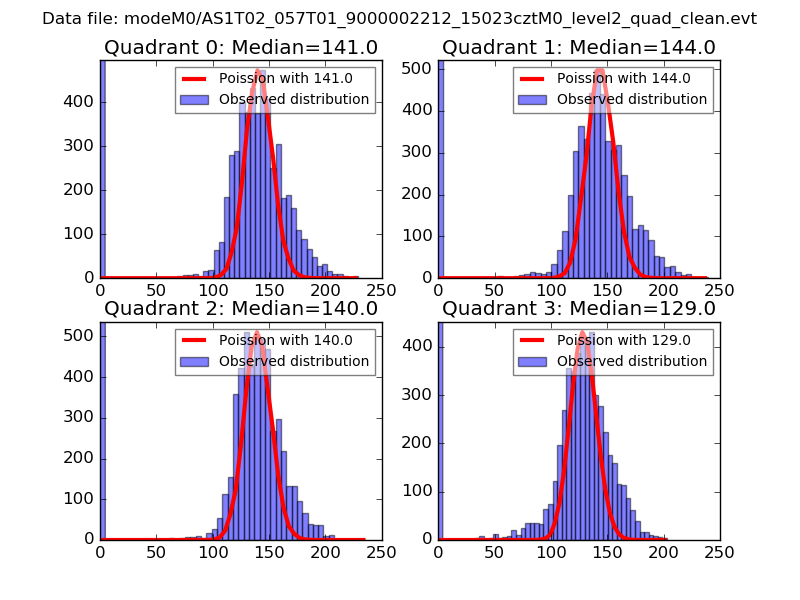 |
 |
| Quadrant-wise count rates Data is divided into 100 sec bins |
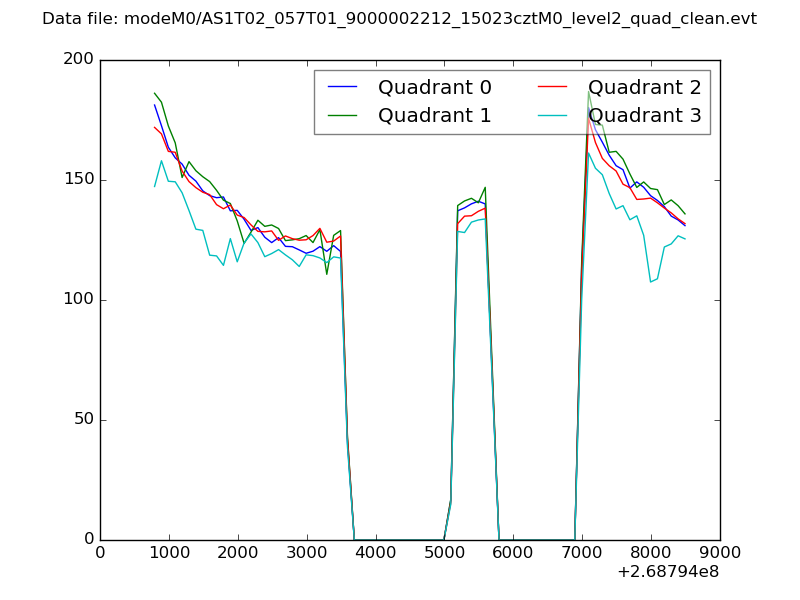 |
|
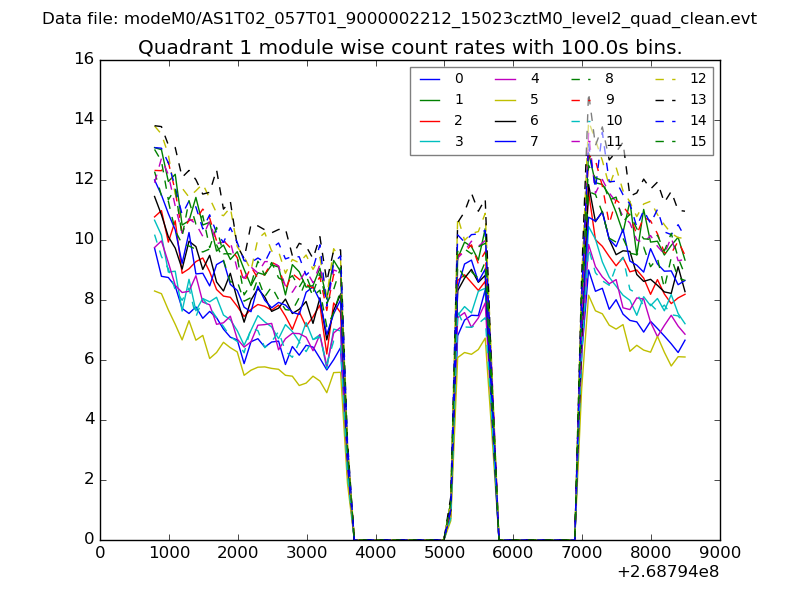
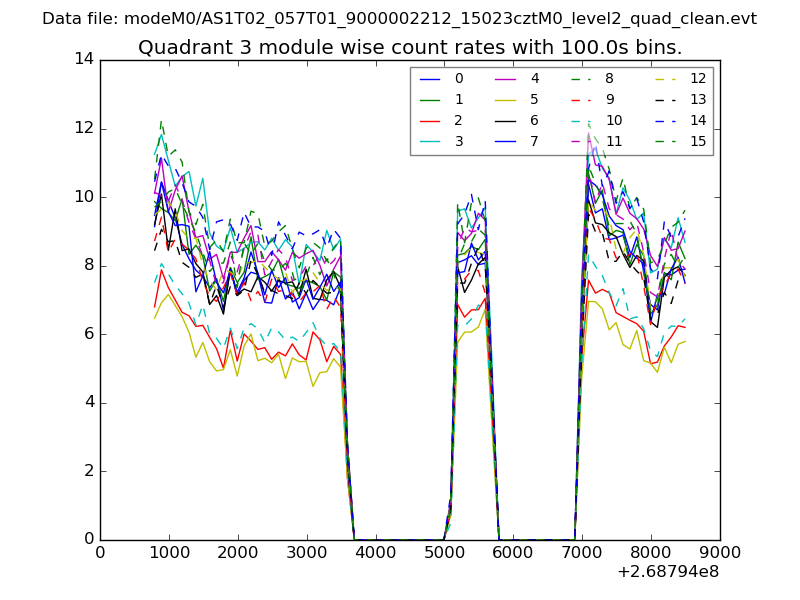
| Module-wise count rates for Quadrant A Data is divided into 100 sec bins |
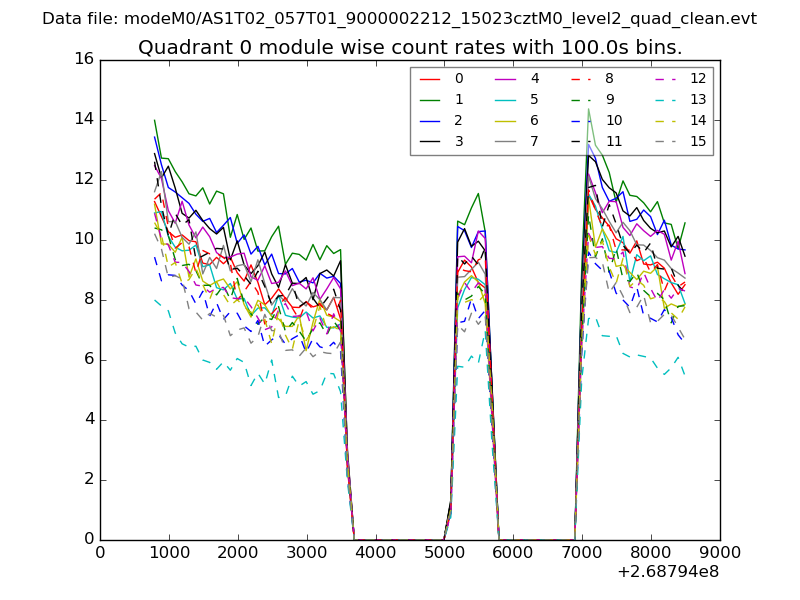 |
 |
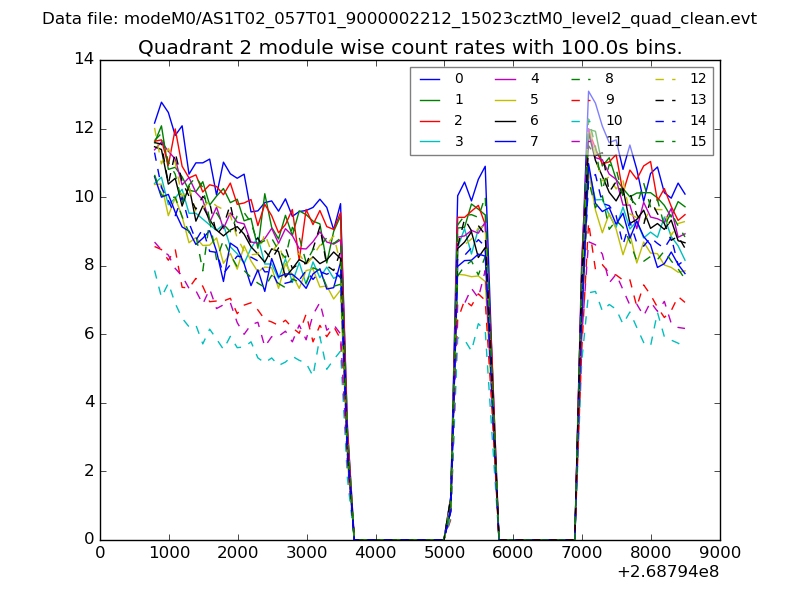
| Module-wise count rates for Quadrant B Data is divided into 100 sec bins |
 |
 |
| Module-wise count rates for Quadrant C Data is divided into 100 sec bins |
 |
 |
| Module-wise count rates for Quadrant D Data is divided into 100 sec bins |
 |
 |
| Parameter | Plot |
|---|---|
| CZT HV Monitor | 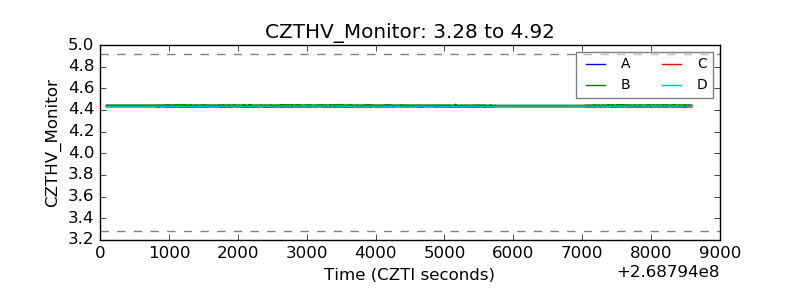 |
| D_VDD | 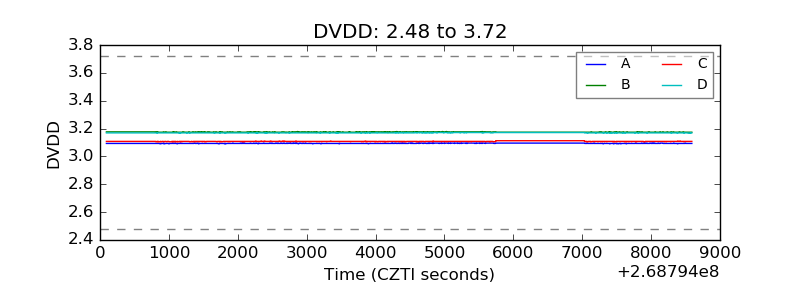 |
| Temperature 1 | 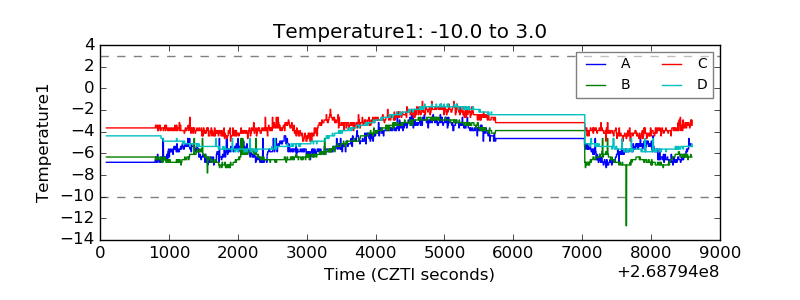 |
| Veto HV Monitor | 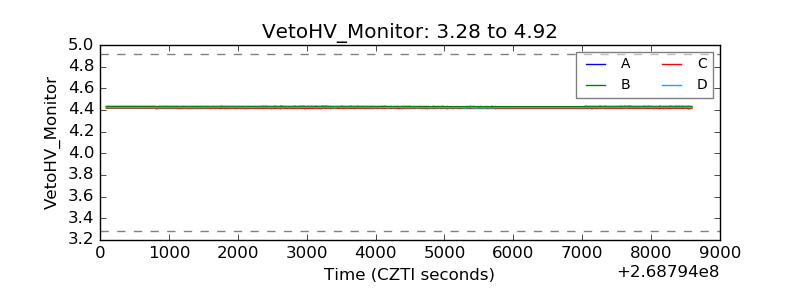 |
| Veto LLD | 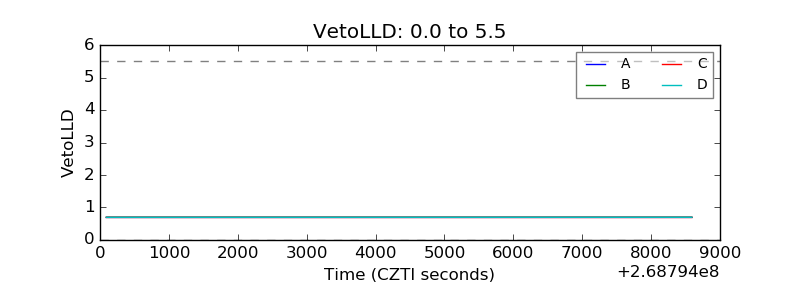 |
| Alpha Counter | 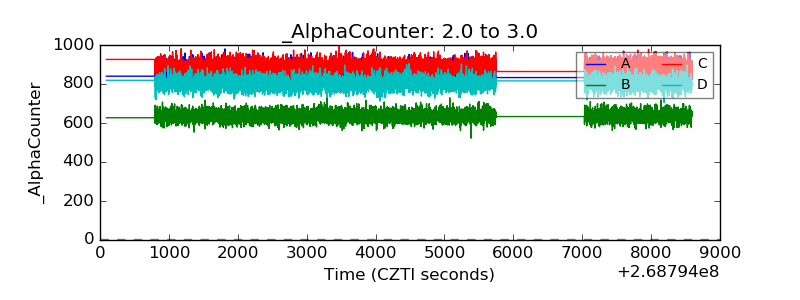 |
| _CPM_Rate | 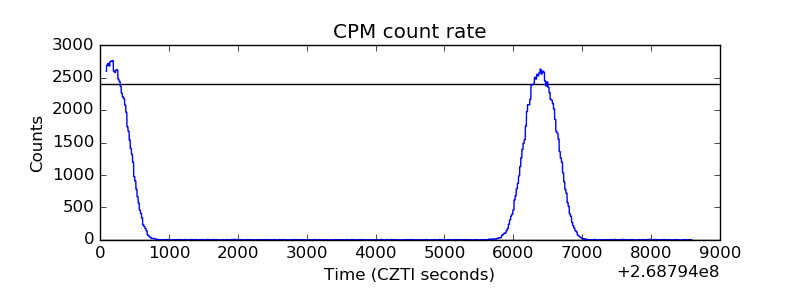 |
| CZT Counter |  |
| +2.5 Volts monitor |  |
| +5 Volts monitor |  |
| _ROLL_ROT | 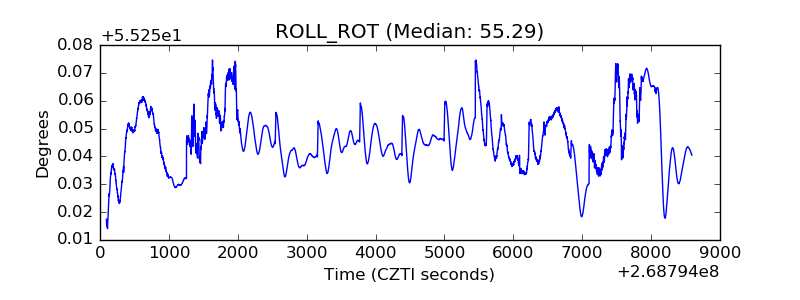 |
| _Roll_DEC | 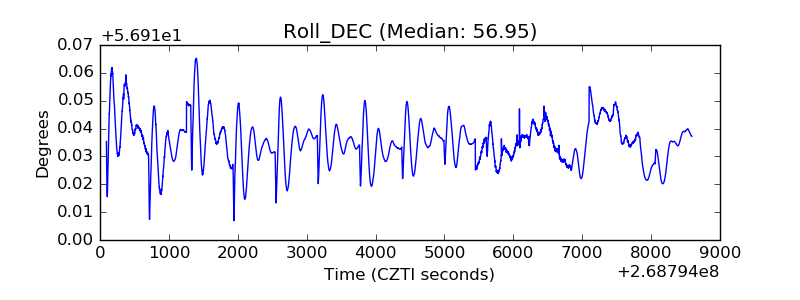 |
| _Roll_RA |  |
| Veto Counter | 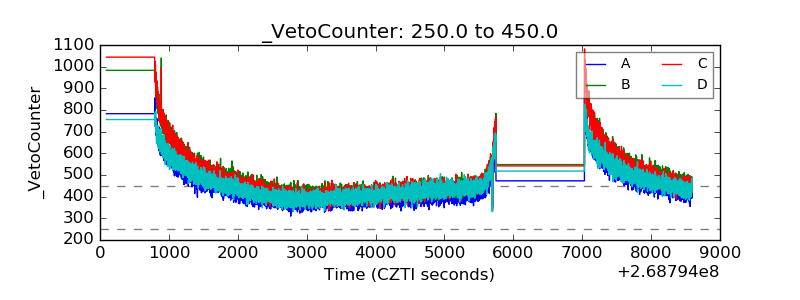 |