| Param | Original file | Final file |
|---|---|---|
| Filename | modeM0/AS1T02_057T01_9000002212_15024cztM0_level2.evt | modeM0/AS1T02_057T01_9000002212_15024cztM0_level2_quad_clean.evt |
| Size (bytes) | 492,998,400 | 106,375,680 |
| Size | 470.2 MB | 101.4 MB |
| Events in quadrant A | 3,589,003 | 704,160 |
| Events in quadrant B | 3,687,461 | 719,019 |
| Events in quadrant C | 3,141,858 | 694,922 |
| Events in quadrant D | 4,073,638 | 652,812 |
| Mode M0 | |||
|---|---|---|---|
| Quadrant | BADHDUFLAG | Total packets | Discarded packets |
| A | 0 | 14849 | 3 |
| B | 0 | 14931 | 2 |
| C | 0 | 13380 | 2 |
| D | 0 | 16568 | 2 |
| Mode SS | |||
|---|---|---|---|
| Quadrant | BADHDUFLAG | Total packets | Discarded packets |
| A | 0 | 132 | 0 |
| B | 0 | 132 | 0 |
| C | 0 | 132 | 0 |
| D | 0 | 132 | 0 |
| Mode M9 | |||
|---|---|---|---|
| Quadrant | BADHDUFLAG | Total packets | Discarded packets |
| A | 0 | 15 | 0 |
| B | 0 | 15 | 0 |
| C | 0 | 15 | 0 |
| D | 0 | 16 | 0 |
| Quadrant | Total seconds | Saturated seconds | Saturation percentage |
|---|---|---|---|
| A | 6458 | 52 | 0.805203% |
| B | 6458 | 189 | 2.926603% |
| C | 6458 | 7 | 0.108393% |
| D | 6458 | 185 | 2.864664% |
Noise dominated data is calculated using 1-second bins in cleaned event files. If a bin has >2000 counts, and if more than 50% of those come from <1% of pixels, then it is considered to be noise-dominated and hence unusable.
| Quadrant | # 1 sec bins | Bins with >0 counts | Bins with >2000 counts | High rate bins dominated by noise | Noise dominated (total time) | Noise dominated (detector-on time) | Marked lightcurve |
|---|---|---|---|---|---|---|---|
| A | 7779 | 6460 | 1 | 1 | 0.01% | 0.02% | 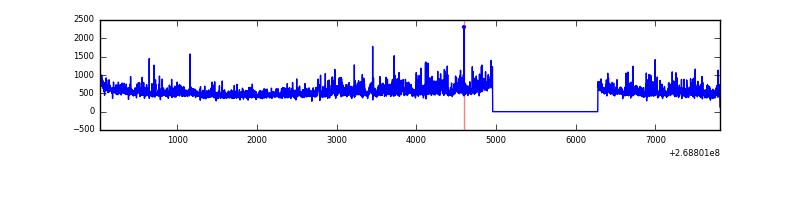 |
| B | 7779 | 6460 | 105 | 105 | 1.35% | 1.63% | 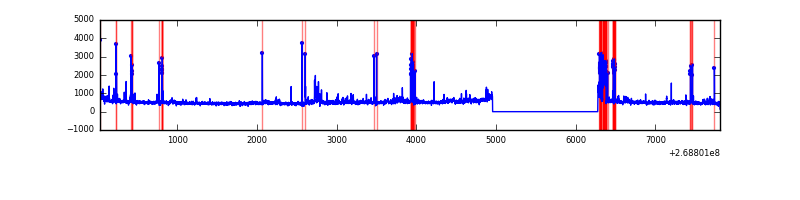 |
| C | 7779 | 6460 | 0 | 0 | 0.00% | 0.00% | 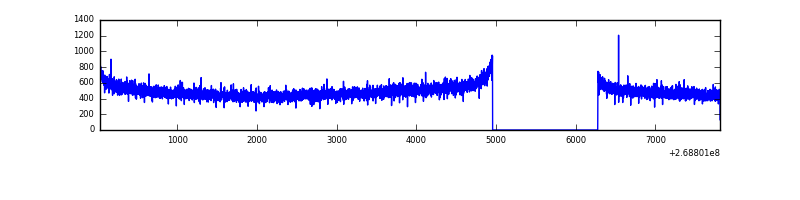 |
| D | 7779 | 6460 | 240 | 240 | 3.09% | 3.72% | 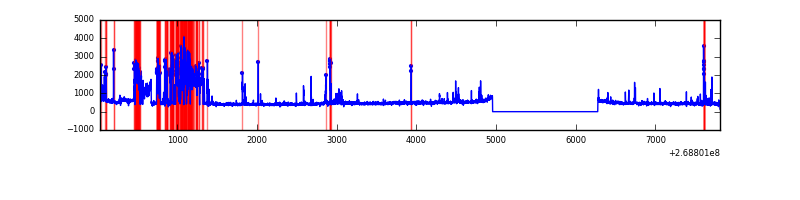 |
Top three noisy pixels from each quadrant. If the there are fewer than three noisy pixels in the level2.evt file, extra rows are filled as -1
| Pixel properties | Quadrant properties | ||||||
|---|---|---|---|---|---|---|---|
| Quadrant | DetID | PixID | Counts | Sigma | Mean | Median | Sigma |
| A | 1 | 162 | 191917 | 1195.23 | 800 | 786 | 159.9 |
| A | 1 | 178 | 105520 | 654.95 | 800 | 786 | 159.9 |
| A | 1 | 161 | 89426 | 554.31 | 800 | 786 | 159.9 |
| B | 3 | 64 | 435628 | 2978.92 | 794 | 779 | 146.0 |
| B | 0 | 229 | 66128 | 447.67 | 794 | 779 | 146.0 |
| B | 3 | 209 | 39241 | 263.48 | 794 | 779 | 146.0 |
| C | 3 | 233 | 148957 | 844.35 | 767 | 771 | 175.5 |
| C | 13 | 61 | 5632 | 27.7 | 767 | 771 | 175.5 |
| C | 3 | 232 | 2121 | 7.69 | 767 | 771 | 175.5 |
| D | 7 | 223 | 750875 | 4168.09 | 758 | 737 | 180.0 |
| D | 2 | 136 | 234076 | 1296.53 | 758 | 737 | 180.0 |
| D | 10 | 70 | 140508 | 776.63 | 758 | 737 | 180.0 |
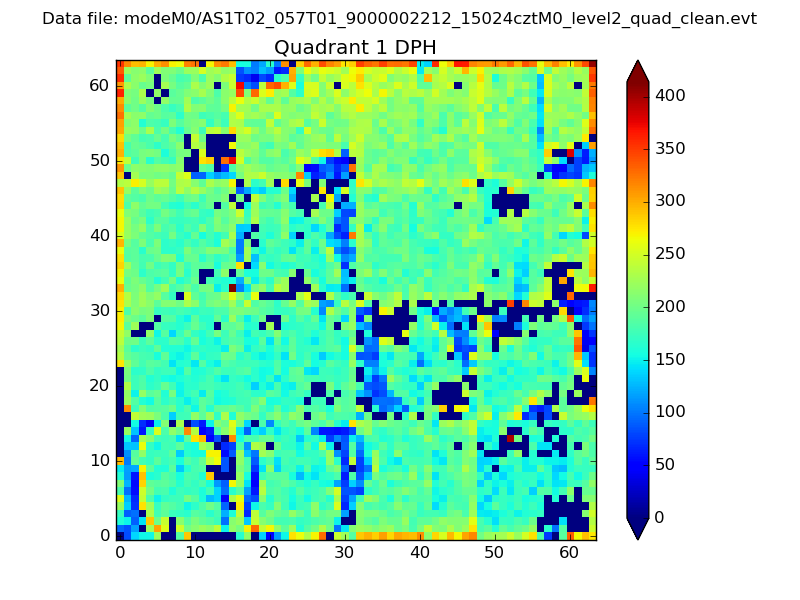
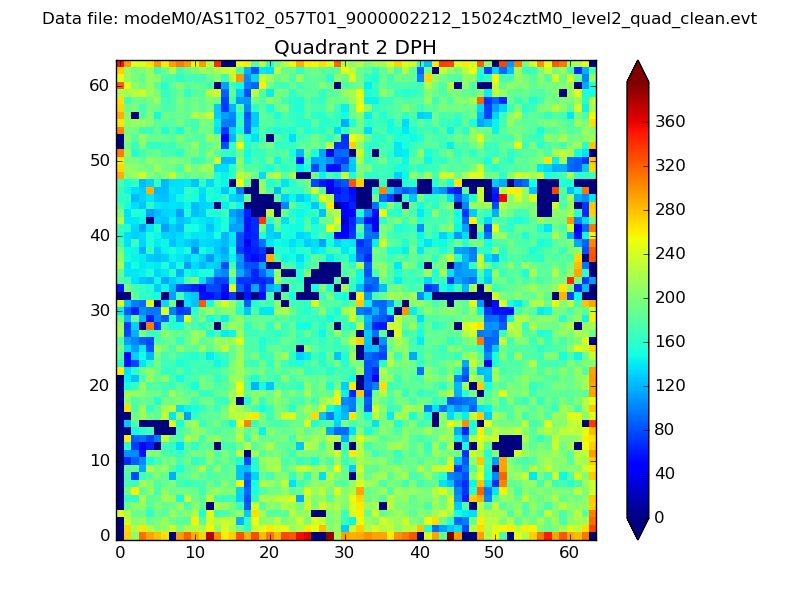
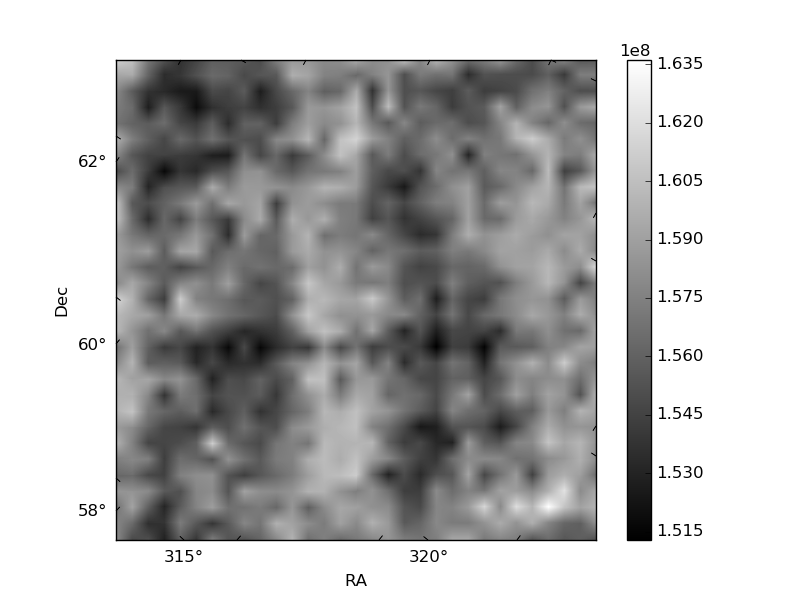
Histogram calculated using DETX and DETY for each event in the final _common_clean file
| Quadrant A |  |
 |
Quadrant B |
|---|---|---|---|
| Quadrant D |  |
 |
Quadrant C |
| Plot type | Count rate plots | Images |
|---|---|---|
| Comparison with Poisson distribution Blue bars denote a histogram of data divided into 1 sec bins. Red curve is a Poisson curve with rate = median count rate of data. |
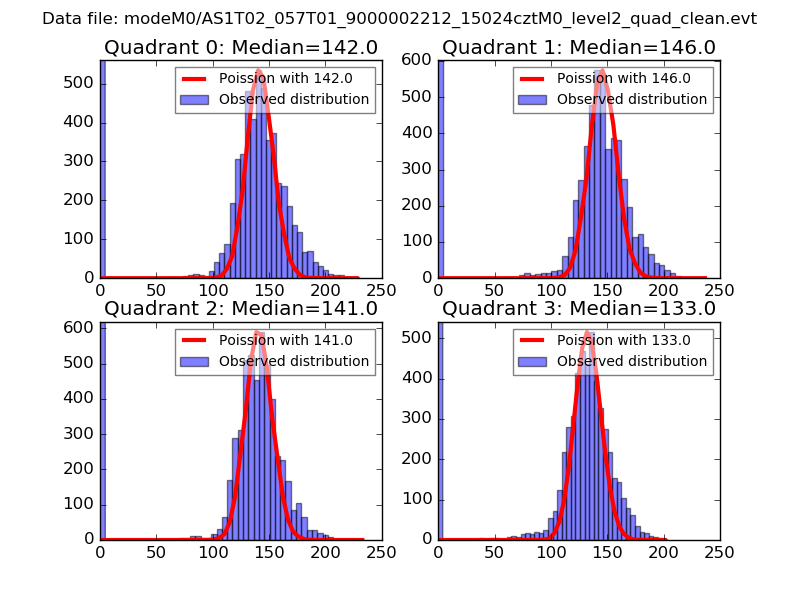 |
 |
| Quadrant-wise count rates Data is divided into 100 sec bins |
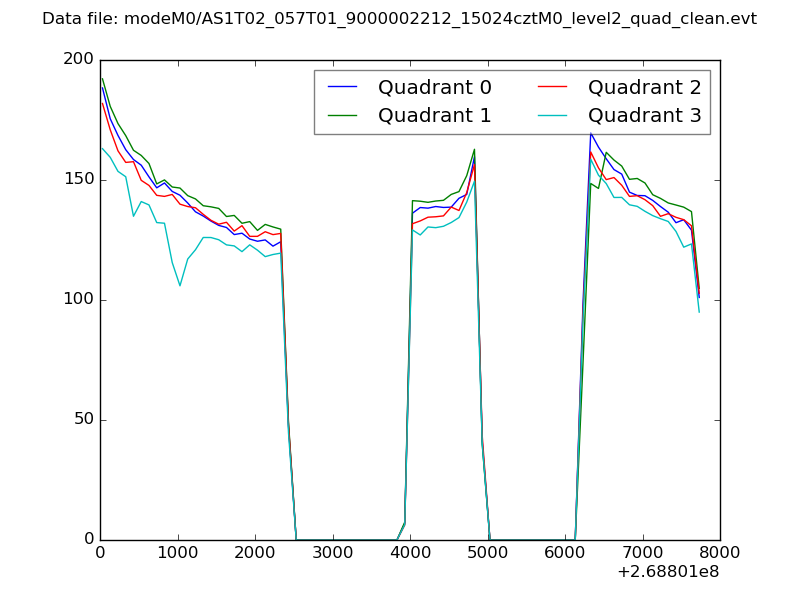 |
|
| Module-wise count rates for Quadrant A Data is divided into 100 sec bins |
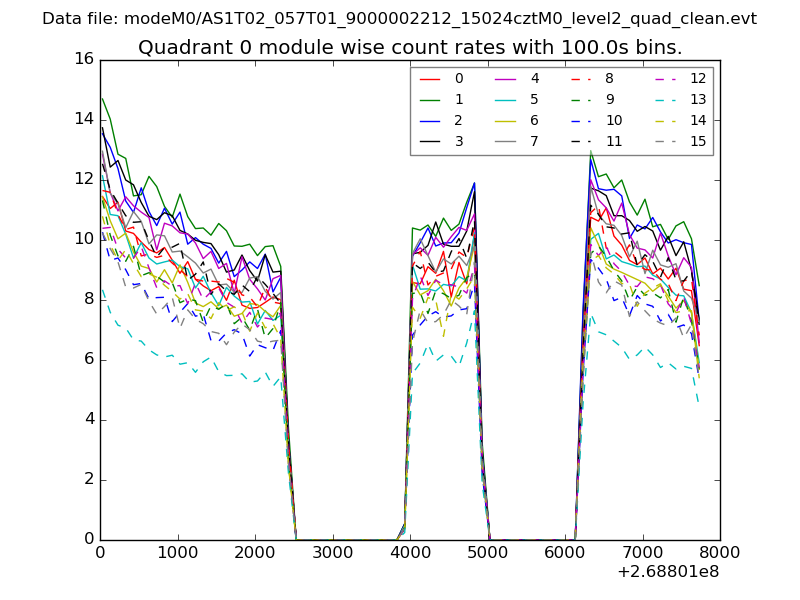 |
 |
| Module-wise count rates for Quadrant B Data is divided into 100 sec bins |
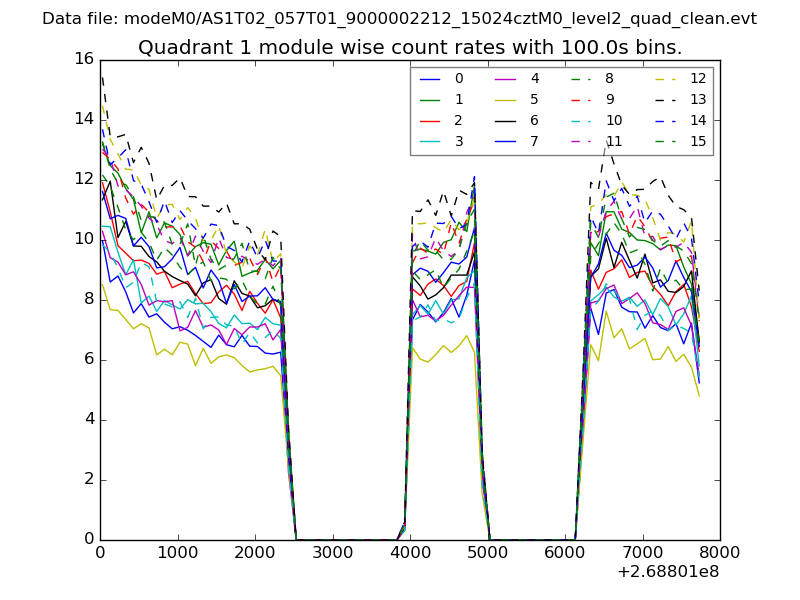 |
 |
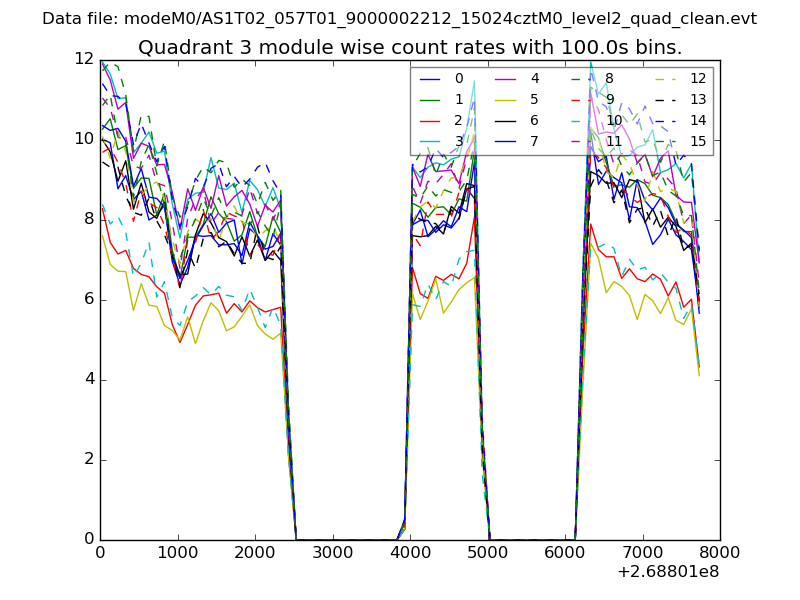
| Module-wise count rates for Quadrant C Data is divided into 100 sec bins |
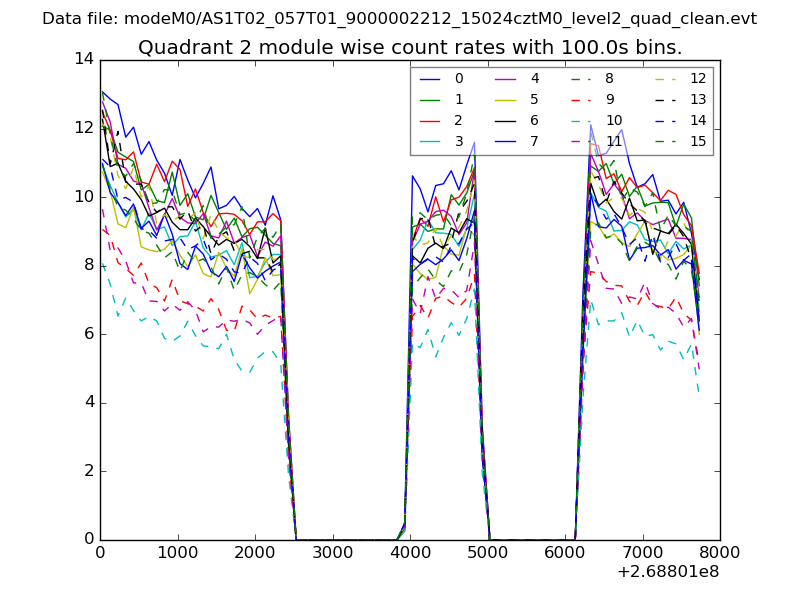 |
 |
| Module-wise count rates for Quadrant D Data is divided into 100 sec bins |
 |
 |
| Parameter | Plot |
|---|---|
| CZT HV Monitor | 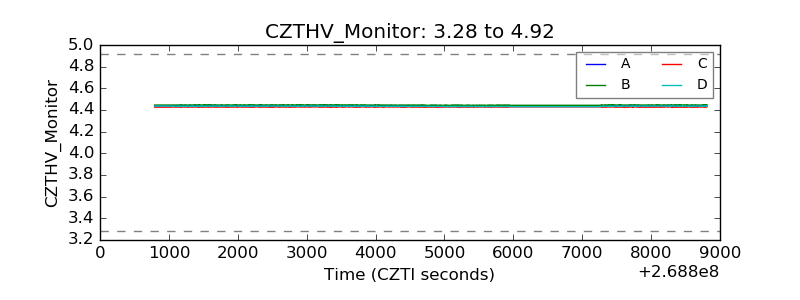 |
| D_VDD | 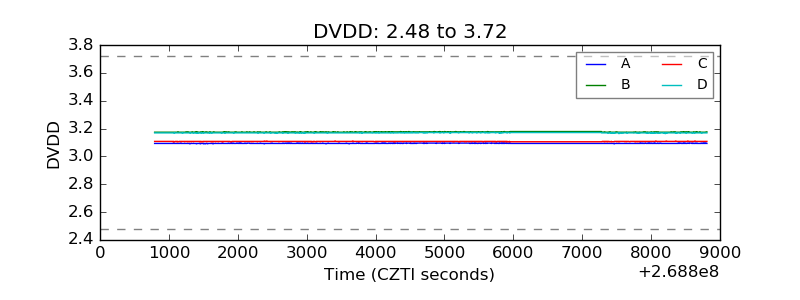 |
| Temperature 1 | 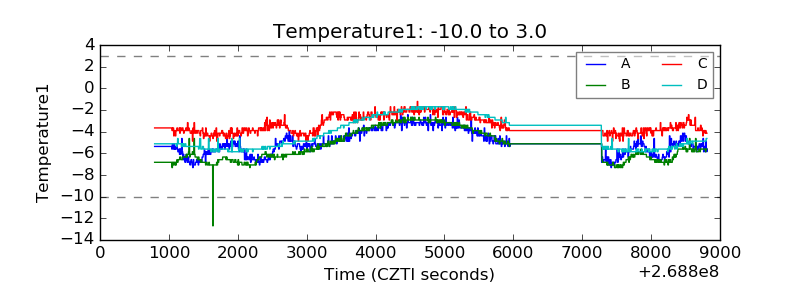 |
| Veto HV Monitor | 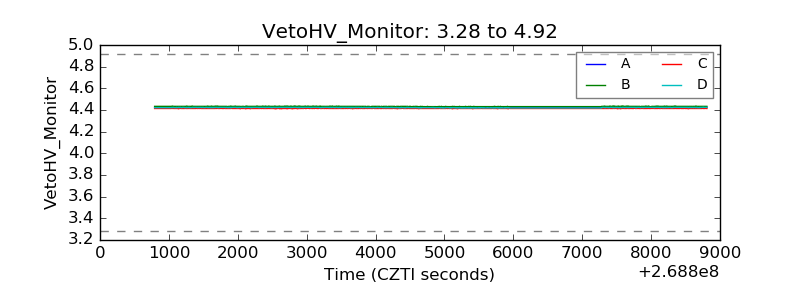 |
| Veto LLD | 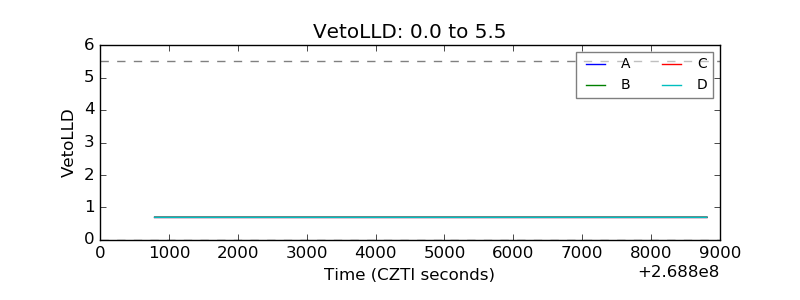 |
| Alpha Counter | 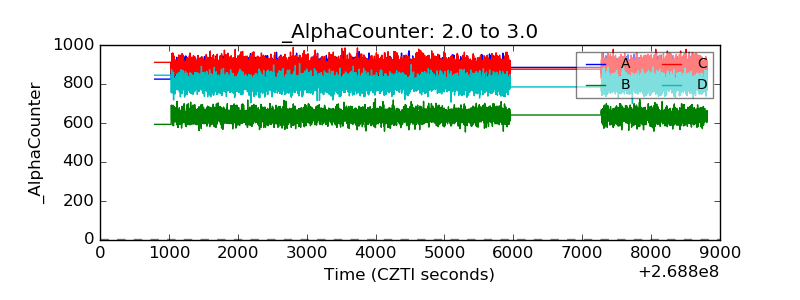 |
| _CPM_Rate | 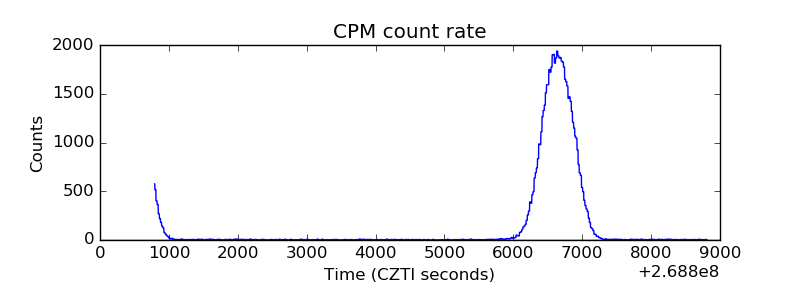 |
| CZT Counter | 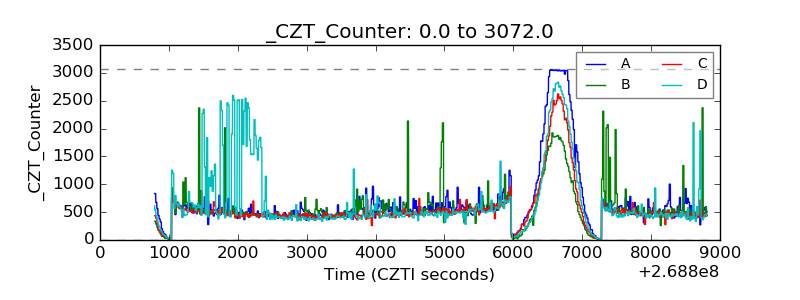 |
| +2.5 Volts monitor |  |
| +5 Volts monitor |  |
| _ROLL_ROT | 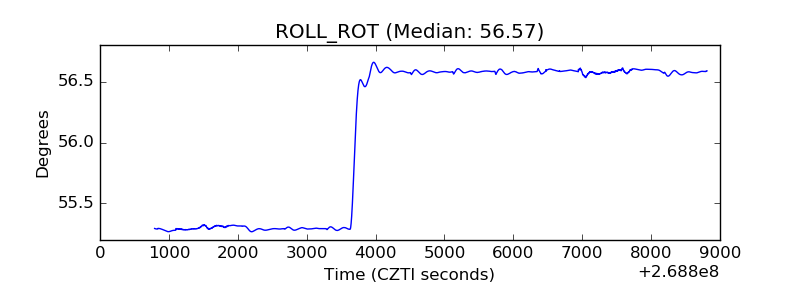 |
| _Roll_DEC | 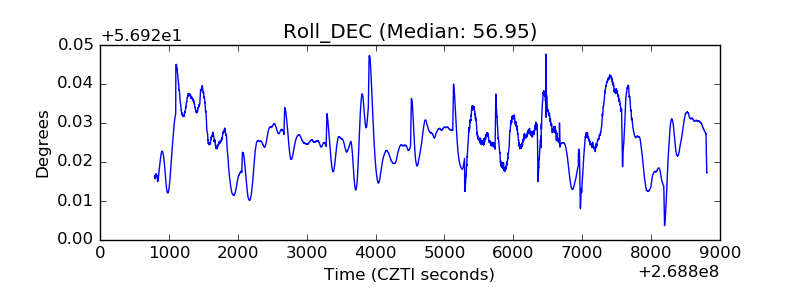 |
| _Roll_RA | 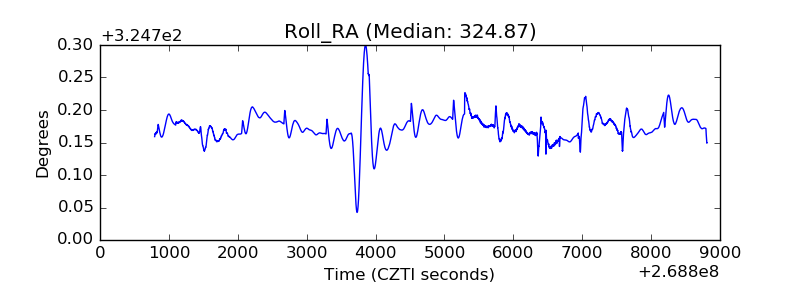 |
| Veto Counter | 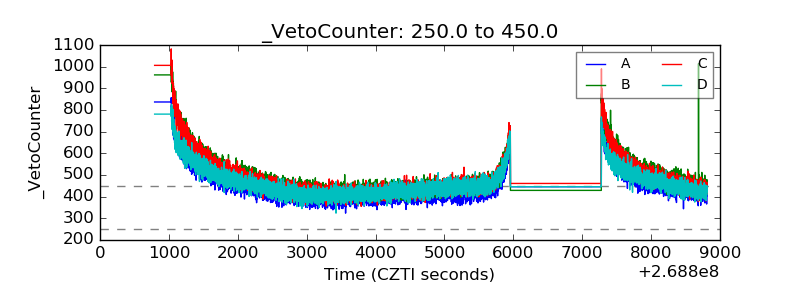 |