| Param | Original file | Final file |
|---|---|---|
| Filename | modeM0/AS1T02_057T01_9000002212_15026cztM0_level2.evt | modeM0/AS1T02_057T01_9000002212_15026cztM0_level2_quad_clean.evt |
| Size (bytes) | 754,827,840 | 147,726,720 |
| Size | 719.9 MB | 140.9 MB |
| Events in quadrant A | 5,888,446 | 952,314 |
| Events in quadrant B | 6,113,429 | 956,953 |
| Events in quadrant C | 5,081,662 | 939,883 |
| Events in quadrant D | 5,069,162 | 901,444 |
| Mode M0 | |||
|---|---|---|---|
| Quadrant | BADHDUFLAG | Total packets | Discarded packets |
| A | 0 | 24290 | 3 |
| B | 0 | 24809 | 4 |
| C | 0 | 21609 | 2 |
| D | 0 | 22311 | 2 |
| Mode SS | |||
|---|---|---|---|
| Quadrant | BADHDUFLAG | Total packets | Discarded packets |
| A | 0 | 212 | 0 |
| B | 0 | 212 | 0 |
| C | 0 | 212 | 0 |
| D | 0 | 212 | 0 |
| Mode M9 | |||
|---|---|---|---|
| Quadrant | BADHDUFLAG | Total packets | Discarded packets |
| A | 0 | 23 | 0 |
| B | 0 | 23 | 0 |
| C | 0 | 23 | 0 |
| D | 0 | 23 | 0 |
| Quadrant | Total seconds | Saturated seconds | Saturation percentage |
|---|---|---|---|
| A | 10447 | 191 | 1.828276% |
| B | 10446 | 368 | 3.522880% |
| C | 10447 | 80 | 0.765770% |
| D | 10447 | 142 | 1.359242% |
Noise dominated data is calculated using 1-second bins in cleaned event files. If a bin has >2000 counts, and if more than 50% of those come from <1% of pixels, then it is considered to be noise-dominated and hence unusable.
| Quadrant | # 1 sec bins | Bins with >0 counts | Bins with >2000 counts | High rate bins dominated by noise | Noise dominated (total time) | Noise dominated (detector-on time) | Marked lightcurve |
|---|---|---|---|---|---|---|---|
| A | 12728 | 10449 | 3 | 3 | 0.02% | 0.03% | 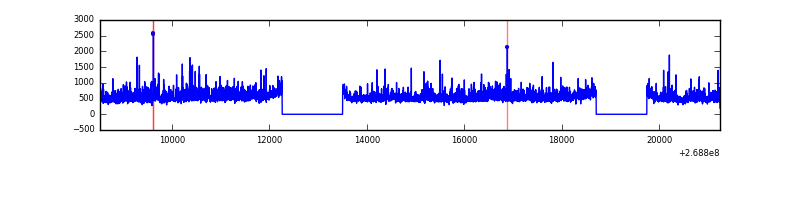 |
| B | 12728 | 10449 | 125 | 125 | 0.98% | 1.20% | 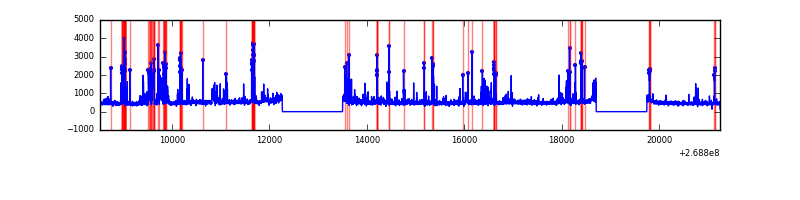 |
| C | 12728 | 10450 | 1 | 1 | 0.01% | 0.01% | 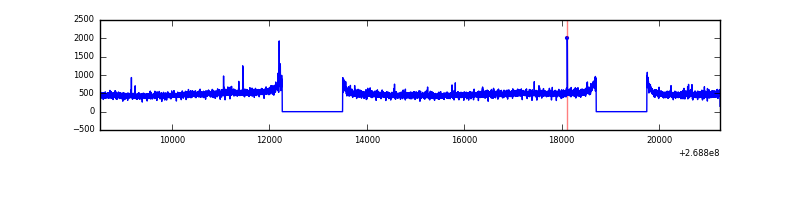 |
| D | 12728 | 10450 | 47 | 47 | 0.37% | 0.45% | 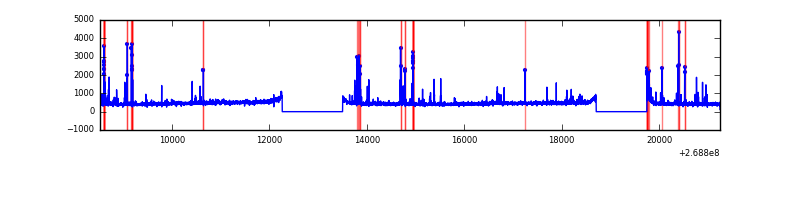 |
Top three noisy pixels from each quadrant. If the there are fewer than three noisy pixels in the level2.evt file, extra rows are filled as -1
| Pixel properties | Quadrant properties | ||||||
|---|---|---|---|---|---|---|---|
| Quadrant | DetID | PixID | Counts | Sigma | Mean | Median | Sigma |
| A | 1 | 162 | 349347 | 1367.96 | 1269 | 1243 | 254.5 |
| A | 1 | 178 | 188484 | 735.81 | 1269 | 1243 | 254.5 |
| A | 1 | 161 | 162806 | 634.9 | 1269 | 1243 | 254.5 |
| B | 10 | 16 | 454056 | 1931.14 | 1255 | 1223 | 234.5 |
| B | 3 | 64 | 370637 | 1575.39 | 1255 | 1223 | 234.5 |
| B | 0 | 229 | 272076 | 1155.07 | 1255 | 1223 | 234.5 |
| C | 3 | 233 | 314488 | 1130.49 | 1214 | 1217 | 277.1 |
| C | 10 | 22 | 30987 | 107.43 | 1214 | 1217 | 277.1 |
| C | 13 | 61 | 8719 | 27.07 | 1214 | 1217 | 277.1 |
| D | 10 | 70 | 206530 | 701.38 | 1218 | 1182 | 292.8 |
| D | 13 | 249 | 83111 | 279.83 | 1218 | 1182 | 292.8 |
| D | 8 | 195 | 66198 | 222.07 | 1218 | 1182 | 292.8 |
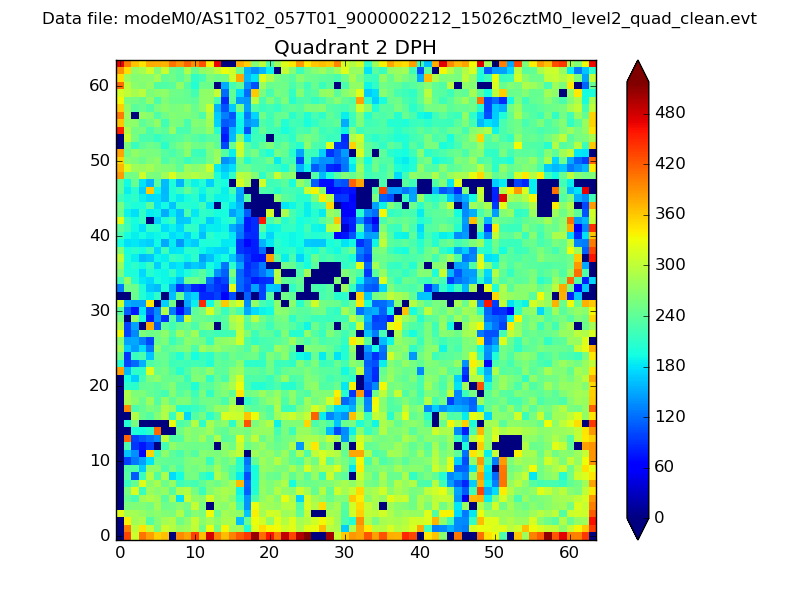
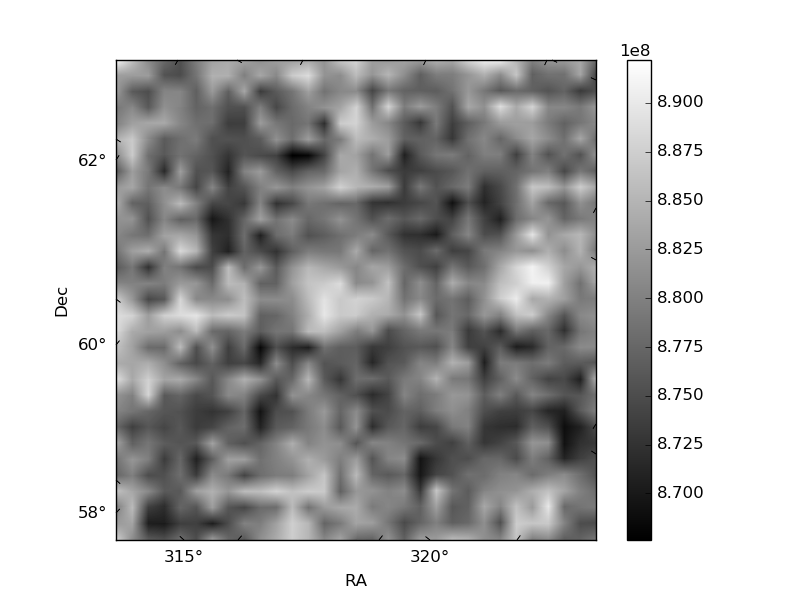
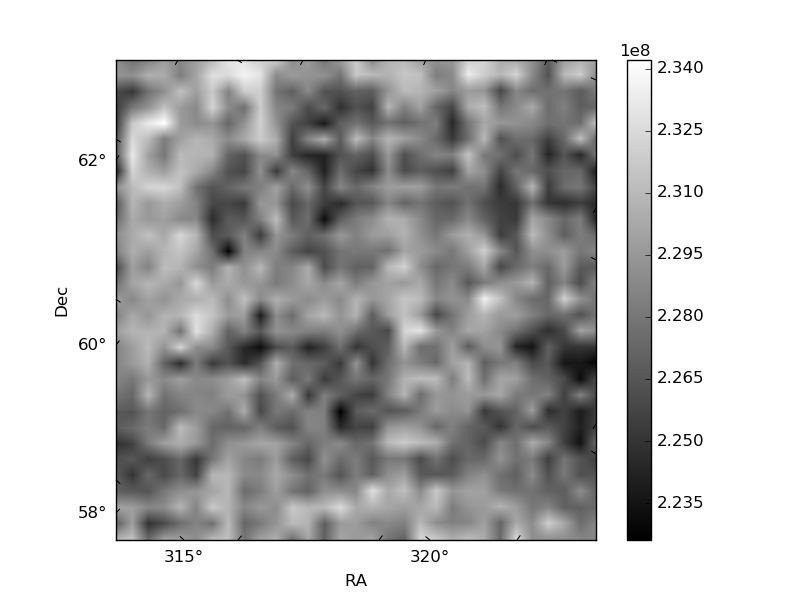
Histogram calculated using DETX and DETY for each event in the final _common_clean file
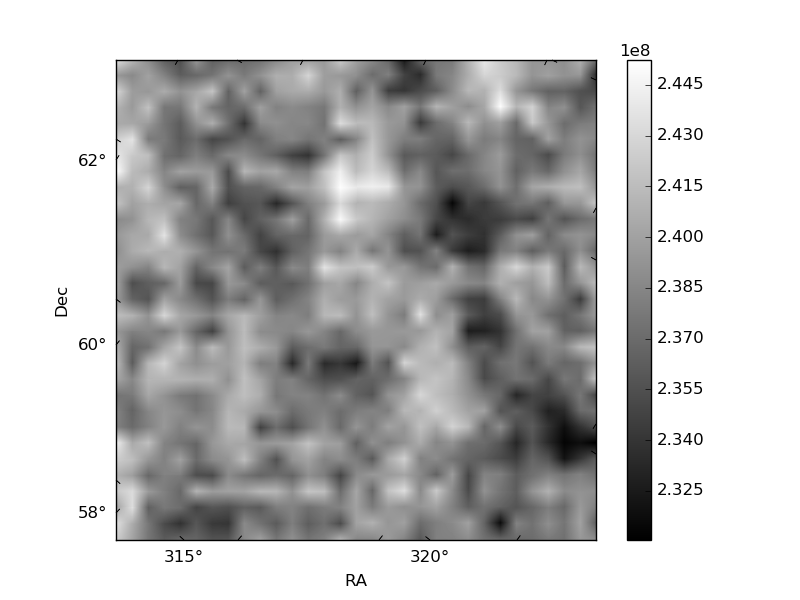
| Quadrant A | 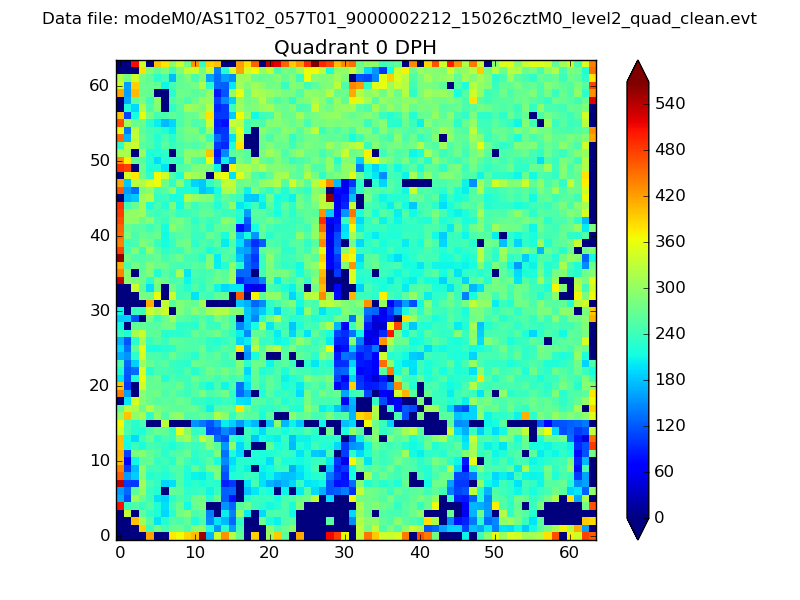 |
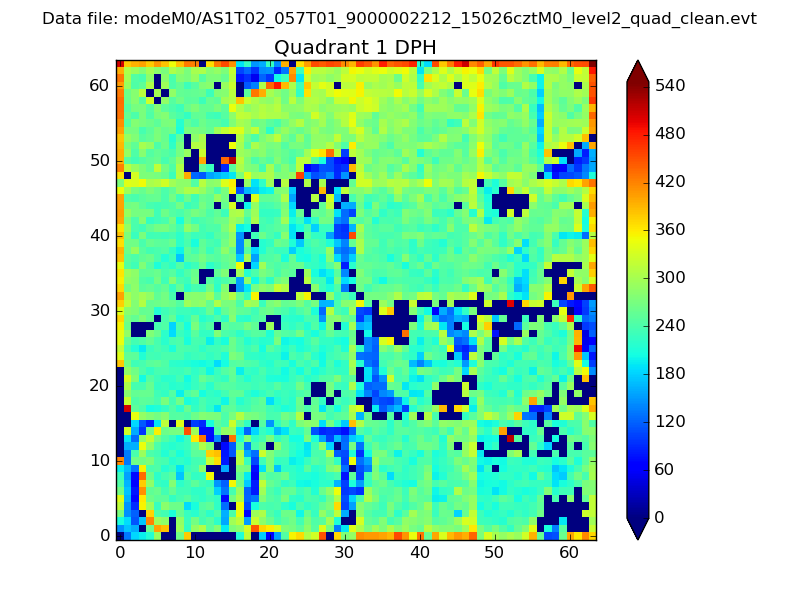 |
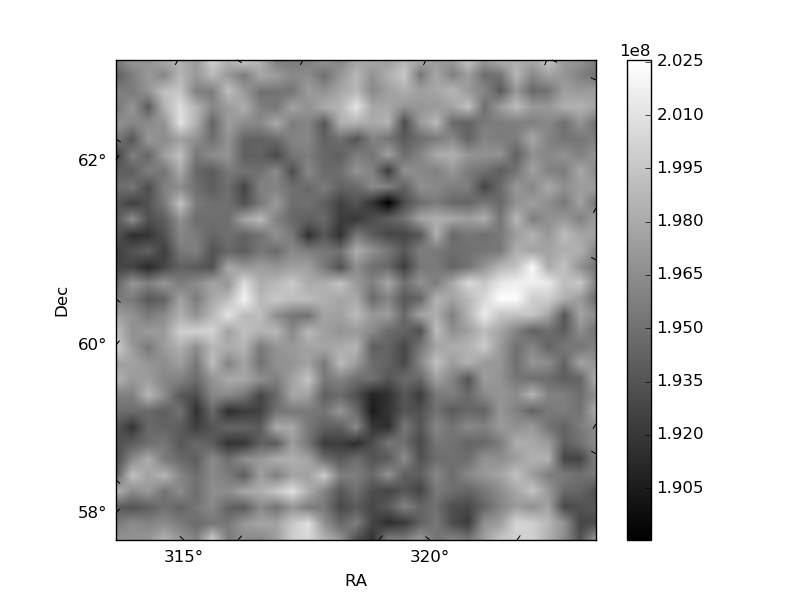
Quadrant B |
|---|---|---|---|
| Quadrant D | 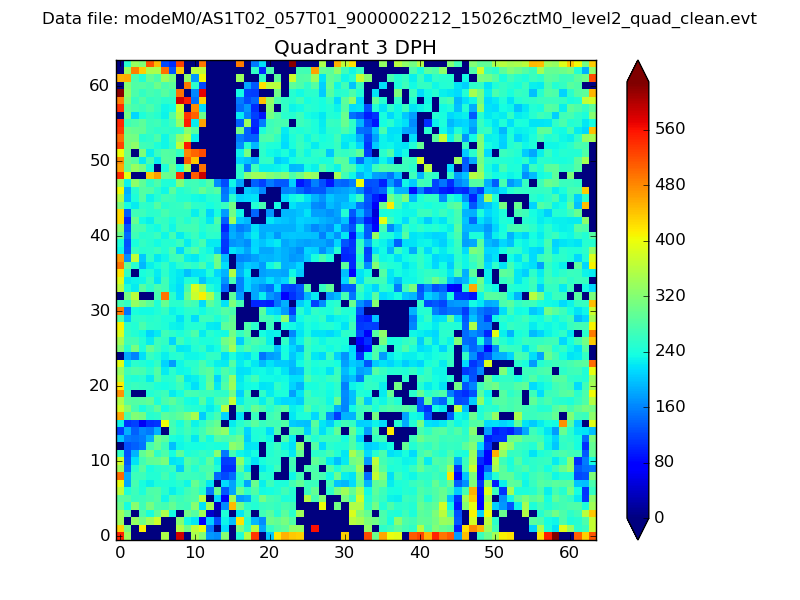 |
 |
Quadrant C |
| Plot type | Count rate plots | Images |
|---|---|---|
| Comparison with Poisson distribution Blue bars denote a histogram of data divided into 1 sec bins. Red curve is a Poisson curve with rate = median count rate of data. |
 |
 |
| Quadrant-wise count rates Data is divided into 100 sec bins |
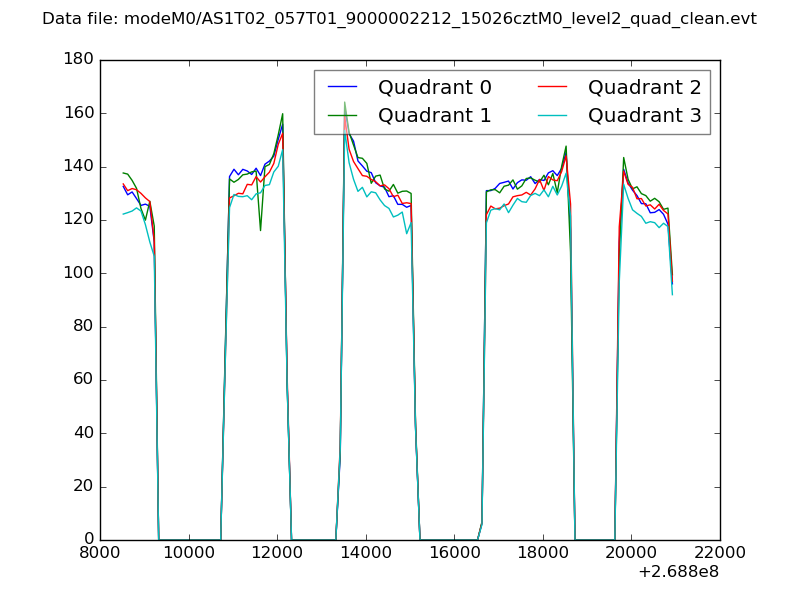 |
|
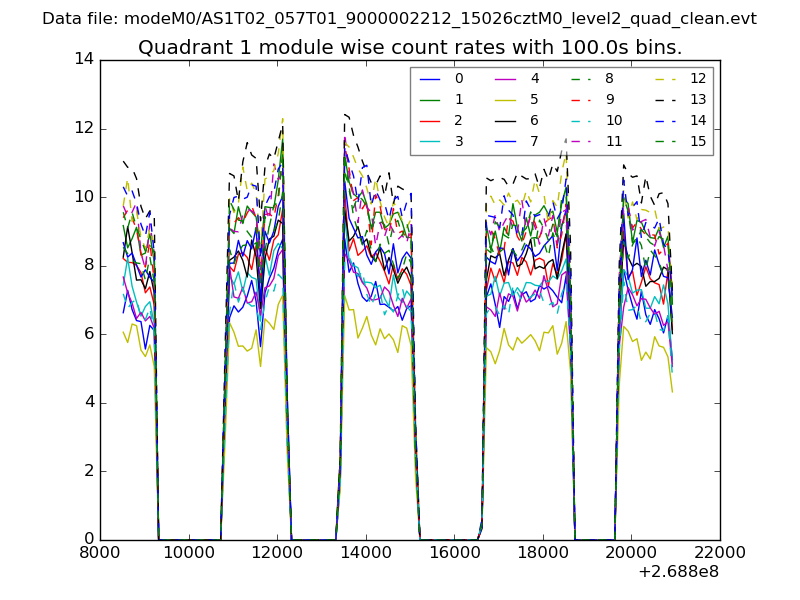
| Module-wise count rates for Quadrant A Data is divided into 100 sec bins |
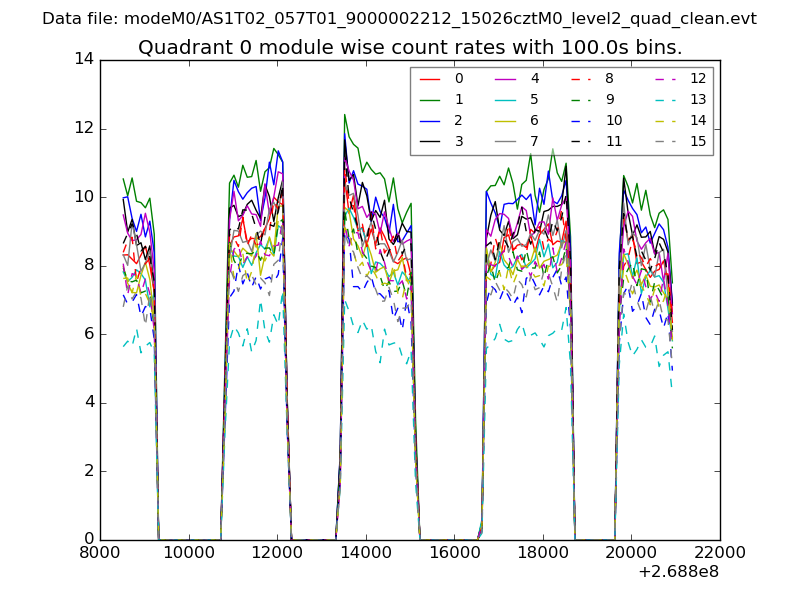 |
 |
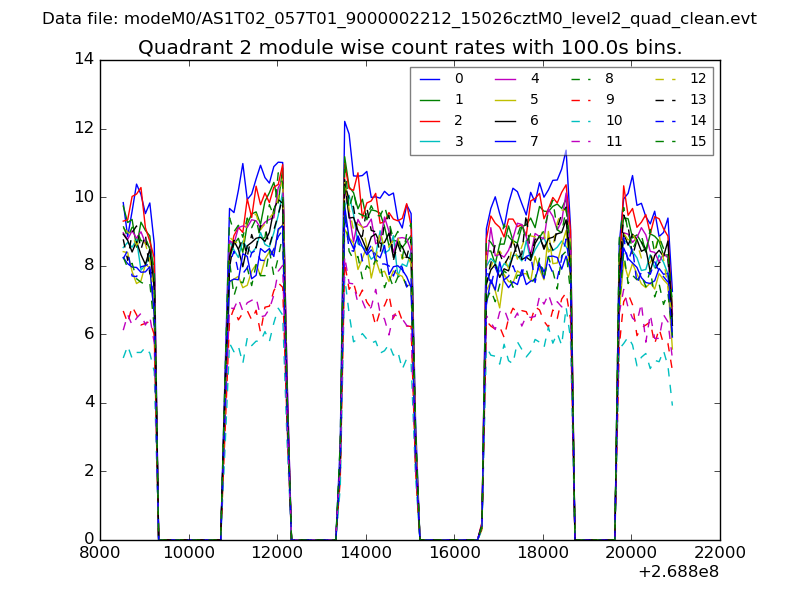
| Module-wise count rates for Quadrant B Data is divided into 100 sec bins |
 |
 |
| Module-wise count rates for Quadrant C Data is divided into 100 sec bins |
 |
 |
| Module-wise count rates for Quadrant D Data is divided into 100 sec bins |
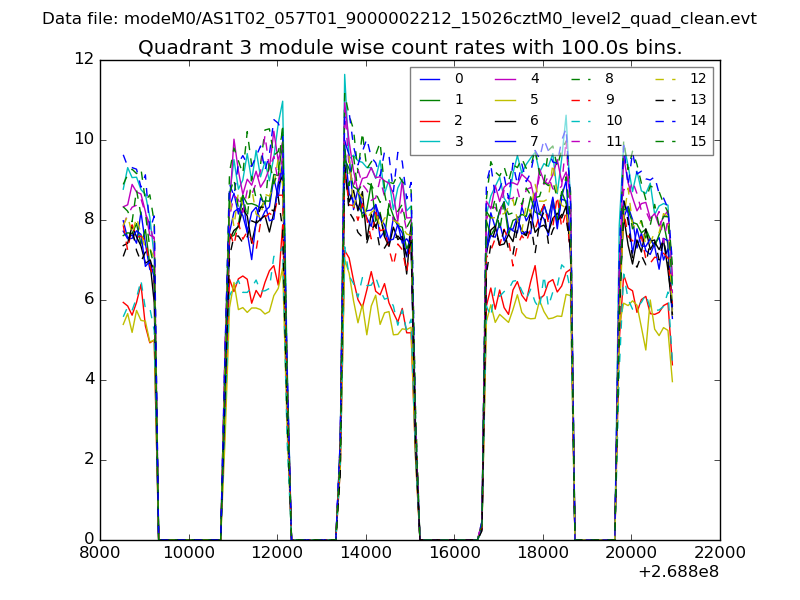 |
 |
| Parameter | Plot |
|---|---|
| CZT HV Monitor | 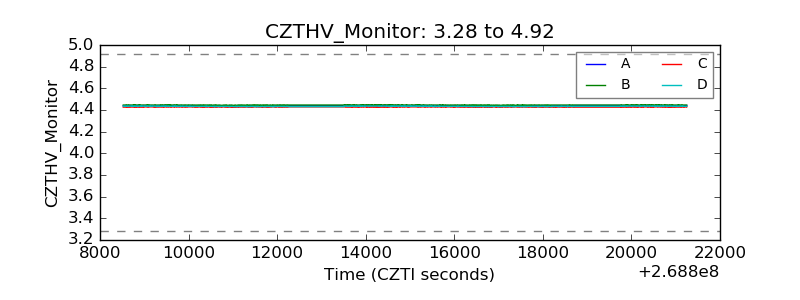 |
| D_VDD | 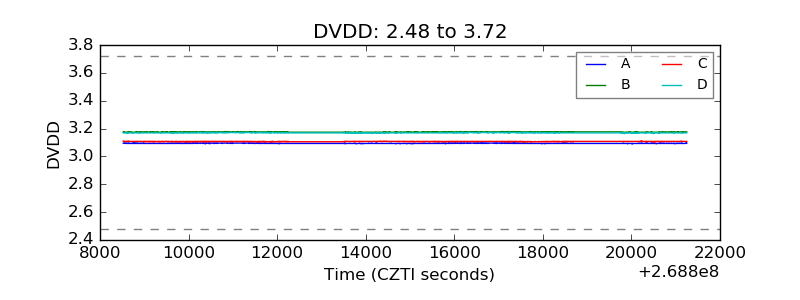 |
| Temperature 1 | 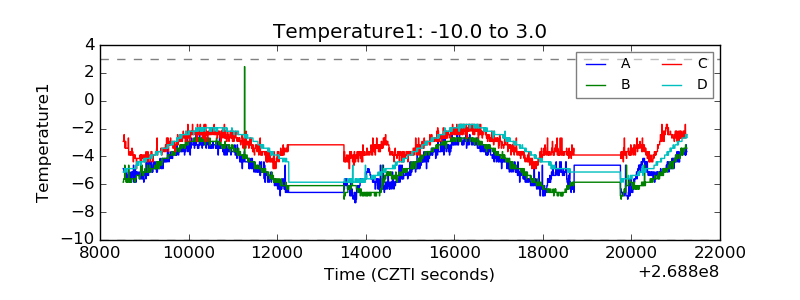 |
| Veto HV Monitor | 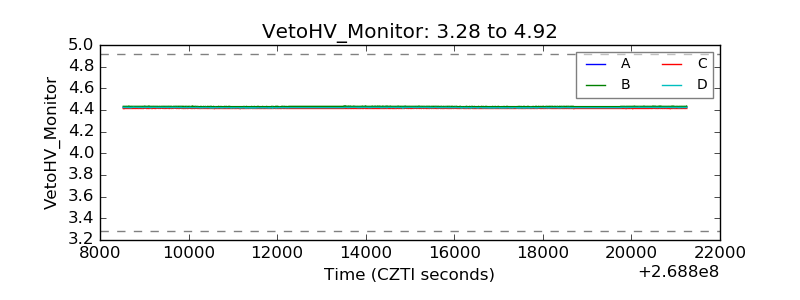 |
| Veto LLD | 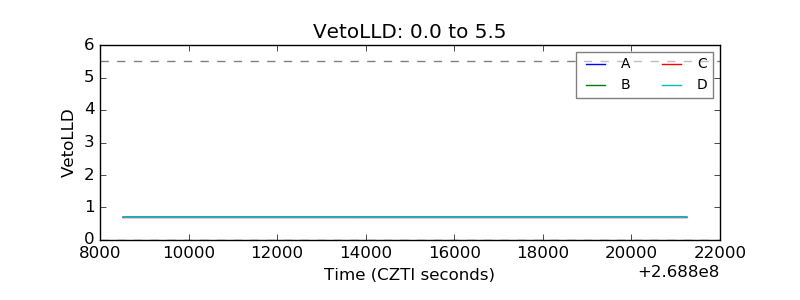 |
| Alpha Counter | 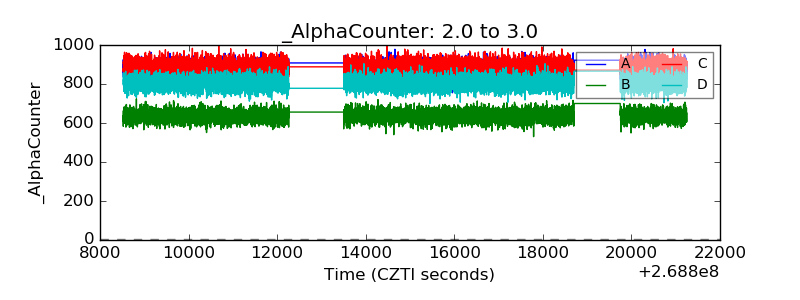 |
| _CPM_Rate | 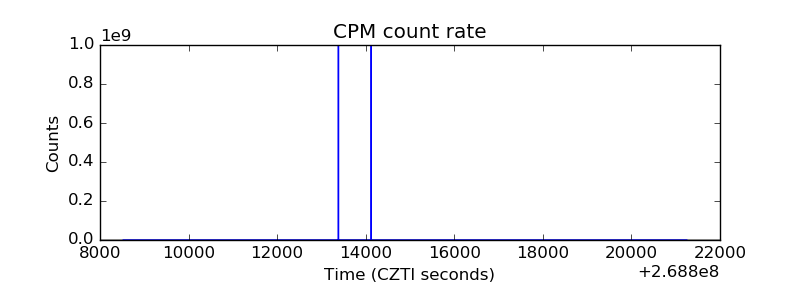 |
| CZT Counter | 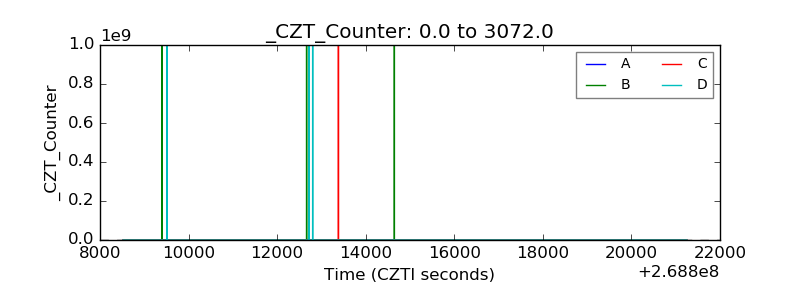 |
| +2.5 Volts monitor |  |
| +5 Volts monitor | 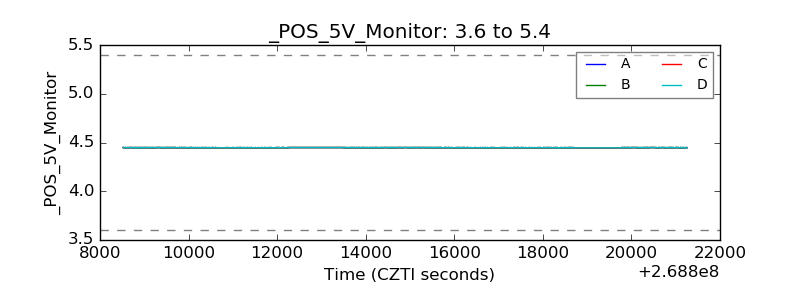 |
| _ROLL_ROT | 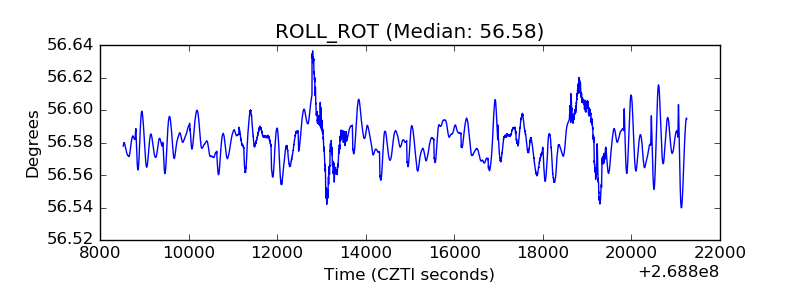 |
| _Roll_DEC | 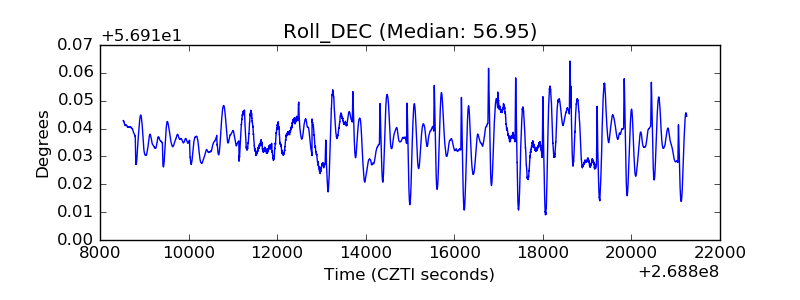 |
| _Roll_RA | 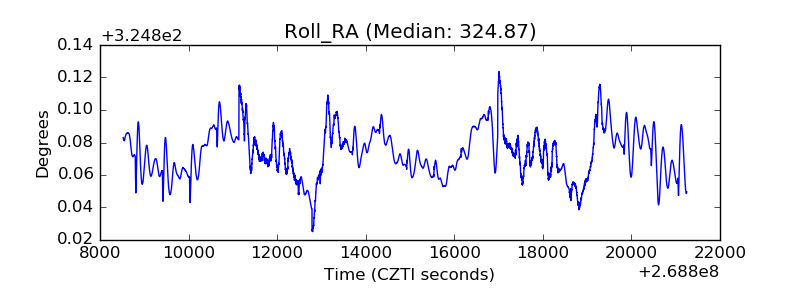 |
| Veto Counter | 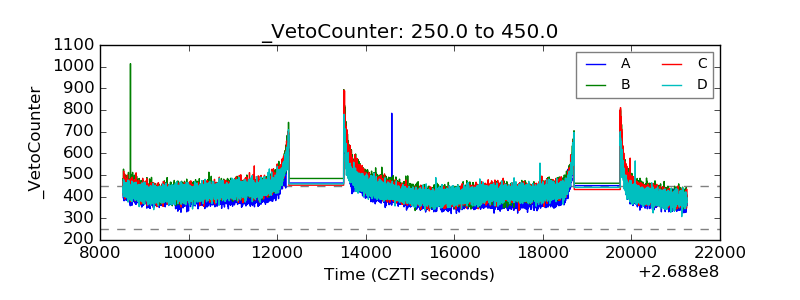 |