| Param | Original file | Final file |
|---|---|---|
| Filename | modeM0/AS1T02_057T01_9000002212_15027cztM0_level2.evt | modeM0/AS1T02_057T01_9000002212_15027cztM0_level2_quad_clean.evt |
| Size (bytes) | 558,267,840 | 97,070,400 |
| Size | 532.4 MB | 92.6 MB |
| Events in quadrant A | 3,939,212 | 623,165 |
| Events in quadrant B | 5,562,820 | 592,004 |
| Events in quadrant C | 3,525,438 | 618,764 |
| Events in quadrant D | 3,383,716 | 596,450 |
| Mode M0 | |||
|---|---|---|---|
| Quadrant | BADHDUFLAG | Total packets | Discarded packets |
| A | 0 | 16448 | 3 |
| B | 0 | 21322 | 2 |
| C | 0 | 15058 | 2 |
| D | 0 | 15348 | 2 |
| Mode SS | |||
|---|---|---|---|
| Quadrant | BADHDUFLAG | Total packets | Discarded packets |
| A | 0 | 148 | 0 |
| B | 0 | 148 | 0 |
| C | 0 | 148 | 0 |
| D | 0 | 148 | 0 |
| Mode M9 | |||
|---|---|---|---|
| Quadrant | BADHDUFLAG | Total packets | Discarded packets |
| A | 0 | 8 | 0 |
| B | 0 | 8 | 0 |
| C | 0 | 8 | 0 |
| D | 0 | 9 | 0 |
| Quadrant | Total seconds | Saturated seconds | Saturation percentage |
|---|---|---|---|
| A | 7307 | 198 | 2.709730% |
| B | 7307 | 788 | 10.784180% |
| C | 7307 | 133 | 1.820172% |
| D | 7307 | 158 | 2.162310% |
Noise dominated data is calculated using 1-second bins in cleaned event files. If a bin has >2000 counts, and if more than 50% of those come from <1% of pixels, then it is considered to be noise-dominated and hence unusable.
| Quadrant | # 1 sec bins | Bins with >0 counts | Bins with >2000 counts | High rate bins dominated by noise | Noise dominated (total time) | Noise dominated (detector-on time) | Marked lightcurve |
|---|---|---|---|---|---|---|---|
| A | 7963 | 7308 | 0 | 0 | 0.00% | 0.00% | 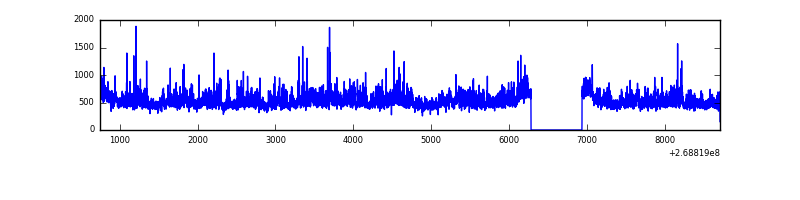 |
| B | 7962 | 7307 | 481 | 481 | 6.04% | 6.58% | 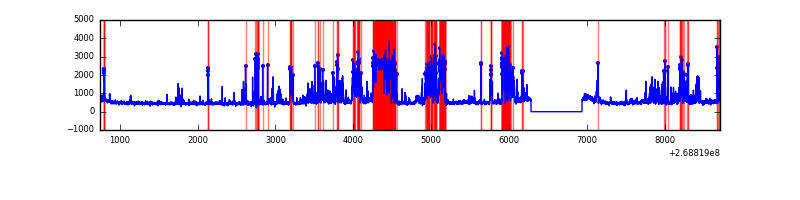 |
| C | 7963 | 7308 | 0 | 0 | 0.00% | 0.00% | 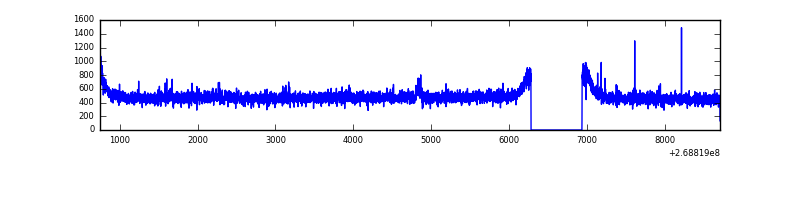 |
| D | 7963 | 7308 | 20 | 20 | 0.25% | 0.27% | 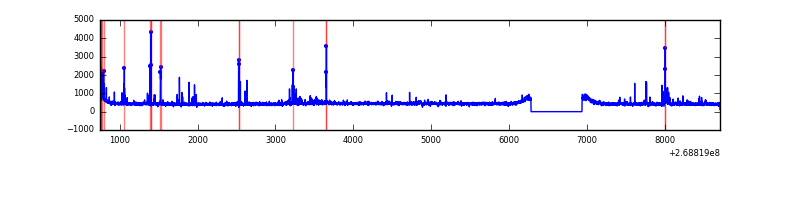 |
Top three noisy pixels from each quadrant. If the there are fewer than three noisy pixels in the level2.evt file, extra rows are filled as -1
| Pixel properties | Quadrant properties | ||||||
|---|---|---|---|---|---|---|---|
| Quadrant | DetID | PixID | Counts | Sigma | Mean | Median | Sigma |
| A | 1 | 162 | 214387 | 1224.08 | 867 | 847 | 174.4 |
| A | 1 | 178 | 116223 | 661.37 | 867 | 847 | 174.4 |
| A | 1 | 161 | 100300 | 570.1 | 867 | 847 | 174.4 |
| B | 10 | 16 | 1866805 | 11676.9 | 833 | 810 | 159.8 |
| B | 0 | 229 | 202698 | 1263.36 | 833 | 810 | 159.8 |
| B | 3 | 64 | 165209 | 1028.77 | 833 | 810 | 159.8 |
| C | 3 | 233 | 259398 | 1340.97 | 837 | 839 | 192.8 |
| C | 13 | 61 | 5924 | 26.37 | 837 | 839 | 192.8 |
| C | 14 | 234 | 5195 | 22.59 | 837 | 839 | 192.8 |
| D | 2 | 136 | 66769 | 325.99 | 837 | 808 | 202.3 |
| D | 10 | 70 | 63543 | 310.05 | 837 | 808 | 202.3 |
| D | 13 | 249 | 39116 | 189.33 | 837 | 808 | 202.3 |
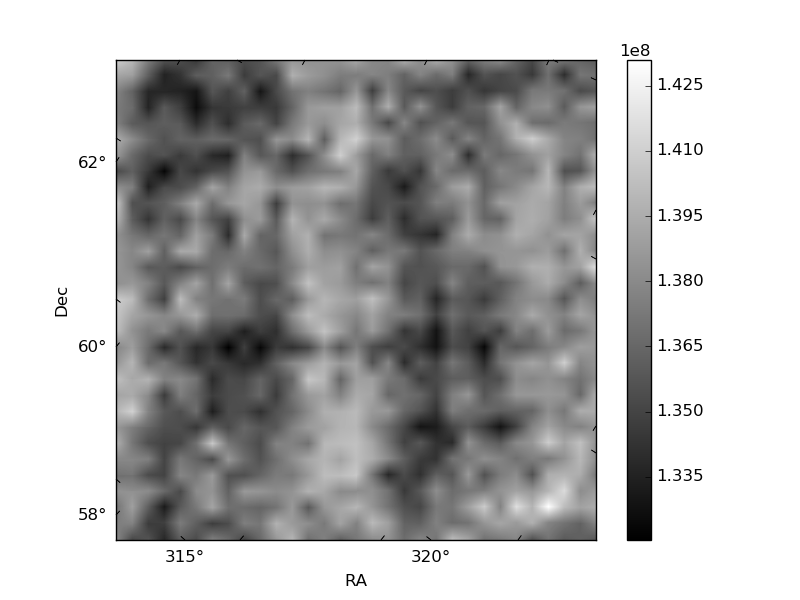
Histogram calculated using DETX and DETY for each event in the final _common_clean file
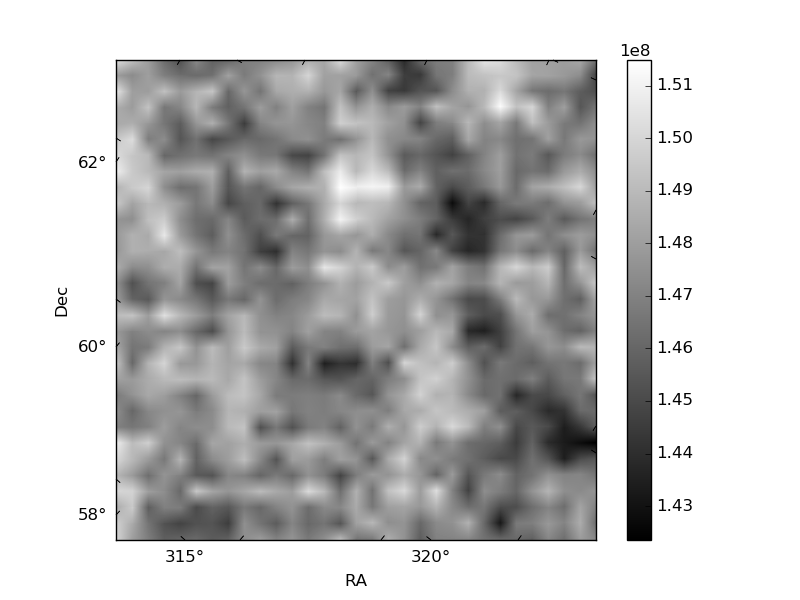
| Quadrant A | 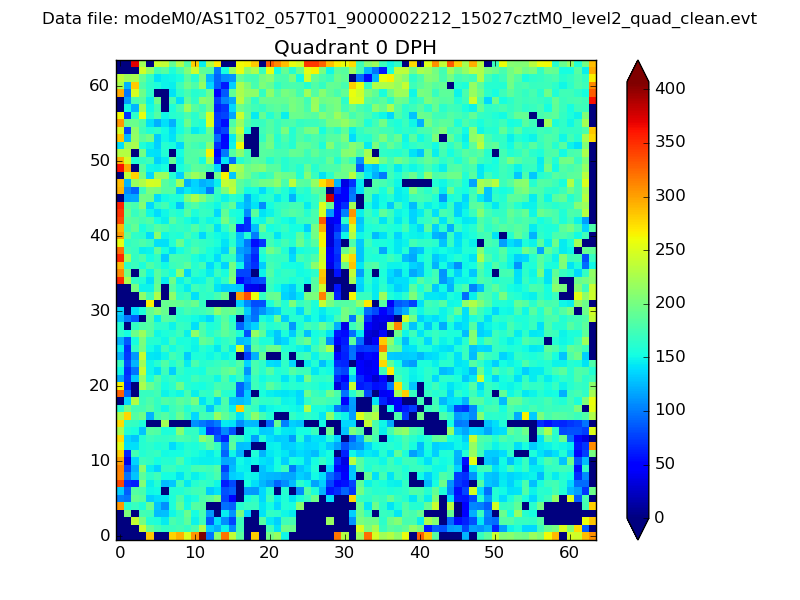 |
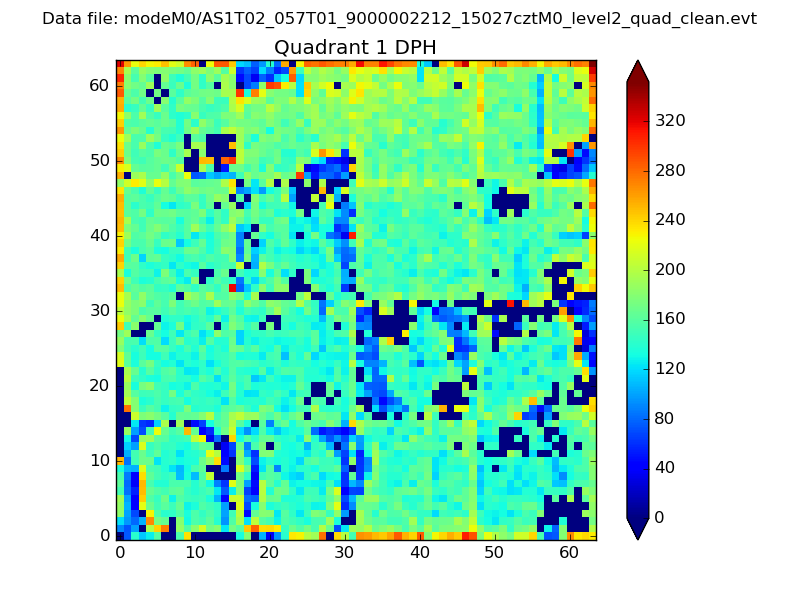 |
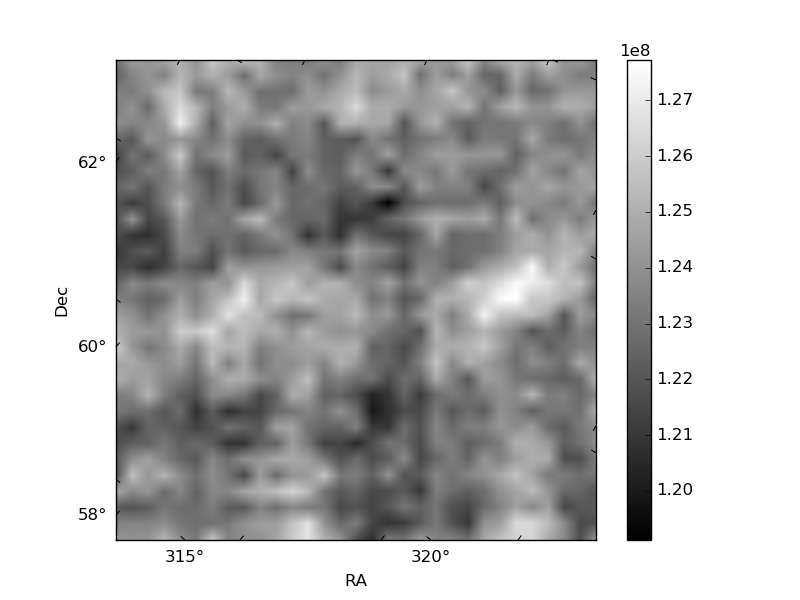
Quadrant B |
|---|---|---|---|
| Quadrant D | 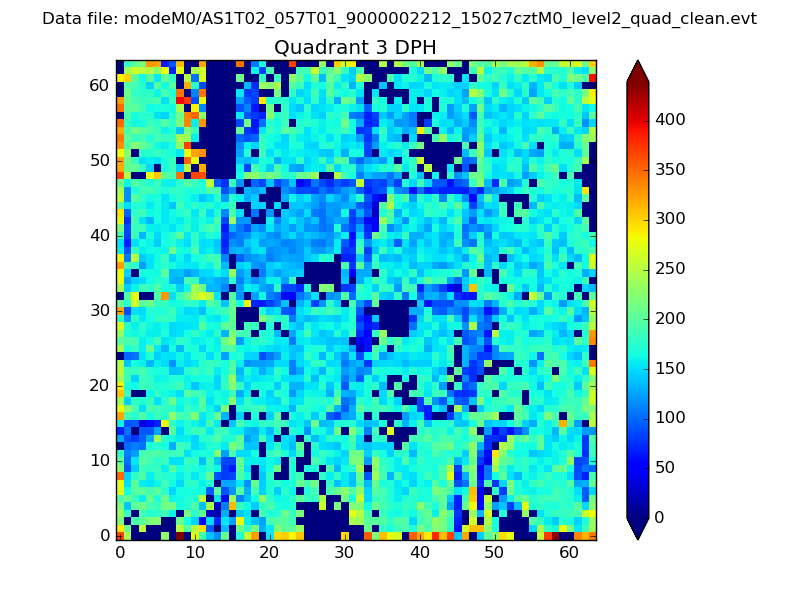 |
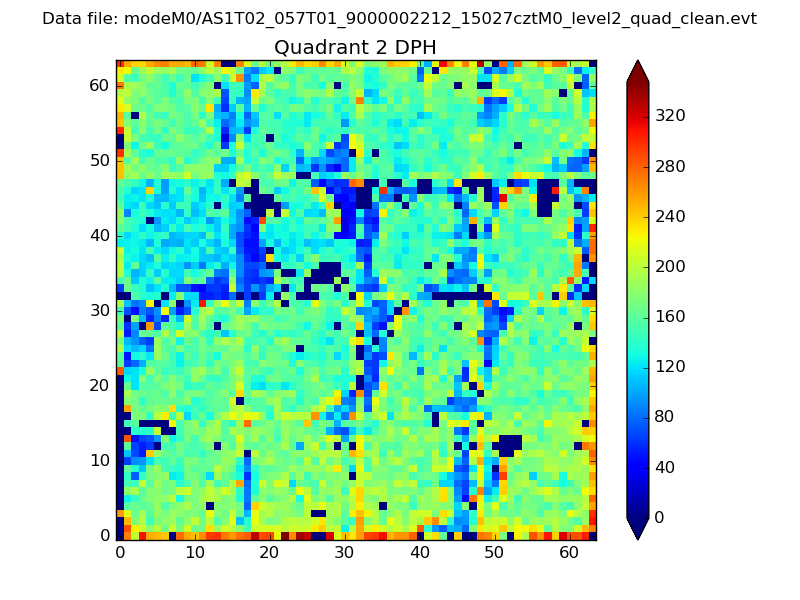 |
Quadrant C |
| Plot type | Count rate plots | Images |
|---|---|---|
| Comparison with Poisson distribution Blue bars denote a histogram of data divided into 1 sec bins. Red curve is a Poisson curve with rate = median count rate of data. |
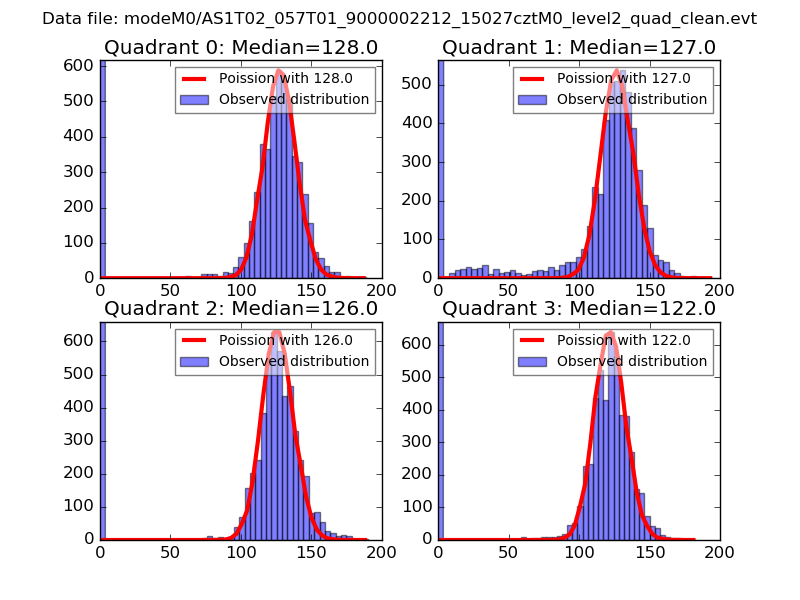 |
 |
| Quadrant-wise count rates Data is divided into 100 sec bins |
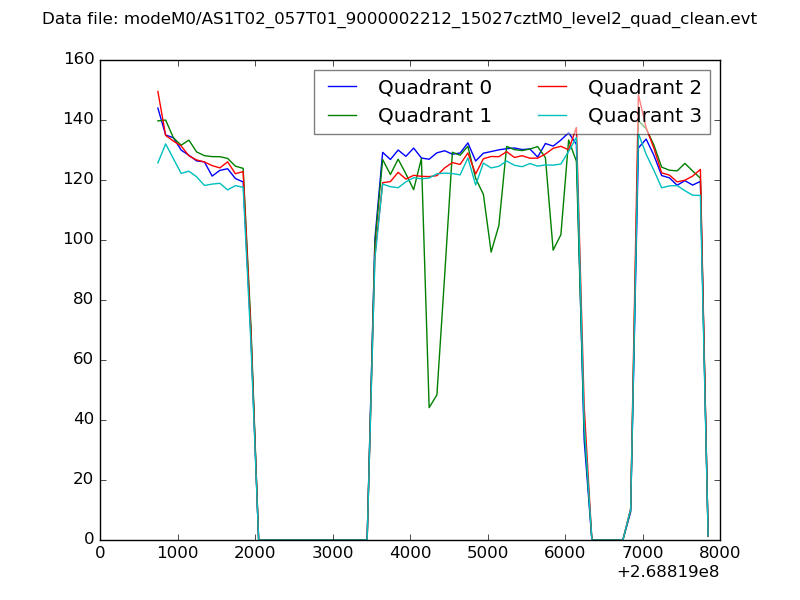 |
|
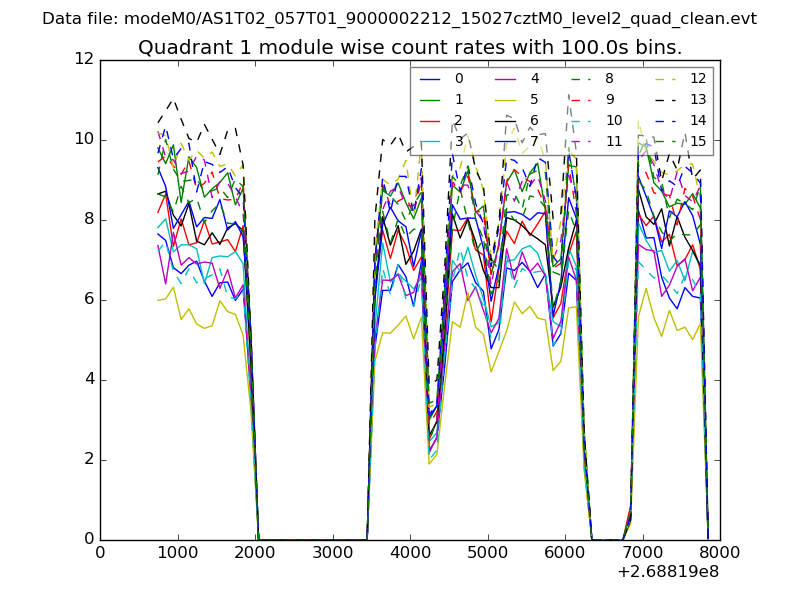
| Module-wise count rates for Quadrant A Data is divided into 100 sec bins |
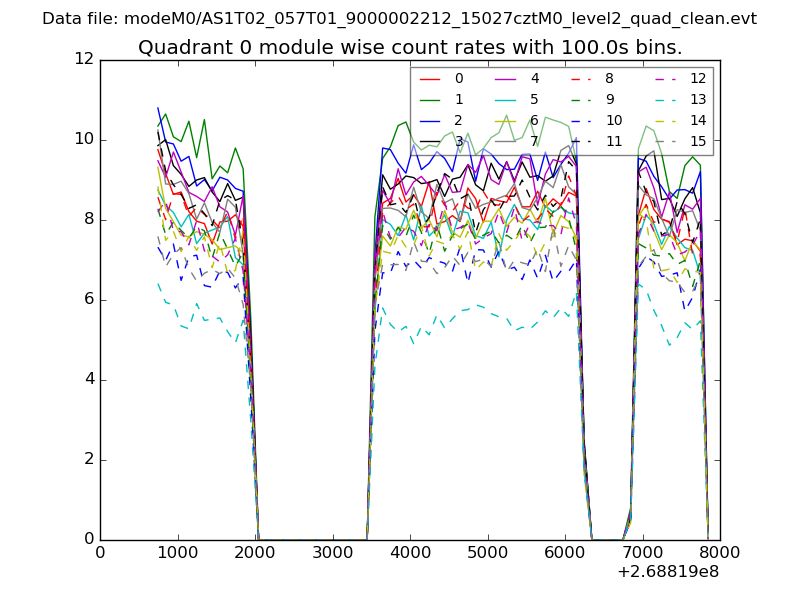 |
 |
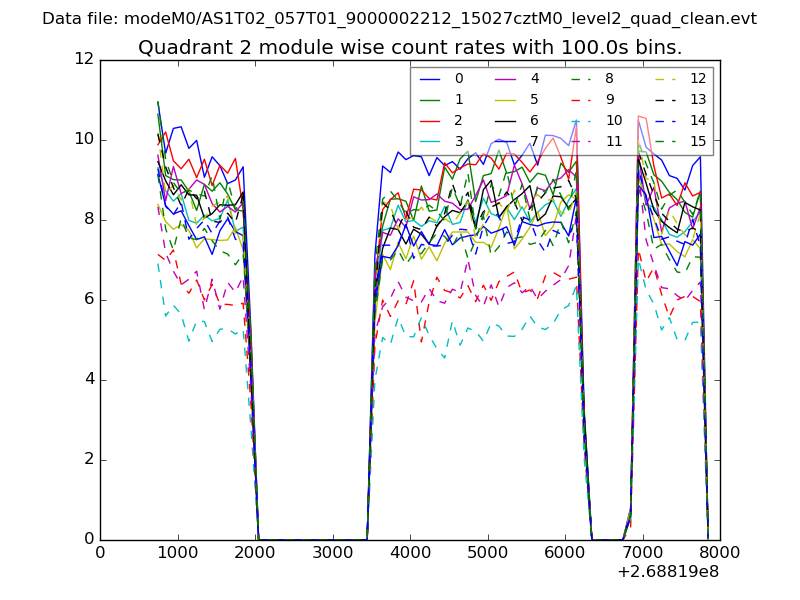
| Module-wise count rates for Quadrant B Data is divided into 100 sec bins |
 |
 |
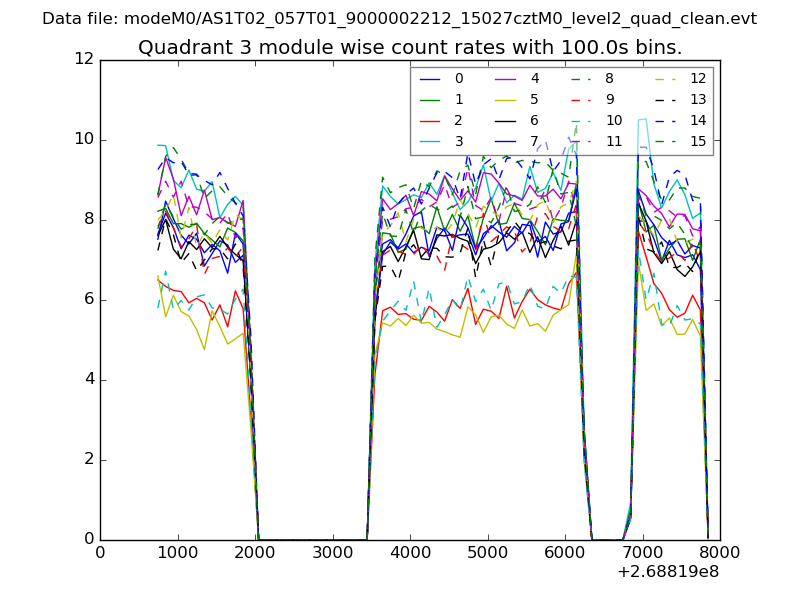
| Module-wise count rates for Quadrant C Data is divided into 100 sec bins |
 |
 |
| Module-wise count rates for Quadrant D Data is divided into 100 sec bins |
 |
 |
| Parameter | Plot |
|---|---|
| CZT HV Monitor | 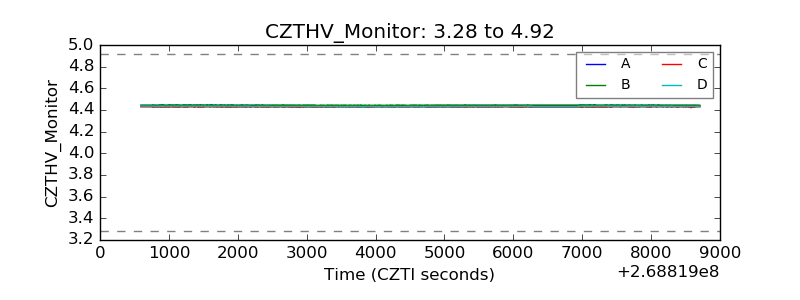 |
| D_VDD | 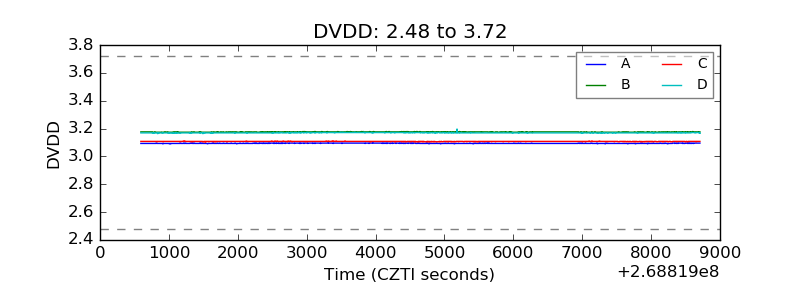 |
| Temperature 1 | 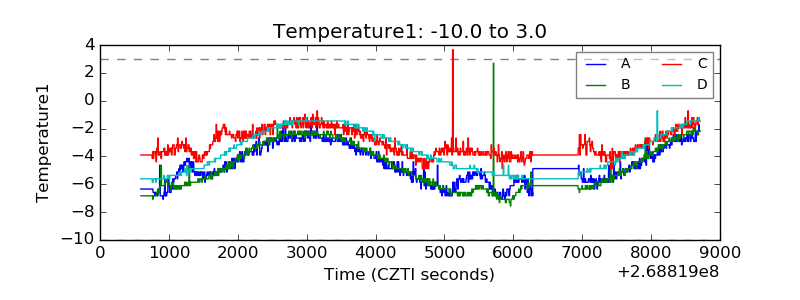 |
| Veto HV Monitor | 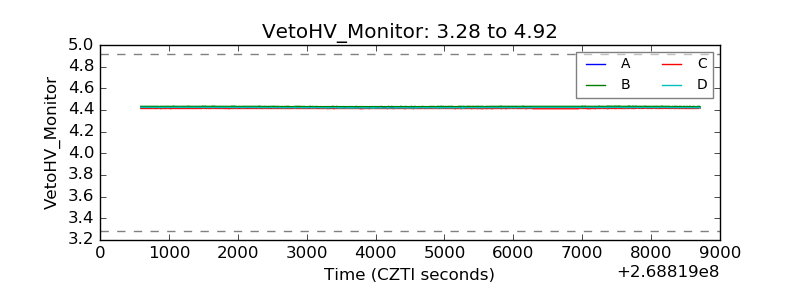 |
| Veto LLD | 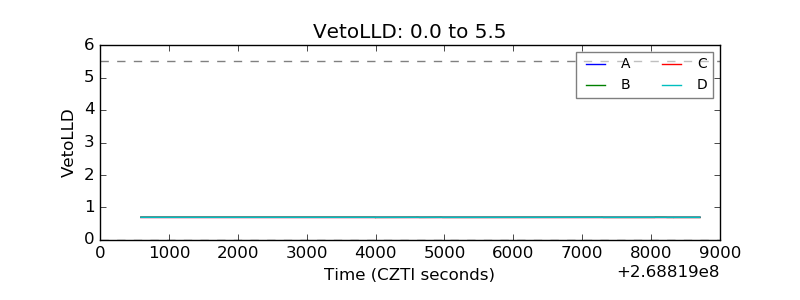 |
| Alpha Counter | 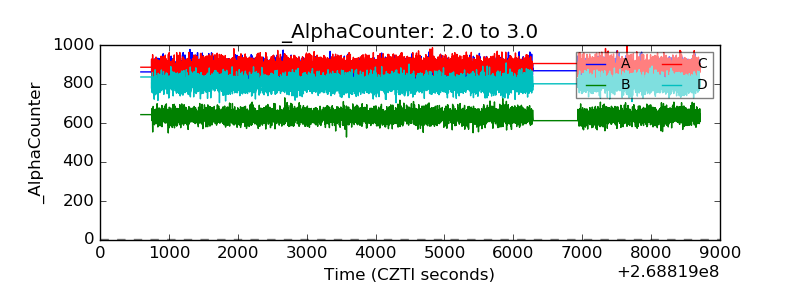 |
| _CPM_Rate | 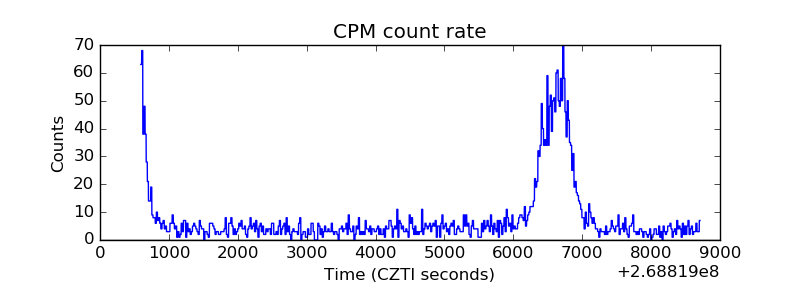 |
| CZT Counter | 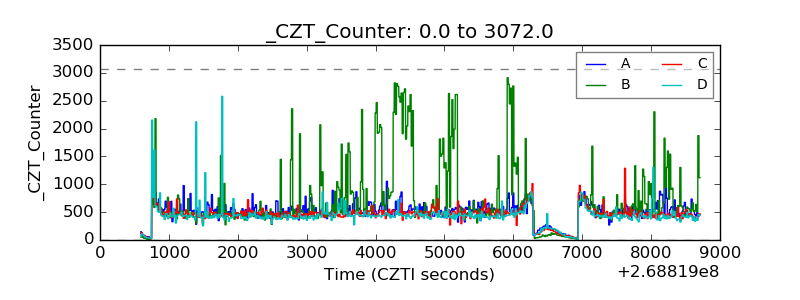 |
| +2.5 Volts monitor |  |
| +5 Volts monitor |  |
| _ROLL_ROT | 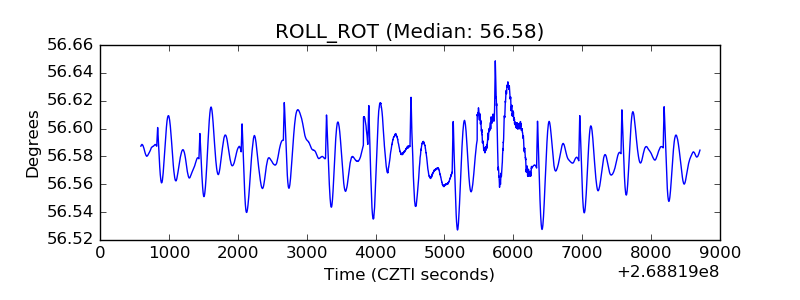 |
| _Roll_DEC | 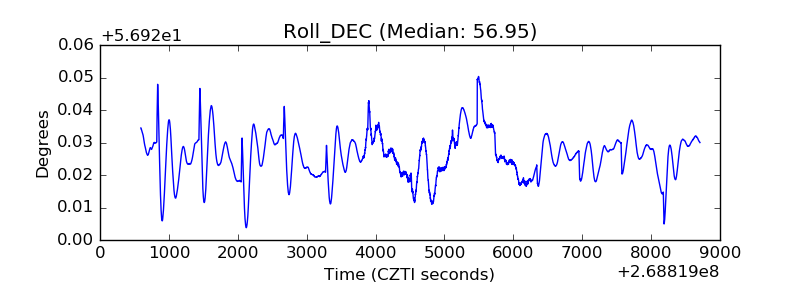 |
| _Roll_RA |  |
| Veto Counter | 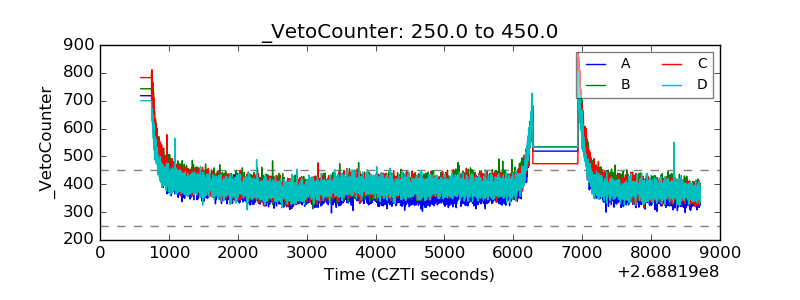 |