| Param | Original file | Final file |
|---|---|---|
| Filename | modeM0/AS1A04_218T03_9000002214cztM0_level2.fits | modeM0/AS1A04_218T03_9000002214cztM0_level2_quad_clean.evt |
| Size (bytes) | 295,830,720 | 275,376,960 |
| Size | 282.1 MB | 262.6 MB |
| Events in quadrant A | 1,793,438 | 1,612,880 |
| Events in quadrant B | 1,701,534 | 1,614,470 |
| Events in quadrant C | 1,771,268 | 1,534,395 |
| Events in quadrant D | 1,544,362 | 1,428,875 |
| Mode M9 | |||
|---|---|---|---|
| Quadrant | BADHDUFLAG | Total packets | Discarded packets |
| A | 0 | 49 | 0 |
| B | 0 | 49 | 0 |
| C | 0 | 49 | 0 |
| D | 0 | 49 | 0 |
| Mode SS | |||
|---|---|---|---|
| Quadrant | BADHDUFLAG | Total packets | Discarded packets |
| A | 0 | 640 | 0 |
| B | 0 | 640 | 0 |
| C | 0 | 640 | 0 |
| D | 0 | 640 | 0 |
| Mode M0 | |||
|---|---|---|---|
| Quadrant | BADHDUFLAG | Total packets | Discarded packets |
| A | 0 | 69118 | 0 |
| B | 0 | 74164 | 0 |
| C | 0 | 68533 | 0 |
| D | 0 | 66919 | 0 |
| Quadrant | Total seconds | Saturated seconds | Saturation percentage |
|---|---|---|---|
| A | 31256 | 269 | 0.860635% |
| B | 31256 | 1230 | 3.935244% |
| C | 31256 | 185 | 0.591886% |
| D | 31256 | 273 | 0.873432% |
Noise dominated data is calculated using 1-second bins in cleaned event files. If a bin has >2000 counts, and if more than 50% of those come from <1% of pixels, then it is considered to be noise-dominated and hence unusable.
| Quadrant | # 1 sec bins | Bins with >0 counts | Bins with >2000 counts | High rate bins dominated by noise | Noise dominated (total time) | Noise dominated (detector-on time) | Marked lightcurve |
|---|---|---|---|---|---|---|---|
| A | 36242 | 31255 | 0 | 0 | 0.00% | 0.00% |  |
| B | 36242 | 31243 | 0 | 0 | 0.00% | 0.00% |  |
| C | 36242 | 31253 | 0 | 0 | 0.00% | 0.00% |  |
| D | 36242 | 31253 | 0 | 0 | 0.00% | 0.00% |  |
Top three noisy pixels from each quadrant. If the there are fewer than three noisy pixels in the level2.evt file, extra rows are filled as -1
| Pixel properties | Quadrant properties | ||||||
|---|---|---|---|---|---|---|---|
| Quadrant | DetID | PixID | Counts | Sigma | Mean | Median | Sigma |
| A | 0 | 29 | 1820 | 11.63 | 466 | 434 | 119.2 |
| A | 7 | 110 | 1458 | 8.59 | 466 | 434 | 119.2 |
| A | 0 | 30 | 1433 | 8.38 | 466 | 434 | 119.2 |
| B | 2 | 9 | 1436 | 11.15 | 448 | 427 | 90.5 |
| B | 5 | 128 | 1149 | 7.98 | 448 | 427 | 90.5 |
| B | 3 | 17 | 1134 | 7.81 | 448 | 427 | 90.5 |
| C | 1 | 80 | 1344 | 7.48 | 466 | 433 | 121.7 |
| C | 1 | 81 | 1330 | 7.37 | 466 | 433 | 121.7 |
| C | 9 | 233 | 1244 | 6.66 | 466 | 433 | 121.7 |
| D | 6 | 231 | 1164 | 6.42 | 440 | 400 | 119.0 |
| D | 7 | 3 | 1140 | 6.22 | 440 | 400 | 119.0 |
| D | 3 | 14 | 1120 | 6.05 | 440 | 400 | 119.0 |
Histogram calculated using DETX and DETY for each event in the final _common_clean file
| Quadrant A | 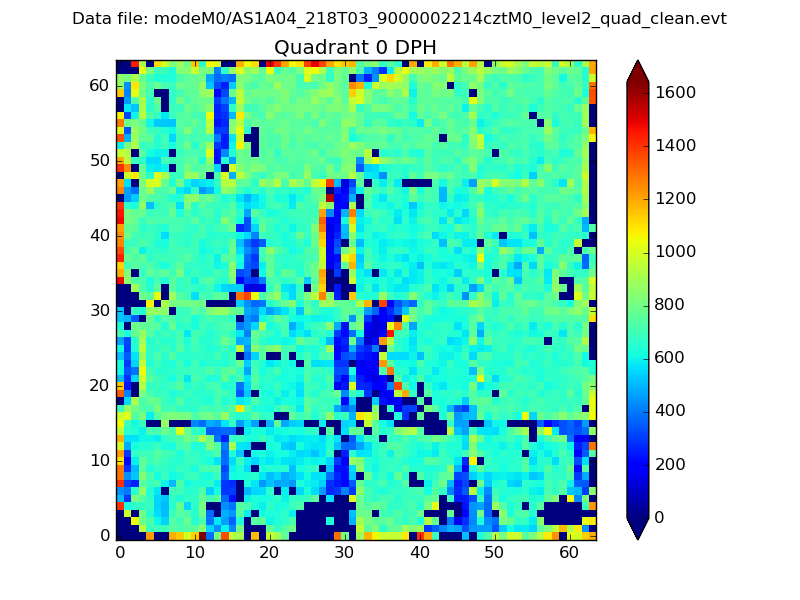 |
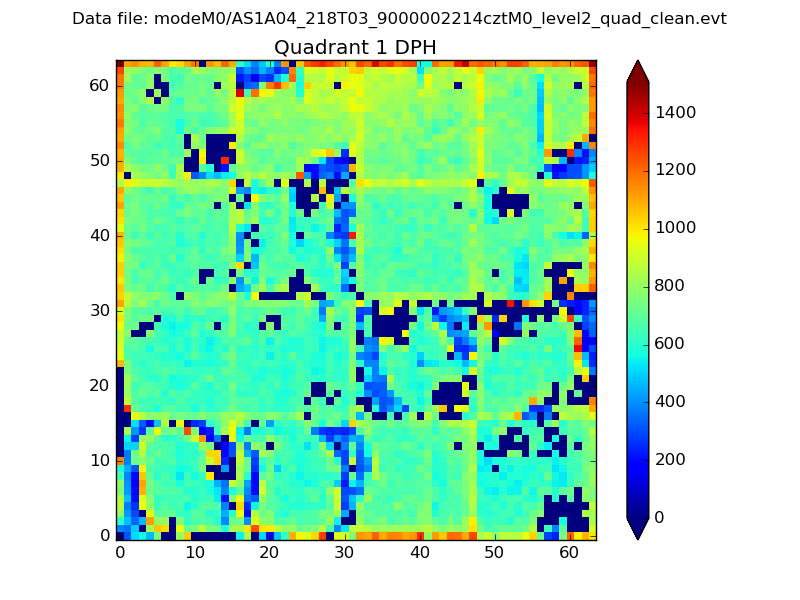 |
Quadrant B |
|---|---|---|---|
| Quadrant D | 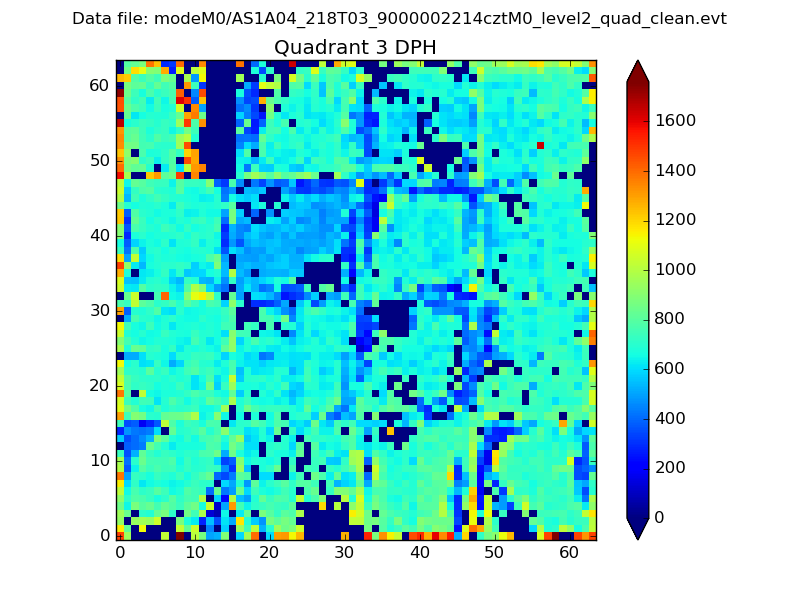 |
 |
Quadrant C |
| Plot type | Count rate plots | Images |
|---|---|---|
| Comparison with Poisson distribution Blue bars denote a histogram of data divided into 1 sec bins. Red curve is a Poisson curve with rate = median count rate of data. |
 |
 |
| Quadrant-wise count rates Data is divided into 100 sec bins |
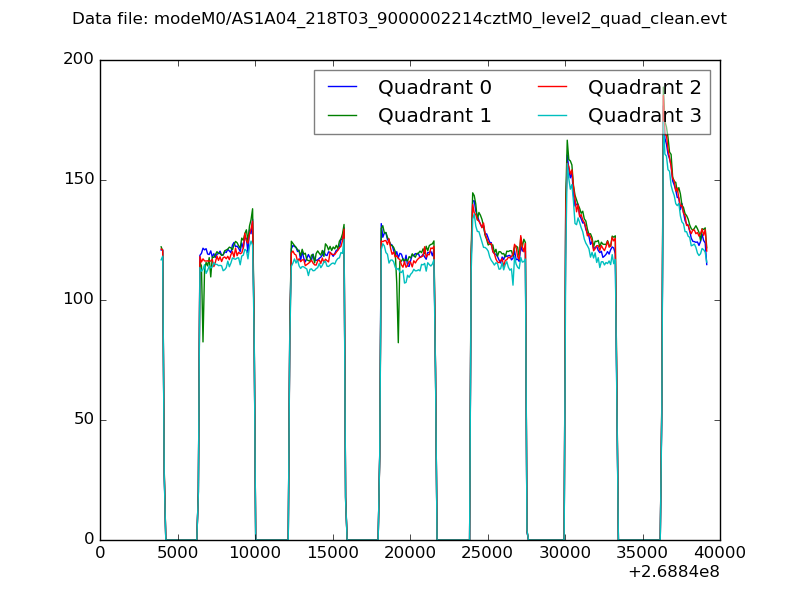 |
|
| Module-wise count rates for Quadrant A Data is divided into 100 sec bins |
 |
 |
| Module-wise count rates for Quadrant B Data is divided into 100 sec bins |
 |
 |
| Module-wise count rates for Quadrant C Data is divided into 100 sec bins |
 |
 |
| Module-wise count rates for Quadrant D Data is divided into 100 sec bins |
 |
 |
| Parameter | Plot |
|---|---|
| CZT HV Monitor |  |
| D_VDD | 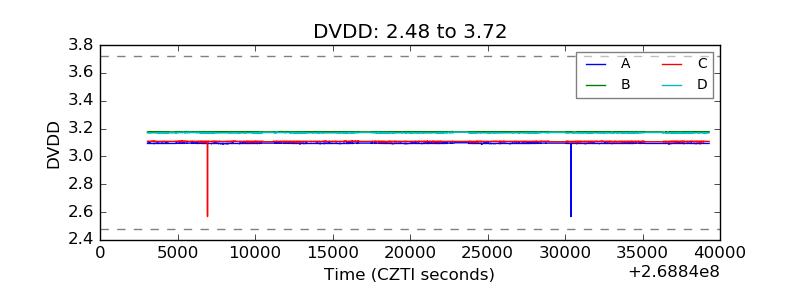 |
| Temperature 1 |  |
| Veto HV Monitor |  |
| Veto LLD |  |
| Alpha Counter |  |
| _CPM_Rate |  |
| CZT Counter |  |
| +2.5 Volts monitor |  |
| +5 Volts monitor |  |
| _ROLL_ROT |  |
| _Roll_DEC |  |
| _Roll_RA |  |
| Veto Counter |  |