| Param | Original file | Final file |
|---|---|---|
| Filename | modeM0/AS1A04_218T03_9000002214_15032cztM0_level2.evt | modeM0/AS1A04_218T03_9000002214_15032cztM0_level2_quad_clean.evt |
| Size (bytes) | 984,769,920 | 158,348,160 |
| Size | 939.1 MB | 151.0 MB |
| Events in quadrant A | 6,975,424 | 988,217 |
| Events in quadrant B | 8,087,750 | 989,000 |
| Events in quadrant C | 7,368,269 | 970,742 |
| Events in quadrant D | 6,508,553 | 944,467 |
| Mode M9 | |||
|---|---|---|---|
| Quadrant | BADHDUFLAG | Total packets | Discarded packets |
| A | 0 | 17 | 0 |
| B | 0 | 17 | 0 |
| C | 0 | 17 | 0 |
| D | 0 | 17 | 0 |
| Mode SS | |||
|---|---|---|---|
| Quadrant | BADHDUFLAG | Total packets | Discarded packets |
| A | 0 | 268 | 0 |
| B | 0 | 268 | 0 |
| C | 0 | 268 | 0 |
| D | 0 | 268 | 0 |
| Mode M0 | |||
|---|---|---|---|
| Quadrant | BADHDUFLAG | Total packets | Discarded packets |
| A | 0 | 29106 | 4 |
| B | 0 | 32482 | 3 |
| C | 0 | 29944 | 3 |
| D | 0 | 28485 | 3 |
| Quadrant | Total seconds | Saturated seconds | Saturation percentage |
|---|---|---|---|
| A | 13070 | 187 | 1.430757% |
| B | 13070 | 722 | 5.524101% |
| C | 13070 | 125 | 0.956389% |
| D | 13070 | 168 | 1.285386% |
Noise dominated data is calculated using 1-second bins in cleaned event files. If a bin has >2000 counts, and if more than 50% of those come from <1% of pixels, then it is considered to be noise-dominated and hence unusable.
| Quadrant | # 1 sec bins | Bins with >0 counts | Bins with >2000 counts | High rate bins dominated by noise | Noise dominated (total time) | Noise dominated (detector-on time) | Marked lightcurve |
|---|---|---|---|---|---|---|---|
| A | 14877 | 13073 | 9 | 9 | 0.06% | 0.07% |  |
| B | 14877 | 13071 | 381 | 381 | 2.56% | 2.91% | 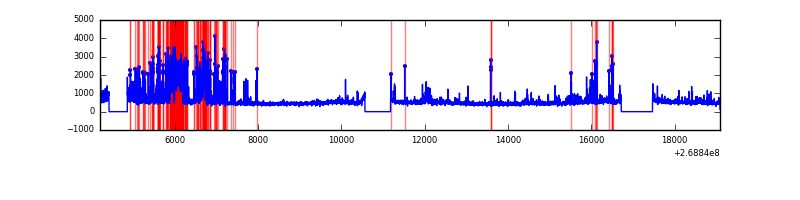 |
| C | 14877 | 13072 | 0 | 0 | 0.00% | 0.00% |  |
| D | 14877 | 13073 | 55 | 55 | 0.37% | 0.42% | 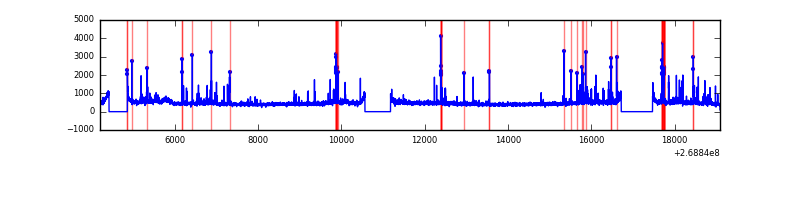 |
Top three noisy pixels from each quadrant. If the there are fewer than three noisy pixels in the level2.evt file, extra rows are filled as -1
| Pixel properties | Quadrant properties | ||||||
|---|---|---|---|---|---|---|---|
| Quadrant | DetID | PixID | Counts | Sigma | Mean | Median | Sigma |
| A | 12 | 189 | 301331 | 940.52 | 1579 | 1542 | 318.7 |
| A | 1 | 162 | 230350 | 717.83 | 1579 | 1542 | 318.7 |
| A | 1 | 178 | 120212 | 372.3 | 1579 | 1542 | 318.7 |
| B | 3 | 64 | 1520854 | 5123.24 | 1551 | 1512 | 296.6 |
| B | 10 | 16 | 224400 | 751.58 | 1551 | 1512 | 296.6 |
| B | 4 | 173 | 82603 | 273.44 | 1551 | 1512 | 296.6 |
| C | 3 | 233 | 1376801 | 3861.47 | 1531 | 1536 | 356.2 |
| C | 3 | 232 | 12227 | 30.02 | 1531 | 1536 | 356.2 |
| C | 13 | 61 | 10997 | 26.56 | 1531 | 1536 | 356.2 |
| D | 2 | 136 | 230024 | 614.01 | 1535 | 1489 | 372.2 |
| D | 12 | 235 | 105366 | 279.09 | 1535 | 1489 | 372.2 |
| D | 4 | 239 | 96650 | 255.67 | 1535 | 1489 | 372.2 |
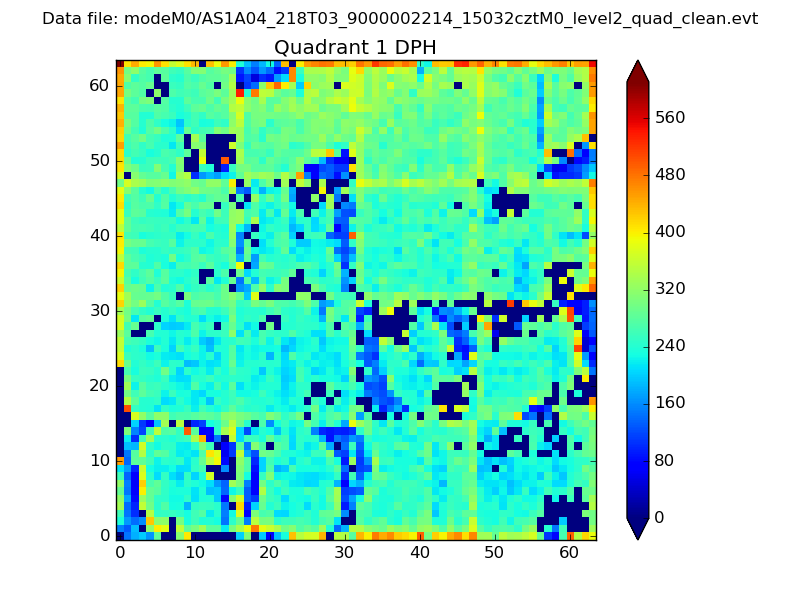
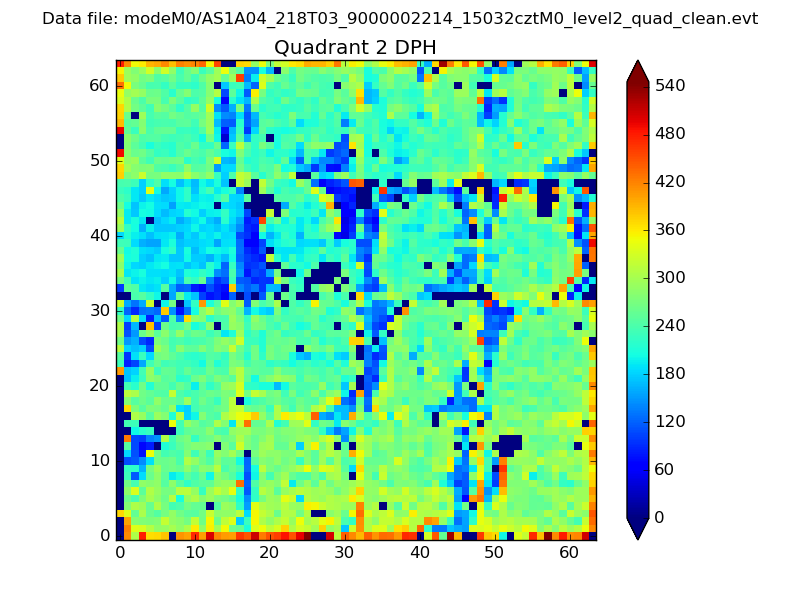
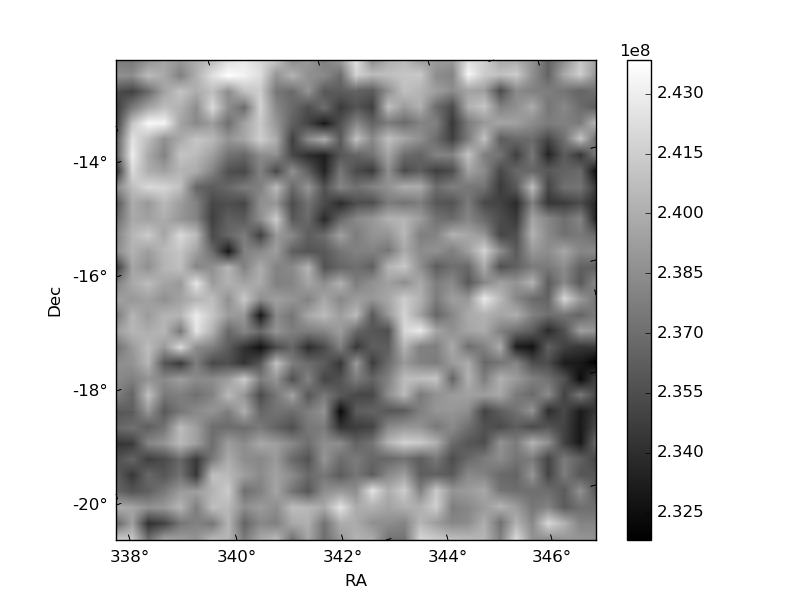
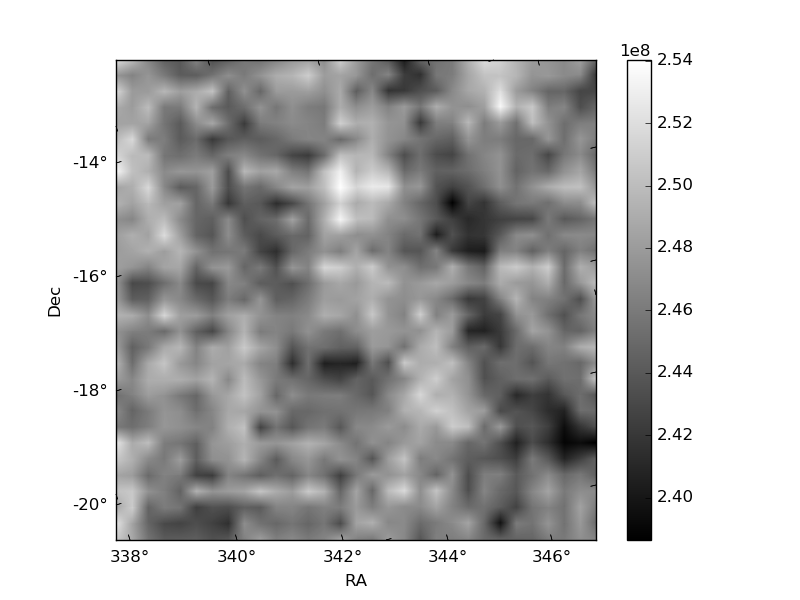
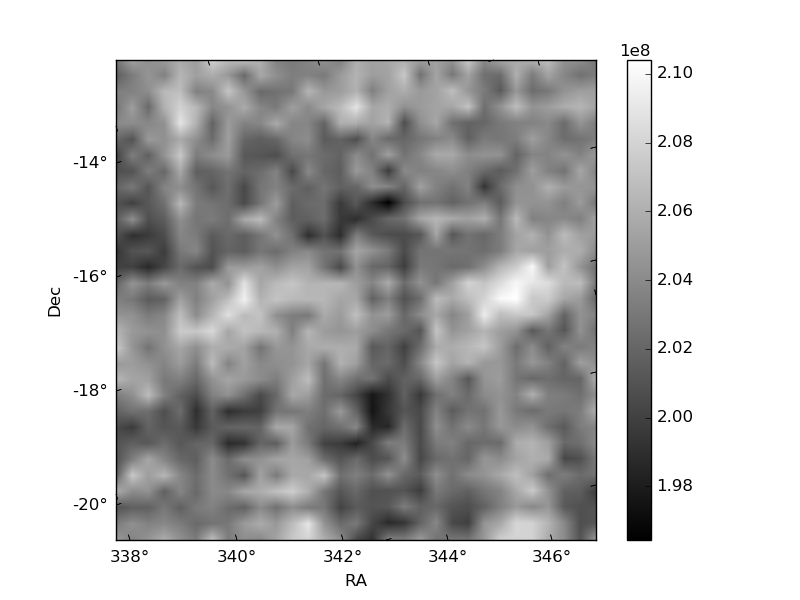
Histogram calculated using DETX and DETY for each event in the final _common_clean file
| Quadrant A |  |
 |
Quadrant B |
|---|---|---|---|
| Quadrant D | 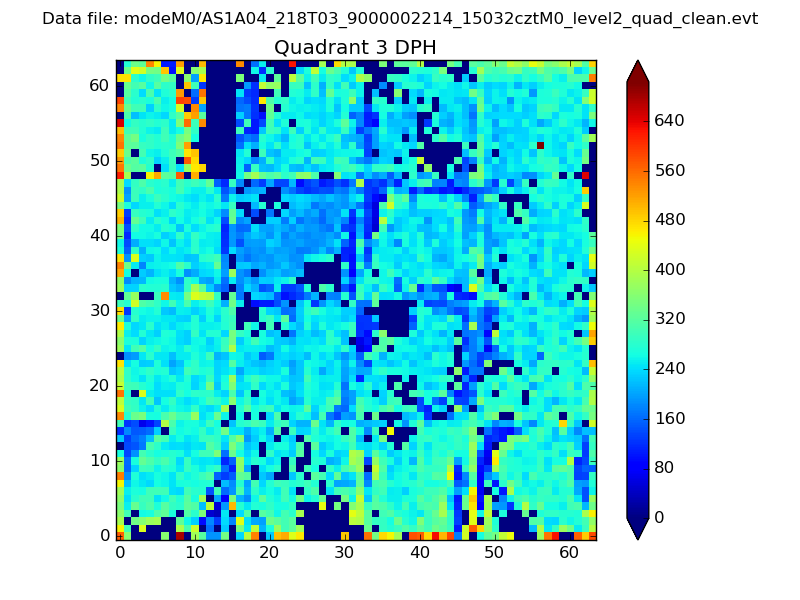 |
 |
Quadrant C |
| Plot type | Count rate plots | Images |
|---|---|---|
| Comparison with Poisson distribution Blue bars denote a histogram of data divided into 1 sec bins. Red curve is a Poisson curve with rate = median count rate of data. |
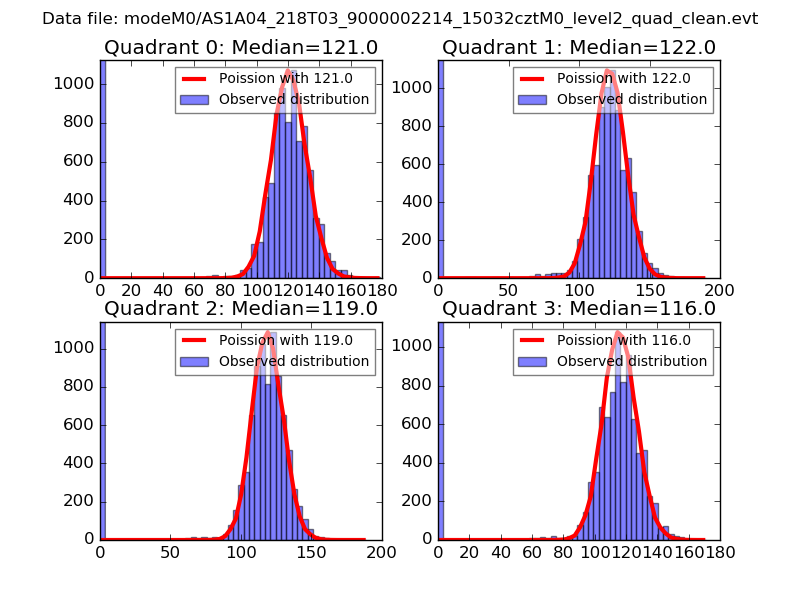 |
 |
| Quadrant-wise count rates Data is divided into 100 sec bins |
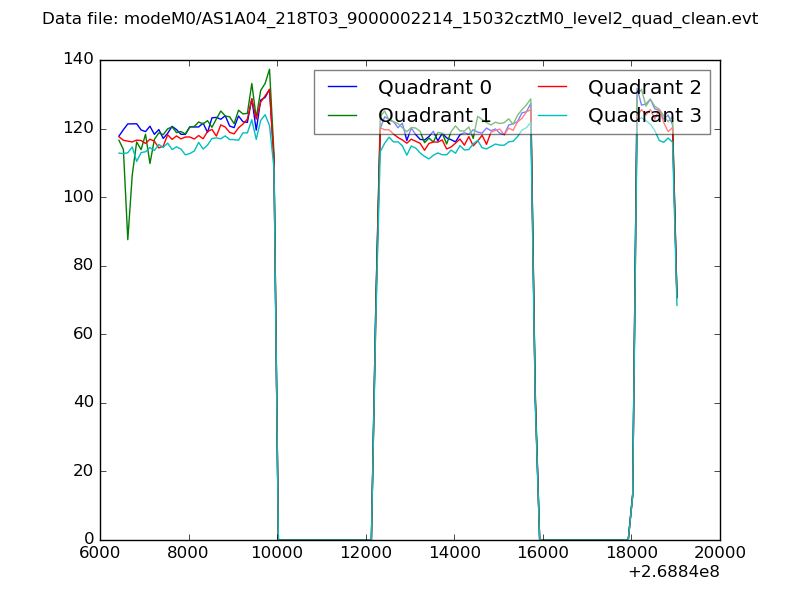 |
|
| Module-wise count rates for Quadrant A Data is divided into 100 sec bins |
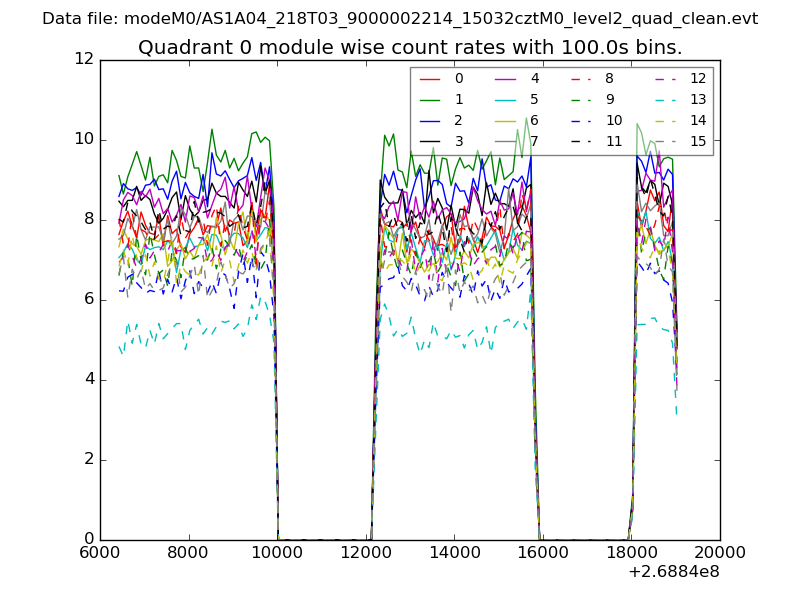 |
 |
| Module-wise count rates for Quadrant B Data is divided into 100 sec bins |
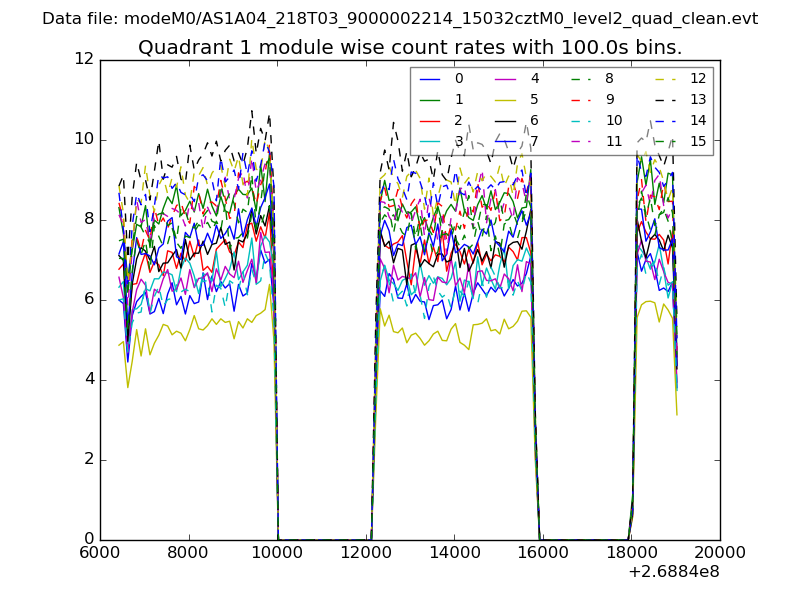 |
 |
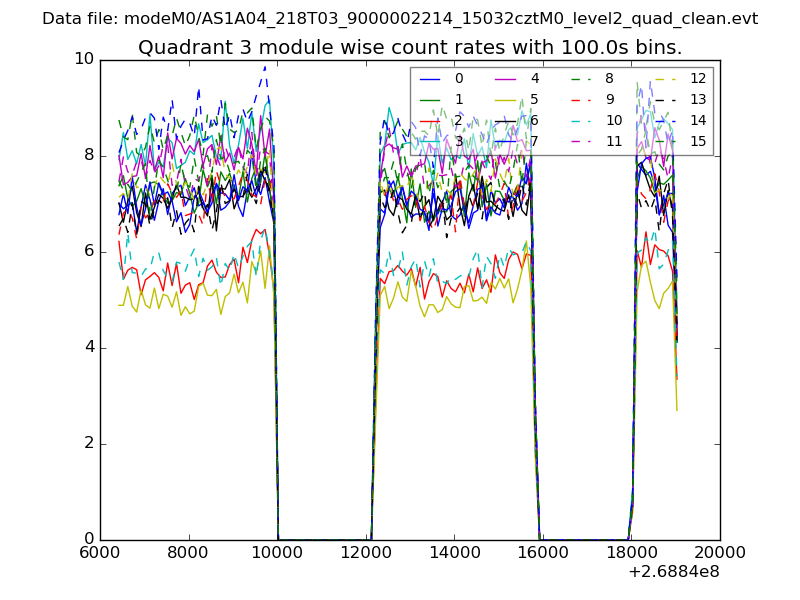
| Module-wise count rates for Quadrant C Data is divided into 100 sec bins |
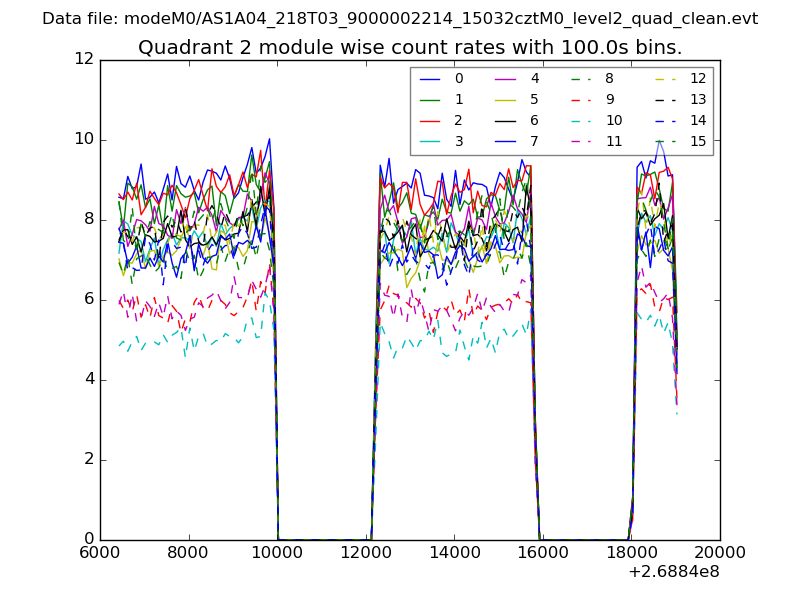 |
 |
| Module-wise count rates for Quadrant D Data is divided into 100 sec bins |
 |
 |
| Parameter | Plot |
|---|---|
| CZT HV Monitor | 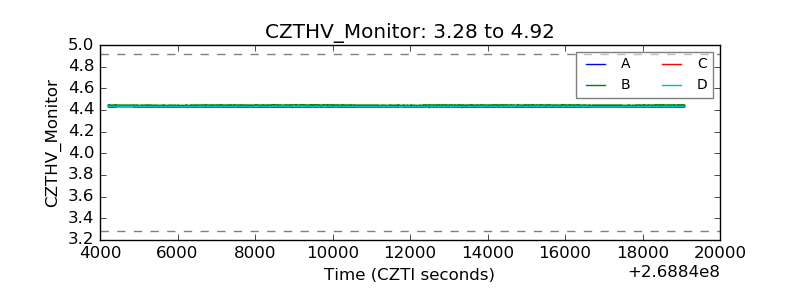 |
| D_VDD | 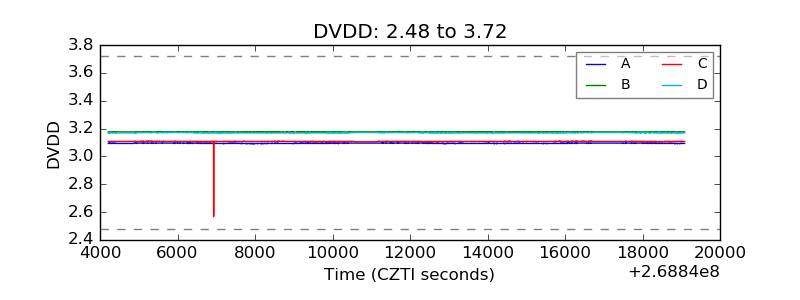 |
| Temperature 1 | 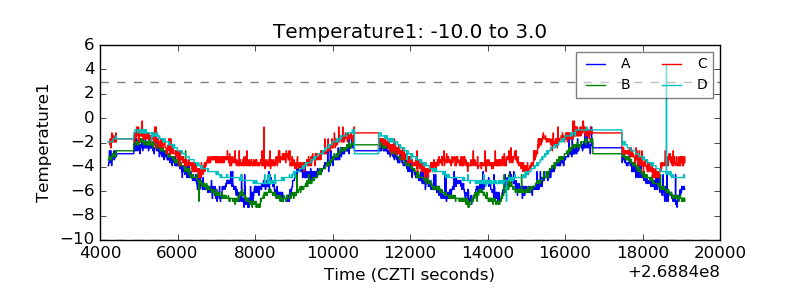 |
| Veto HV Monitor | 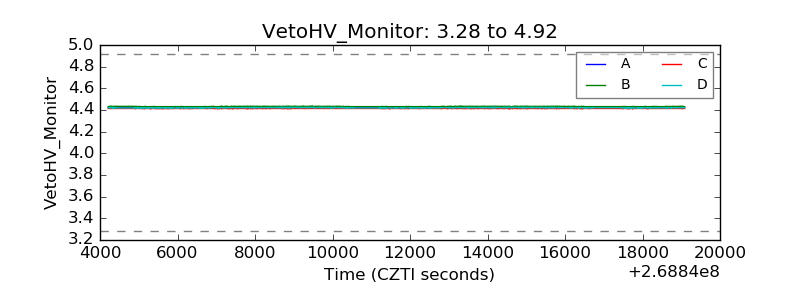 |
| Veto LLD | 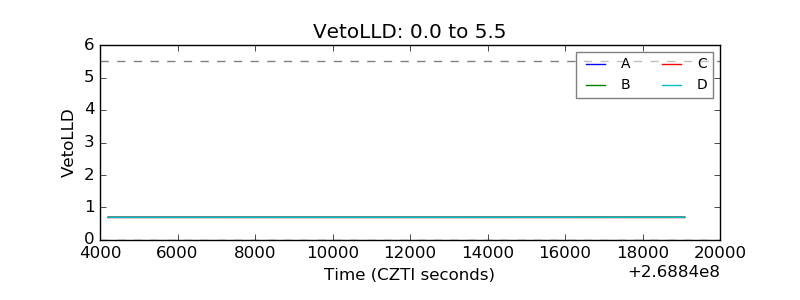 |
| Alpha Counter | 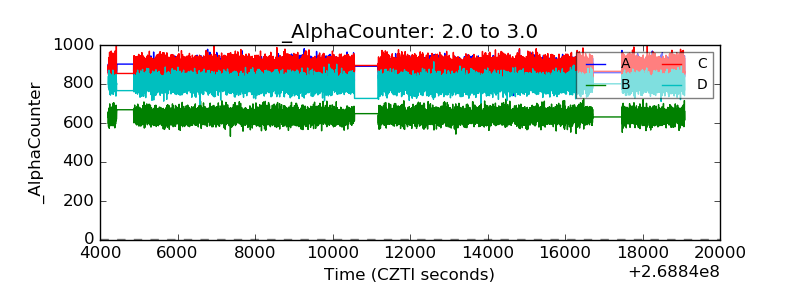 |
| _CPM_Rate | 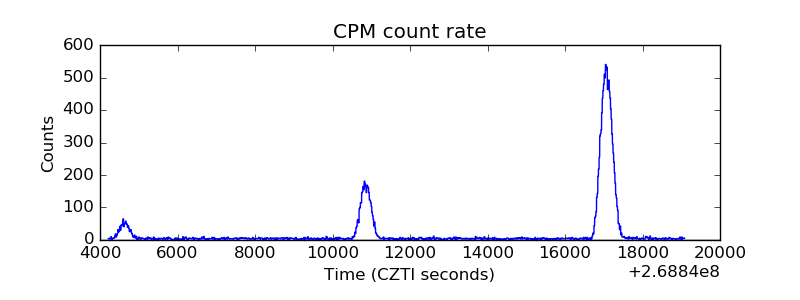 |
| CZT Counter | 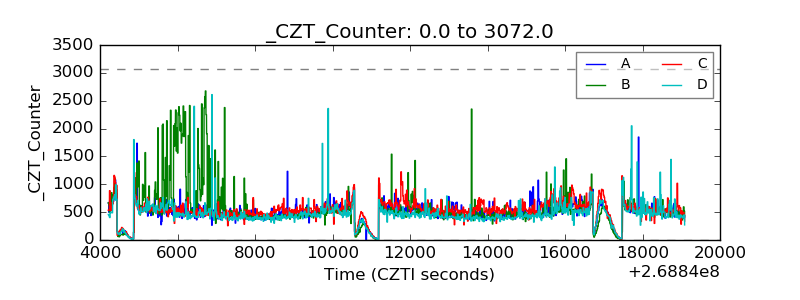 |
| +2.5 Volts monitor |  |
| +5 Volts monitor |  |
| _ROLL_ROT | 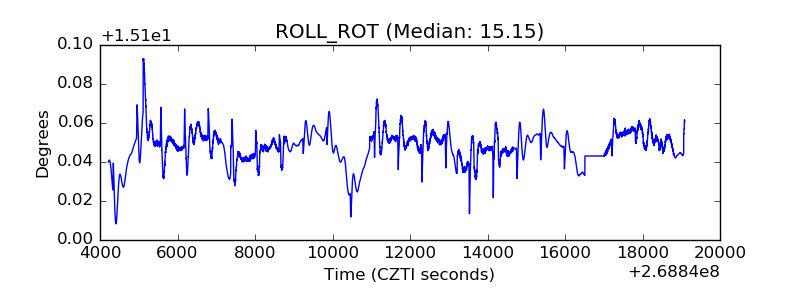 |
| _Roll_DEC | 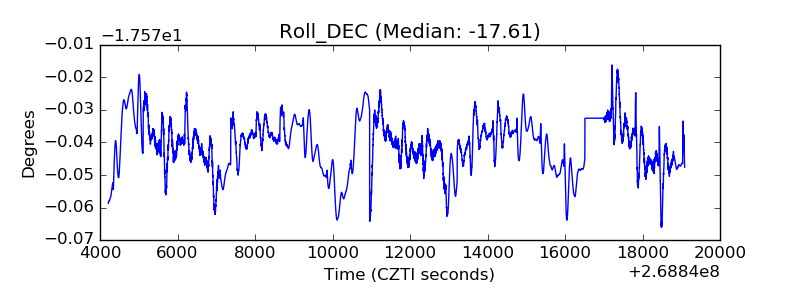 |
| _Roll_RA | 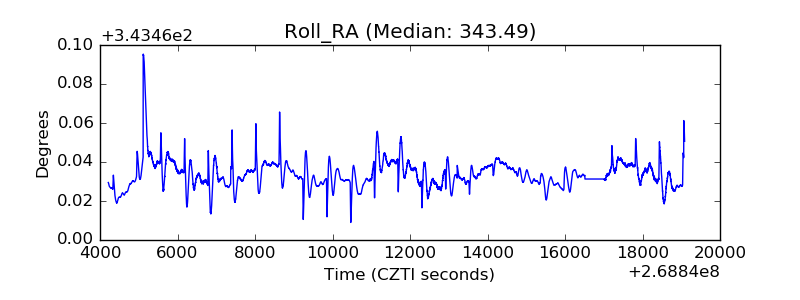 |
| Veto Counter | 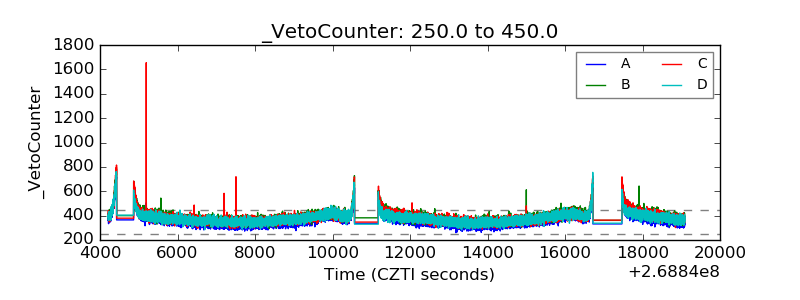 |