| Param | Original file | Final file |
|---|---|---|
| Filename | modeM0/AS1A04_218T03_9000002214_15035cztM0_level2.evt | modeM0/AS1A04_218T03_9000002214_15035cztM0_level2_quad_clean.evt |
| Size (bytes) | 461,560,320 | 99,636,480 |
| Size | 440.2 MB | 95.0 MB |
| Events in quadrant A | 3,439,953 | 640,016 |
| Events in quadrant B | 3,375,802 | 657,247 |
| Events in quadrant C | 3,495,413 | 645,978 |
| Events in quadrant D | 3,222,331 | 617,705 |
| Mode M9 | |||
|---|---|---|---|
| Quadrant | BADHDUFLAG | Total packets | Discarded packets |
| A | 0 | 23 | 0 |
| B | 0 | 23 | 0 |
| C | 0 | 23 | 0 |
| D | 0 | 23 | 0 |
| Mode SS | |||
|---|---|---|---|
| Quadrant | BADHDUFLAG | Total packets | Discarded packets |
| A | 0 | 134 | 0 |
| B | 0 | 134 | 0 |
| C | 0 | 134 | 0 |
| D | 0 | 134 | 0 |
| Mode M0 | |||
|---|---|---|---|
| Quadrant | BADHDUFLAG | Total packets | Discarded packets |
| A | 0 | 14381 | 3 |
| B | 0 | 14217 | 2 |
| C | 0 | 14389 | 2 |
| D | 0 | 14017 | 2 |
| Quadrant | Total seconds | Saturated seconds | Saturation percentage |
|---|---|---|---|
| A | 6551 | 28 | 0.427416% |
| B | 6551 | 45 | 0.686918% |
| C | 6551 | 34 | 0.519005% |
| D | 6551 | 53 | 0.809037% |
Noise dominated data is calculated using 1-second bins in cleaned event files. If a bin has >2000 counts, and if more than 50% of those come from <1% of pixels, then it is considered to be noise-dominated and hence unusable.
| Quadrant | # 1 sec bins | Bins with >0 counts | Bins with >2000 counts | High rate bins dominated by noise | Noise dominated (total time) | Noise dominated (detector-on time) | Marked lightcurve |
|---|---|---|---|---|---|---|---|
| A | 8817 | 6554 | 1 | 1 | 0.01% | 0.02% | 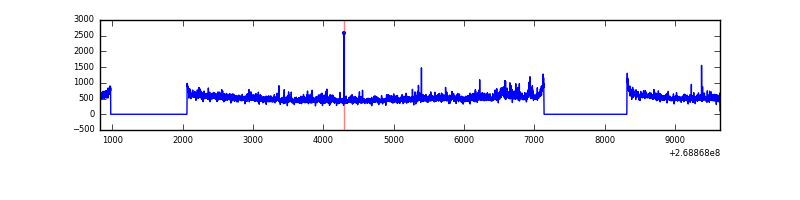 |
| B | 8817 | 6554 | 7 | 7 | 0.08% | 0.11% | 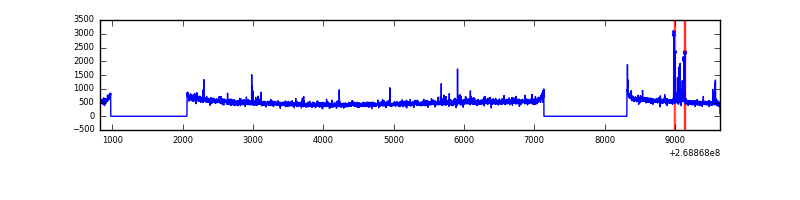 |
| C | 8817 | 6554 | 0 | 0 | 0.00% | 0.00% | 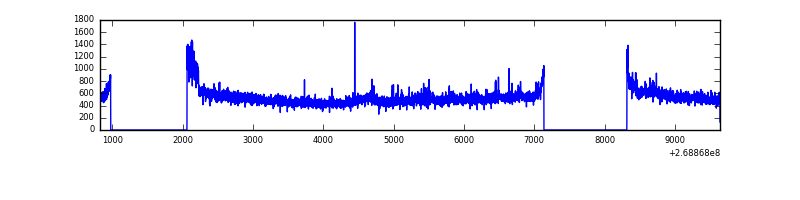 |
| D | 8817 | 6554 | 19 | 19 | 0.22% | 0.29% | 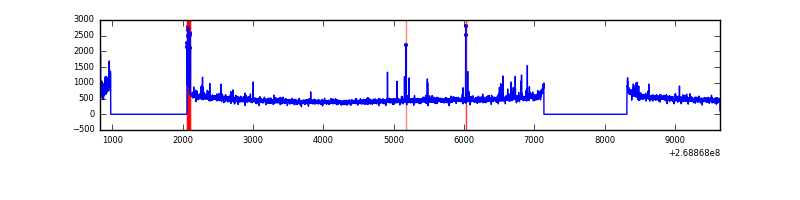 |
Top three noisy pixels from each quadrant. If the there are fewer than three noisy pixels in the level2.evt file, extra rows are filled as -1
| Pixel properties | Quadrant properties | ||||||
|---|---|---|---|---|---|---|---|
| Quadrant | DetID | PixID | Counts | Sigma | Mean | Median | Sigma |
| A | 12 | 189 | 90712 | 543.66 | 822 | 805 | 165.4 |
| A | 1 | 162 | 85769 | 513.77 | 822 | 805 | 165.4 |
| A | 1 | 178 | 39472 | 233.82 | 822 | 805 | 165.4 |
| B | 10 | 16 | 42484 | 265.77 | 827 | 808 | 156.8 |
| B | 4 | 173 | 32801 | 204.02 | 827 | 808 | 156.8 |
| B | 0 | 229 | 31161 | 193.56 | 827 | 808 | 156.8 |
| C | 3 | 233 | 326827 | 1726.37 | 812 | 817 | 188.8 |
| C | 13 | 61 | 5761 | 26.18 | 812 | 817 | 188.8 |
| C | 10 | 22 | 3354 | 13.43 | 812 | 817 | 188.8 |
| D | 2 | 136 | 118138 | 603.24 | 804 | 781 | 194.5 |
| D | 2 | 234 | 22520 | 111.74 | 804 | 781 | 194.5 |
| D | 2 | 152 | 14528 | 70.66 | 804 | 781 | 194.5 |
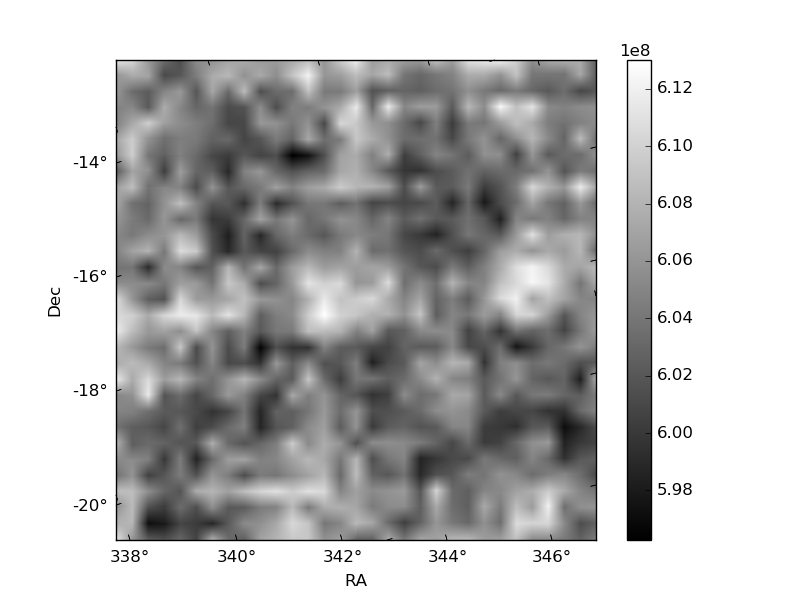
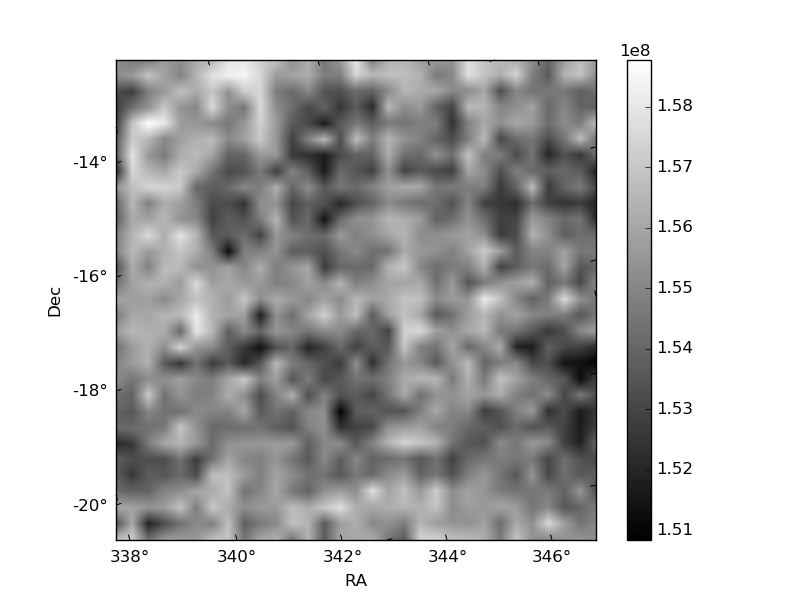
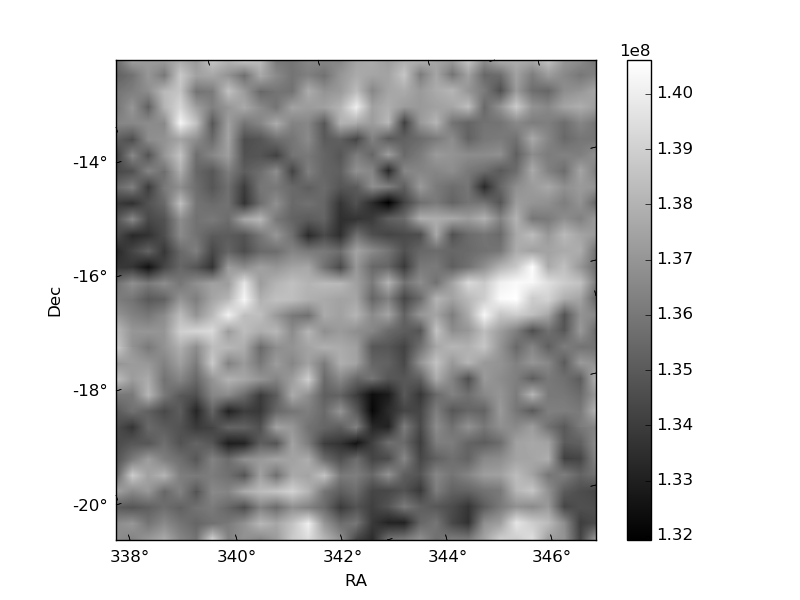
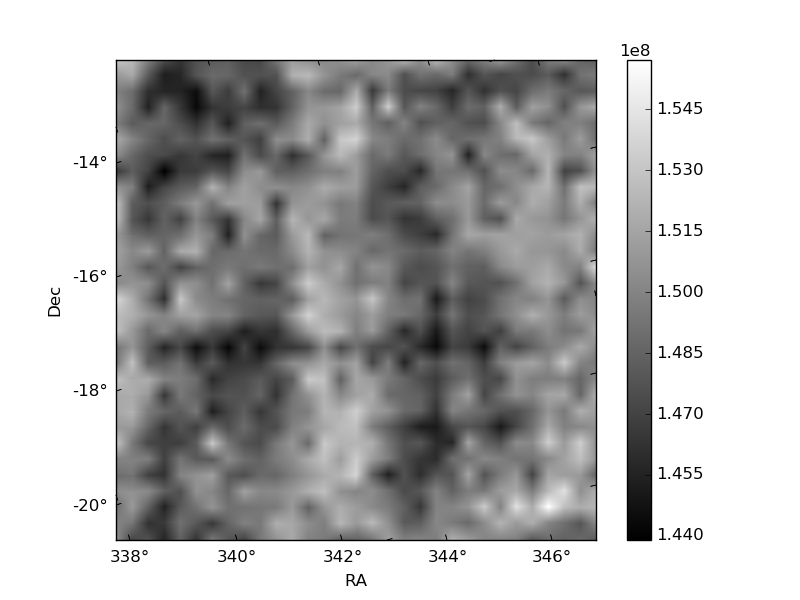
Histogram calculated using DETX and DETY for each event in the final _common_clean file
| Quadrant A | 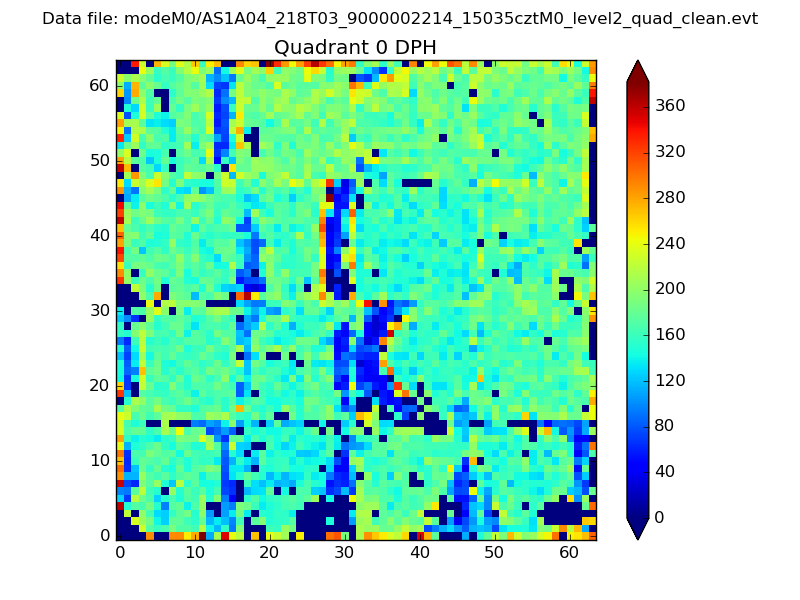 |
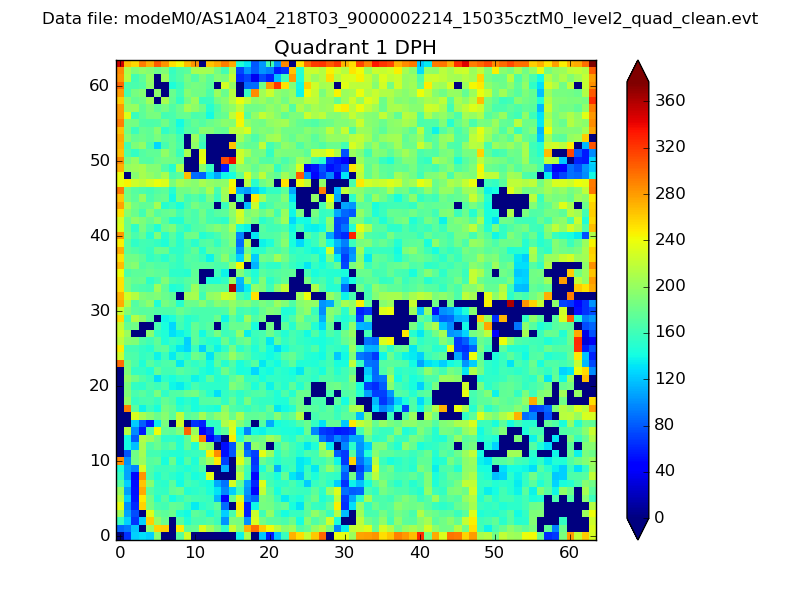 |
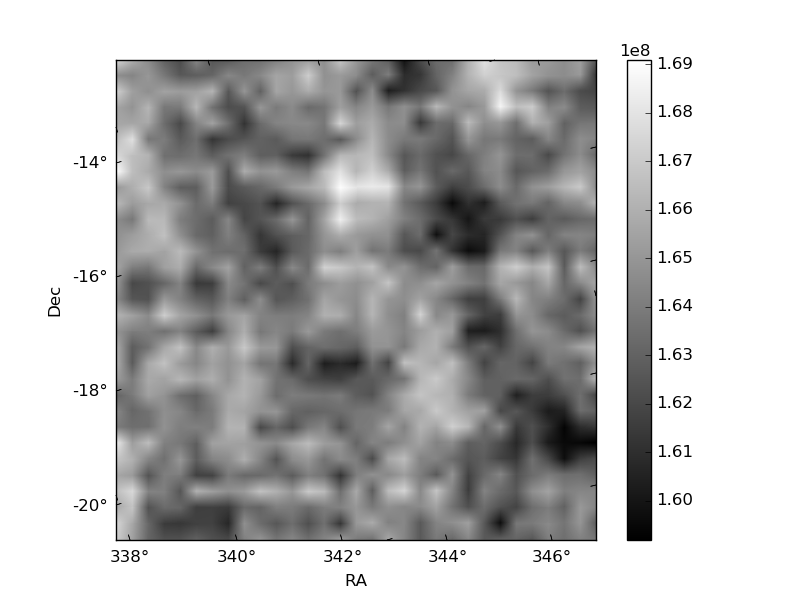
Quadrant B |
|---|---|---|---|
| Quadrant D | 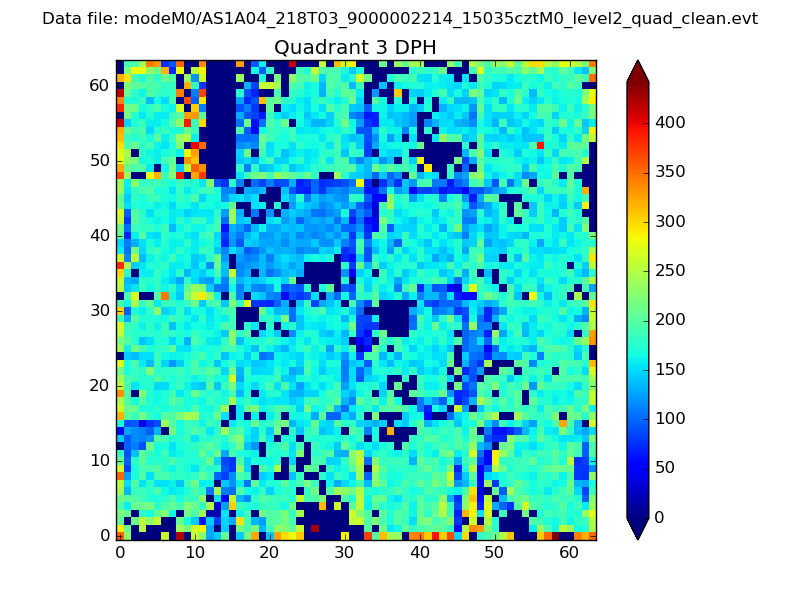 |
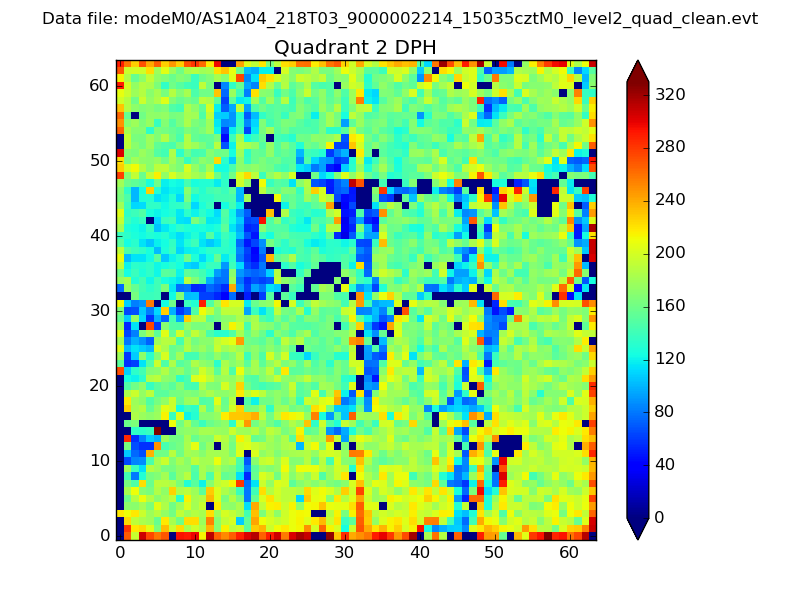 |
Quadrant C |
| Plot type | Count rate plots | Images |
|---|---|---|
| Comparison with Poisson distribution Blue bars denote a histogram of data divided into 1 sec bins. Red curve is a Poisson curve with rate = median count rate of data. |
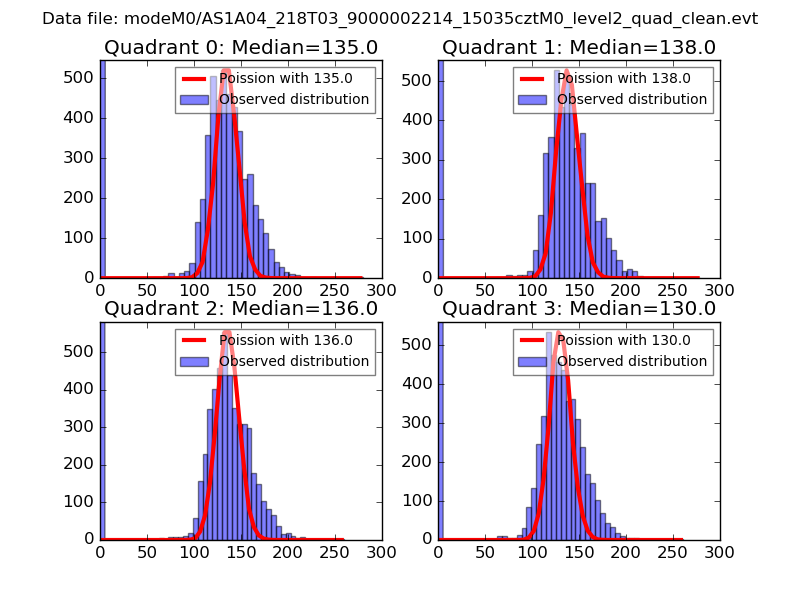 |
 |
| Quadrant-wise count rates Data is divided into 100 sec bins |
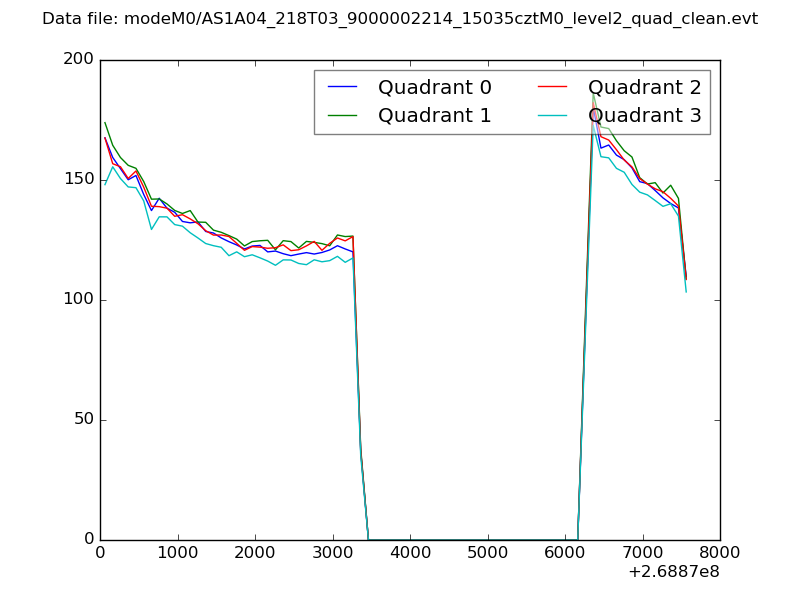 |
|
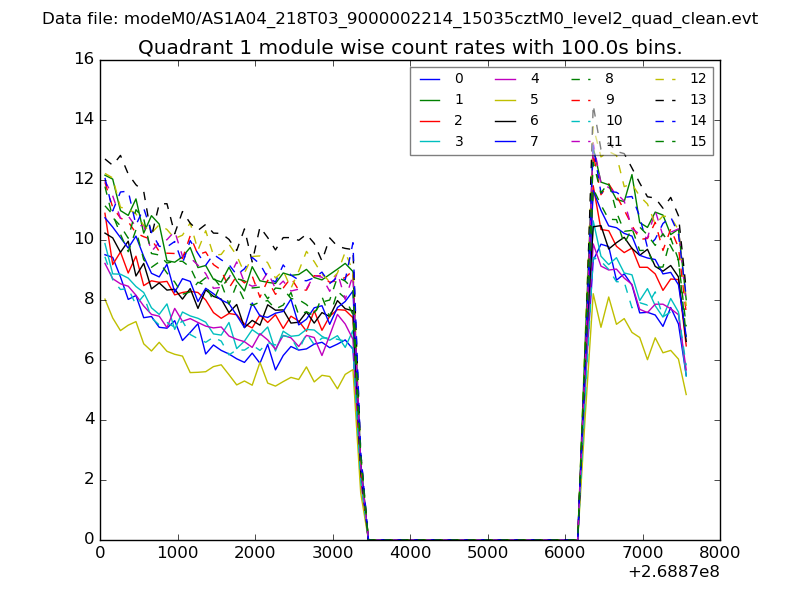
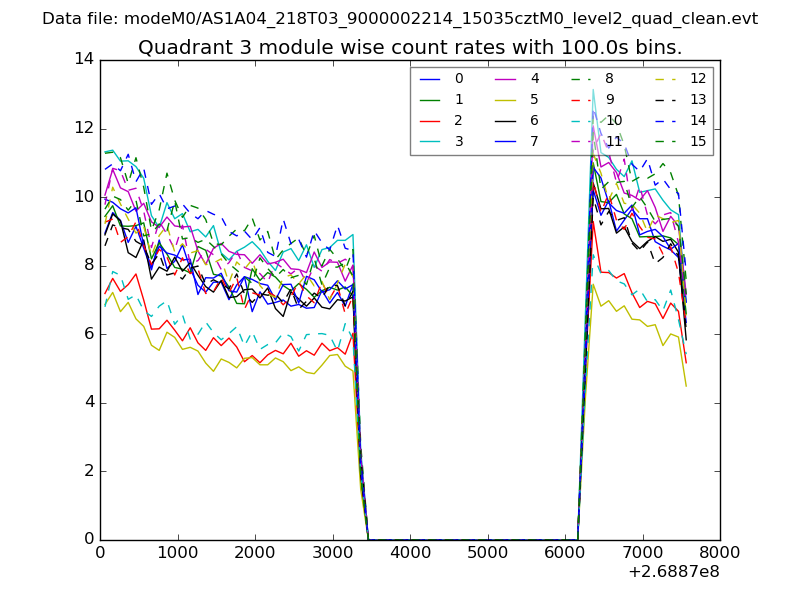
| Module-wise count rates for Quadrant A Data is divided into 100 sec bins |
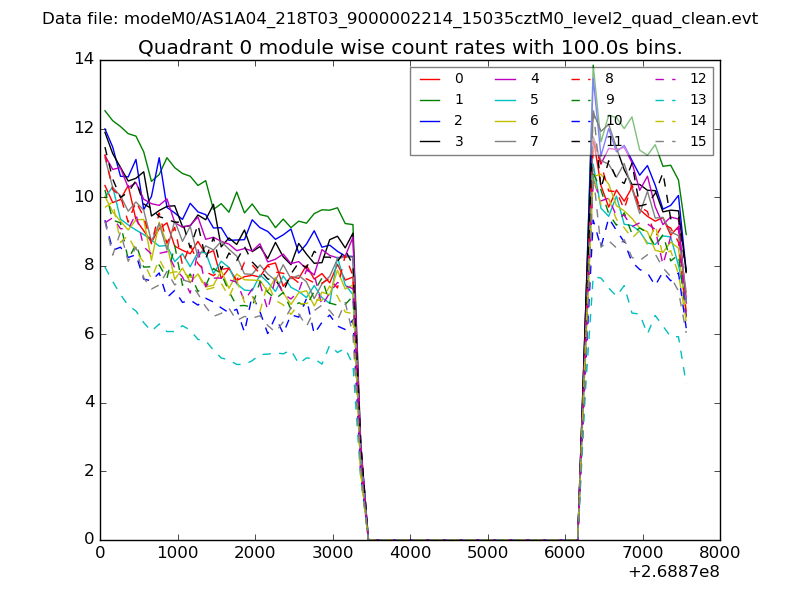 |
 |
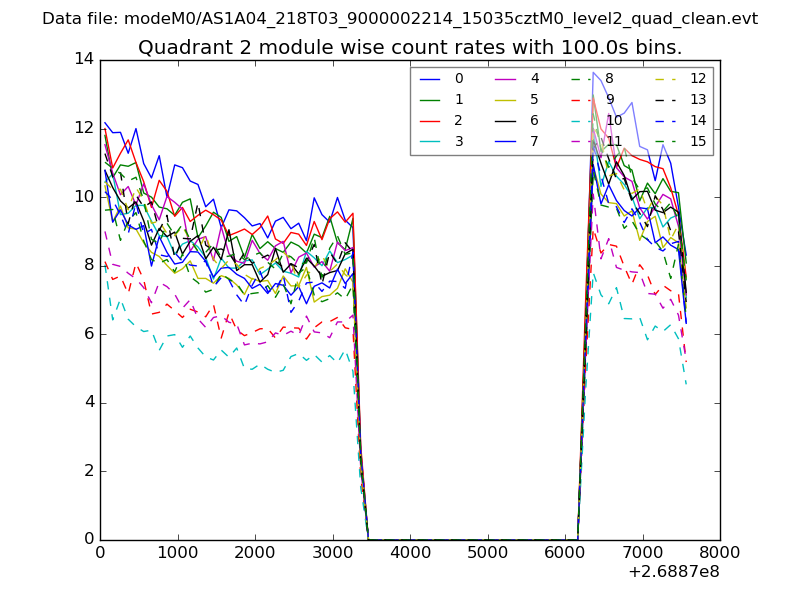
| Module-wise count rates for Quadrant B Data is divided into 100 sec bins |
 |
 |
| Module-wise count rates for Quadrant C Data is divided into 100 sec bins |
 |
 |
| Module-wise count rates for Quadrant D Data is divided into 100 sec bins |
 |
 |
| Parameter | Plot |
|---|---|
| CZT HV Monitor | 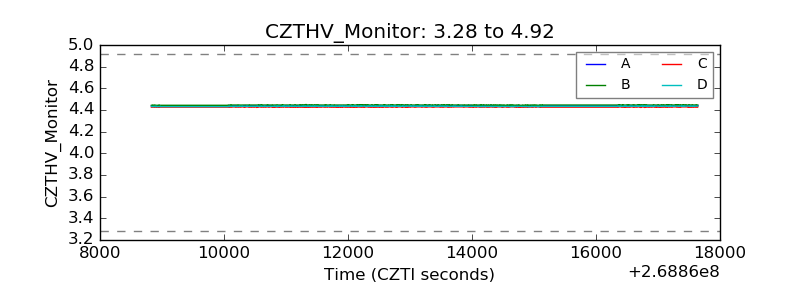 |
| D_VDD | 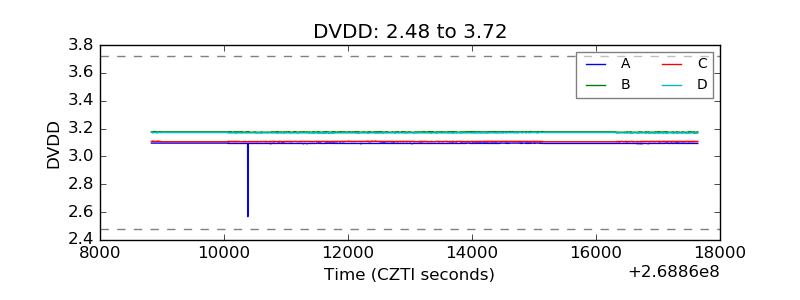 |
| Temperature 1 | 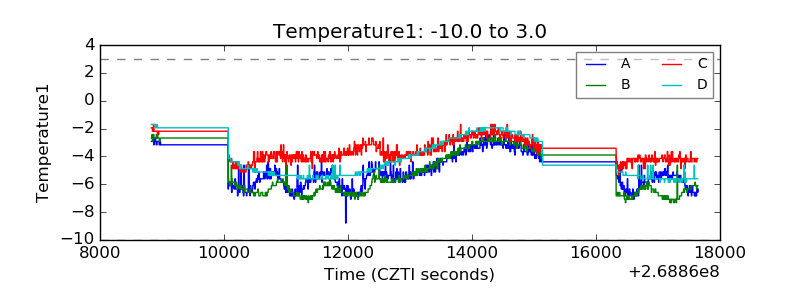 |
| Veto HV Monitor | 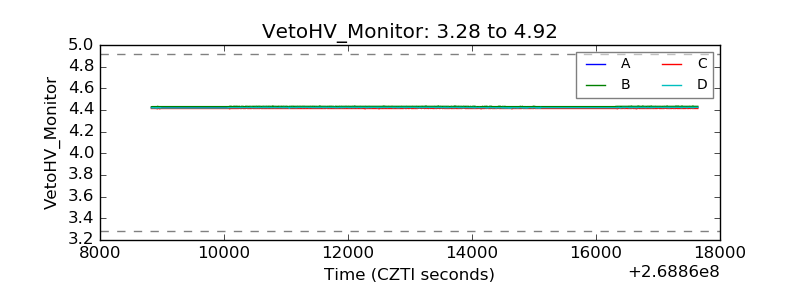 |
| Veto LLD | 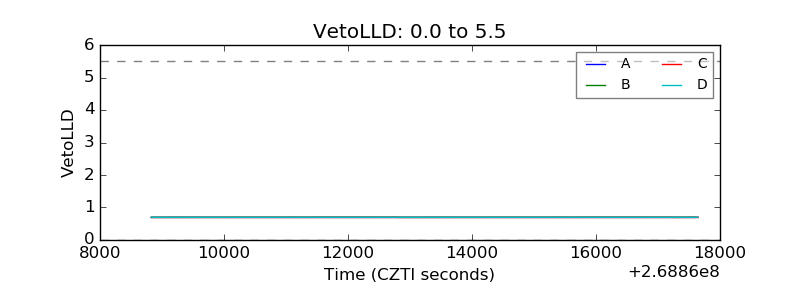 |
| Alpha Counter | 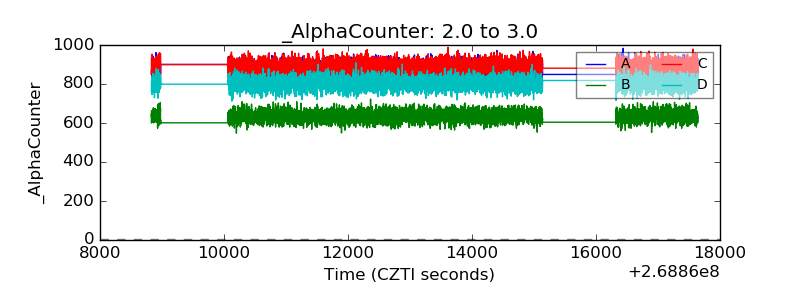 |
| _CPM_Rate | 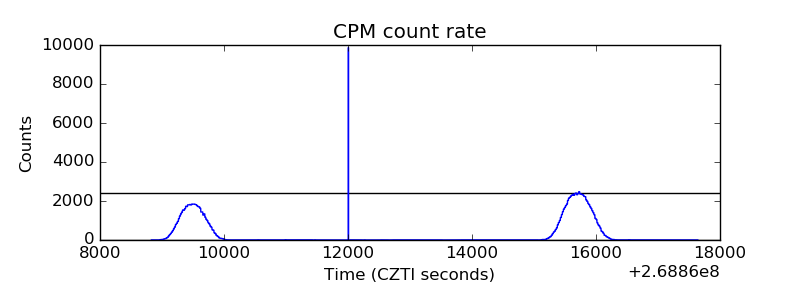 |
| CZT Counter |  |
| +2.5 Volts monitor |  |
| +5 Volts monitor | 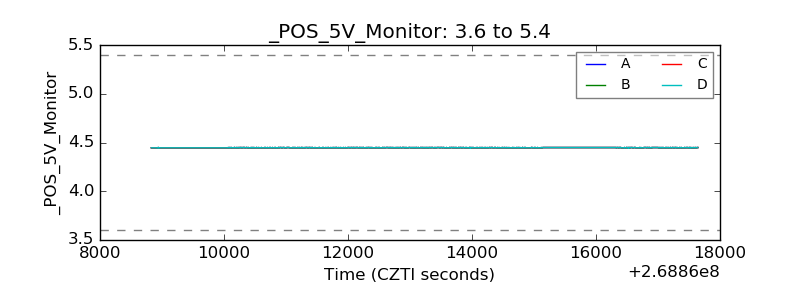 |
| _ROLL_ROT | 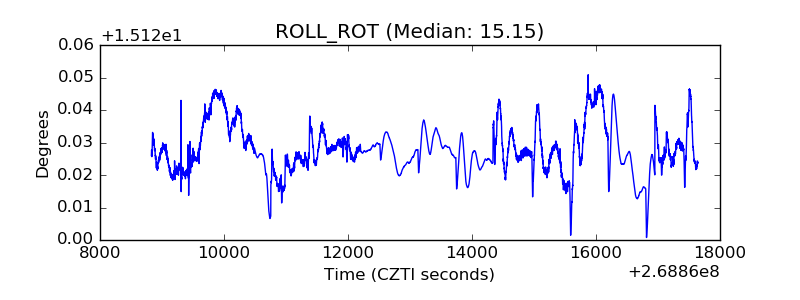 |
| _Roll_DEC | 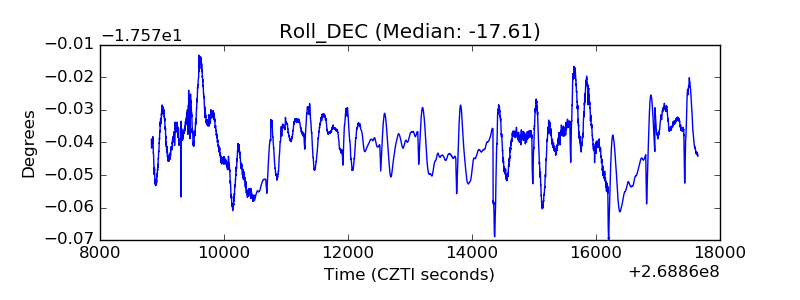 |
| _Roll_RA | 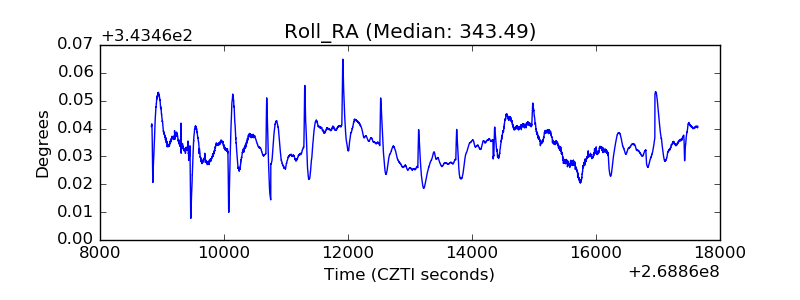 |
| Veto Counter | 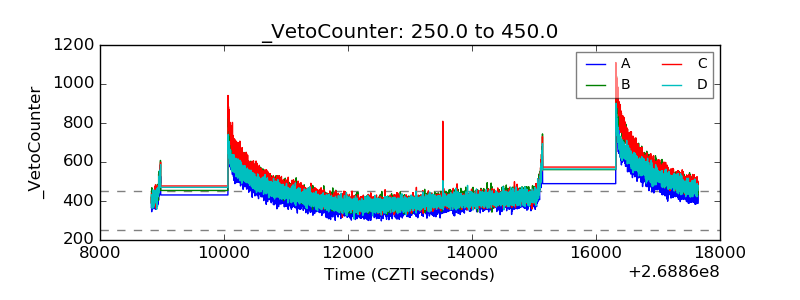 |