| Param | Original file | Final file |
|---|---|---|
| Filename | modeM0/AS1A04_218T03_9000002214_15037cztM0_level2.evt | modeM0/AS1A04_218T03_9000002214_15037cztM0_level2_quad_clean.evt |
| Size (bytes) | 204,986,880 | 61,090,560 |
| Size | 195.5 MB | 58.3 MB |
| Events in quadrant A | 1,529,960 | 407,198 |
| Events in quadrant B | 1,539,151 | 420,376 |
| Events in quadrant C | 1,542,335 | 413,618 |
| Events in quadrant D | 1,391,781 | 396,198 |
| Mode M9 | |||
|---|---|---|---|
| Quadrant | BADHDUFLAG | Total packets | Discarded packets |
| A | 0 | 9 | 0 |
| B | 0 | 9 | 0 |
| C | 0 | 9 | 0 |
| D | 0 | 10 | 0 |
| Mode SS | |||
|---|---|---|---|
| Quadrant | BADHDUFLAG | Total packets | Discarded packets |
| A | 0 | 60 | 0 |
| B | 0 | 60 | 0 |
| C | 0 | 60 | 0 |
| D | 0 | 60 | 0 |
| Mode M0 | |||
|---|---|---|---|
| Quadrant | BADHDUFLAG | Total packets | Discarded packets |
| A | 0 | 6415 | 1 |
| B | 0 | 6607 | 1 |
| C | 0 | 6432 | 1 |
| D | 0 | 6194 | 1 |
| Quadrant | Total seconds | Saturated seconds | Saturation percentage |
|---|---|---|---|
| A | 2981 | 6 | 0.201275% |
| B | 2981 | 20 | 0.670916% |
| C | 2981 | 6 | 0.201275% |
| D | 2981 | 1 | 0.033546% |
Noise dominated data is calculated using 1-second bins in cleaned event files. If a bin has >2000 counts, and if more than 50% of those come from <1% of pixels, then it is considered to be noise-dominated and hence unusable.
| Quadrant | # 1 sec bins | Bins with >0 counts | Bins with >2000 counts | High rate bins dominated by noise | Noise dominated (total time) | Noise dominated (detector-on time) | Marked lightcurve |
|---|---|---|---|---|---|---|---|
| A | 2982 | 2982 | 0 | 0 | 0.00% | 0.00% | 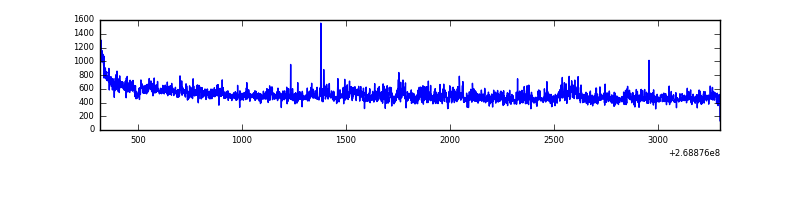 |
| B | 2982 | 2982 | 10 | 10 | 0.34% | 0.34% | 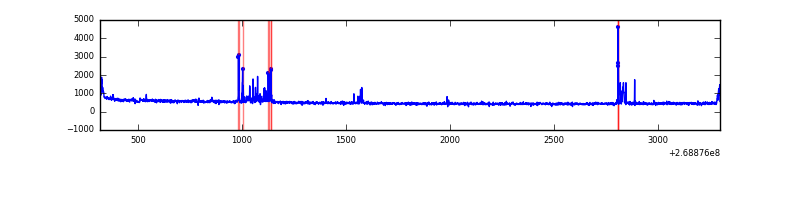 |
| C | 2982 | 2982 | 0 | 0 | 0.00% | 0.00% |  |
| D | 2982 | 2982 | 1 | 1 | 0.03% | 0.03% | 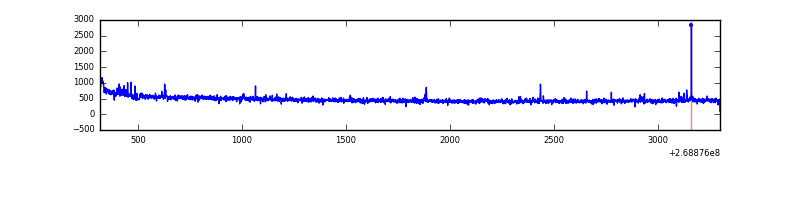 |
Top three noisy pixels from each quadrant. If the there are fewer than three noisy pixels in the level2.evt file, extra rows are filled as -1
| Pixel properties | Quadrant properties | ||||||
|---|---|---|---|---|---|---|---|
| Quadrant | DetID | PixID | Counts | Sigma | Mean | Median | Sigma |
| A | 1 | 162 | 47421 | 637.86 | 363 | 357 | 73.8 |
| A | 1 | 178 | 23883 | 318.85 | 363 | 357 | 73.8 |
| A | 12 | 189 | 22027 | 293.69 | 363 | 357 | 73.8 |
| B | 10 | 16 | 67920 | 965.82 | 368 | 359 | 70.0 |
| B | 0 | 229 | 23137 | 325.62 | 368 | 359 | 70.0 |
| B | 4 | 173 | 8369 | 114.5 | 368 | 359 | 70.0 |
| C | 3 | 233 | 119740 | 1406.07 | 364 | 367 | 84.9 |
| C | 13 | 61 | 2453 | 24.57 | 364 | 367 | 84.9 |
| C | 3 | 232 | 1457 | 12.84 | 364 | 367 | 84.9 |
| D | 13 | 249 | 14263 | 159.22 | 360 | 351 | 87.4 |
| D | 10 | 70 | 11203 | 124.2 | 360 | 351 | 87.4 |
| D | 2 | 234 | 9268 | 102.05 | 360 | 351 | 87.4 |
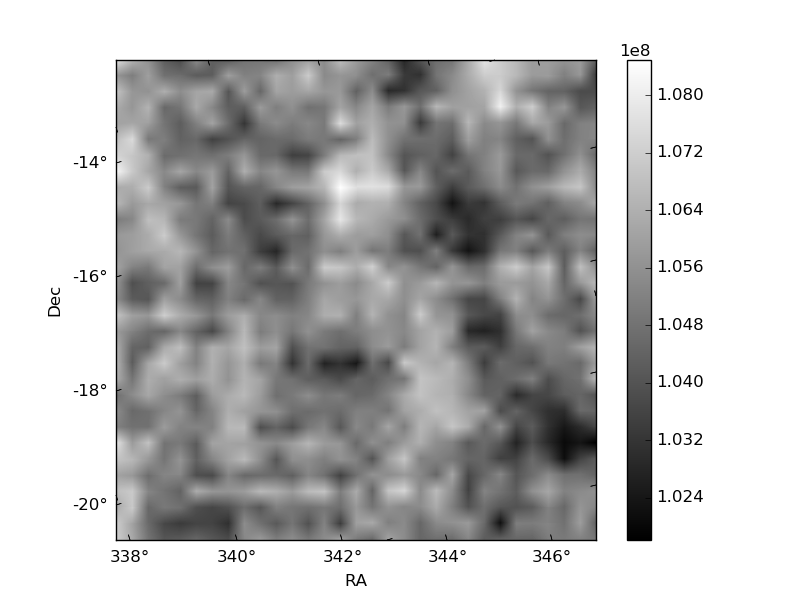
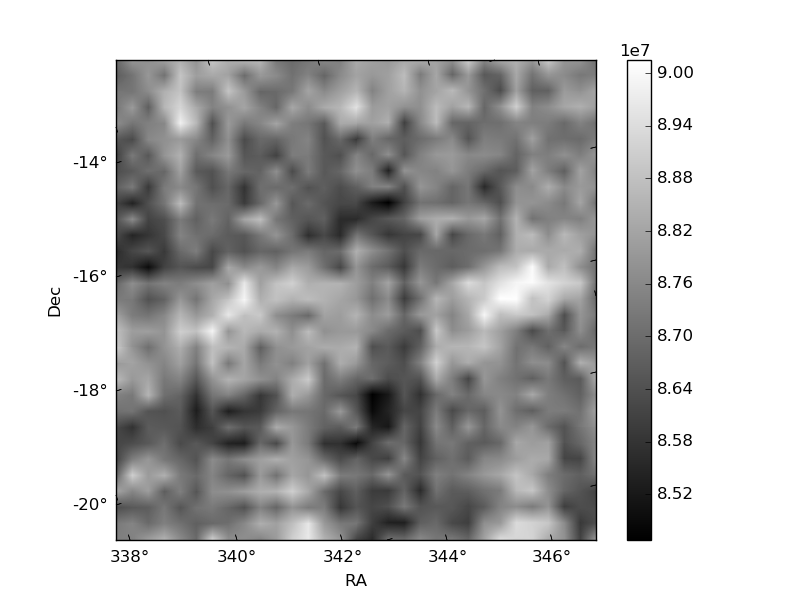
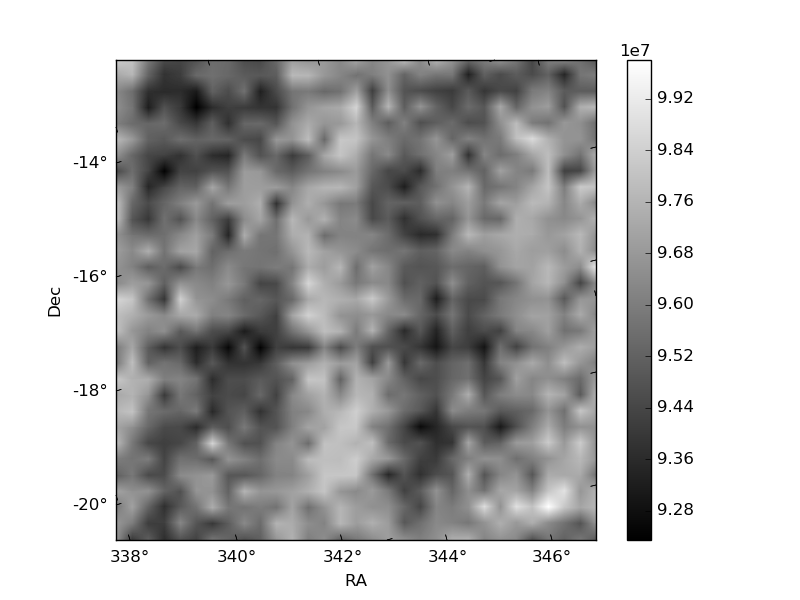
Histogram calculated using DETX and DETY for each event in the final _common_clean file
| Quadrant A |  |
 |
Quadrant B |
|---|---|---|---|
| Quadrant D | 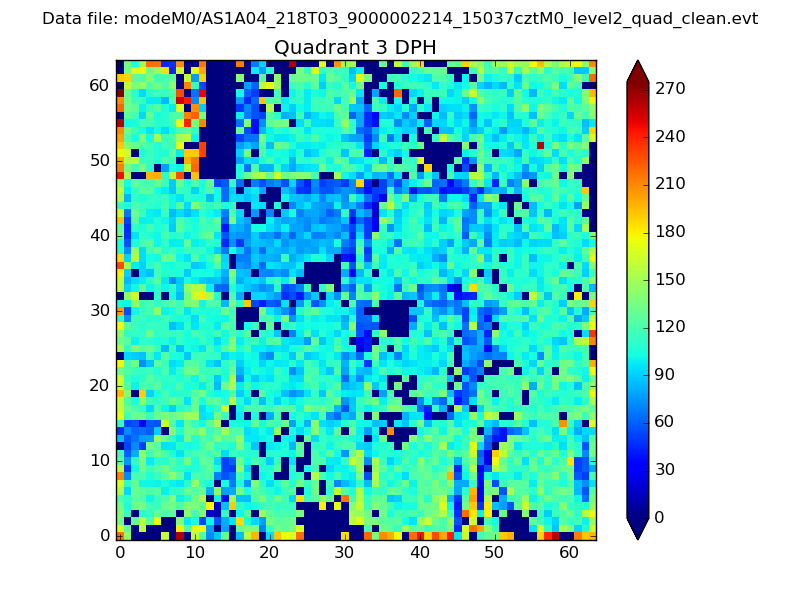 |
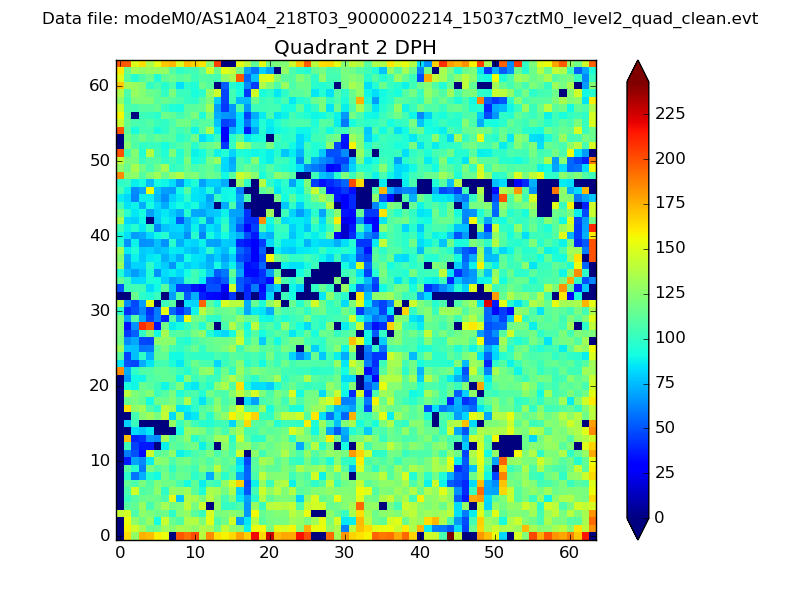 |
Quadrant C |
| Plot type | Count rate plots | Images |
|---|---|---|
| Comparison with Poisson distribution Blue bars denote a histogram of data divided into 1 sec bins. Red curve is a Poisson curve with rate = median count rate of data. |
 |
 |
| Quadrant-wise count rates Data is divided into 100 sec bins |
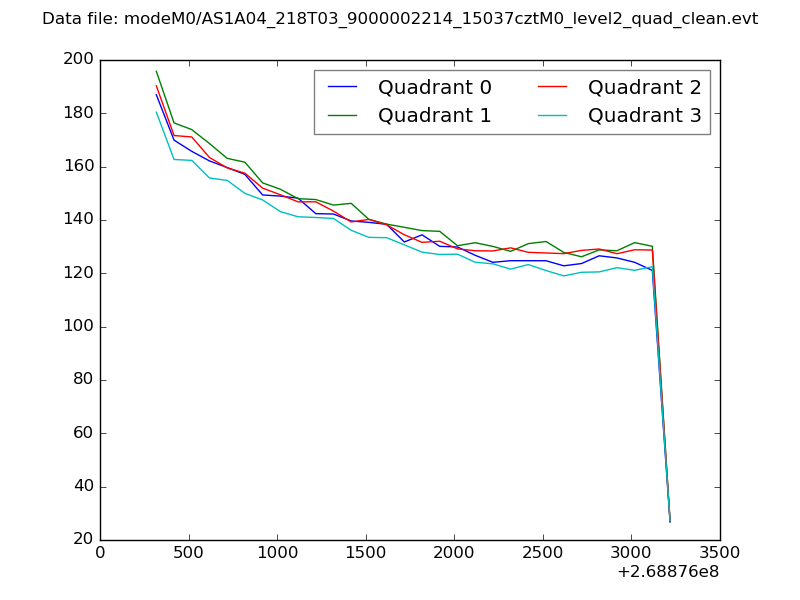 |
|
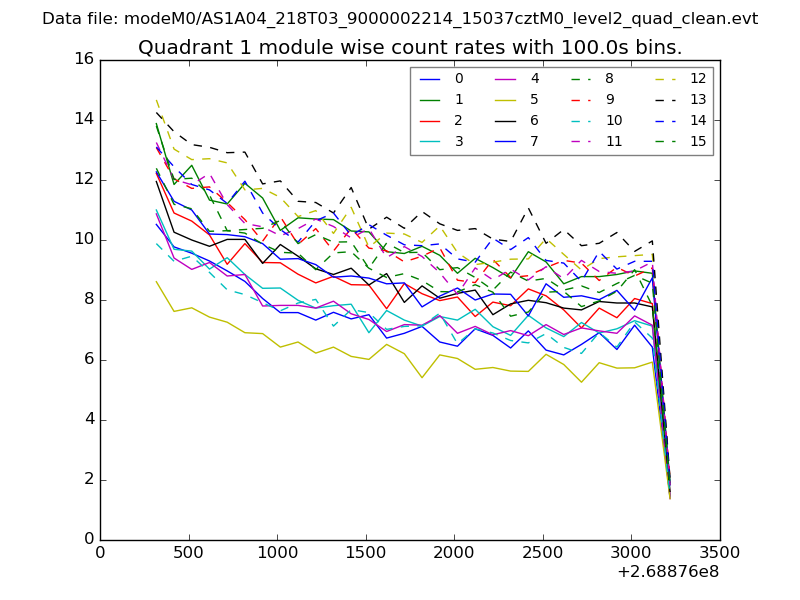
| Module-wise count rates for Quadrant A Data is divided into 100 sec bins |
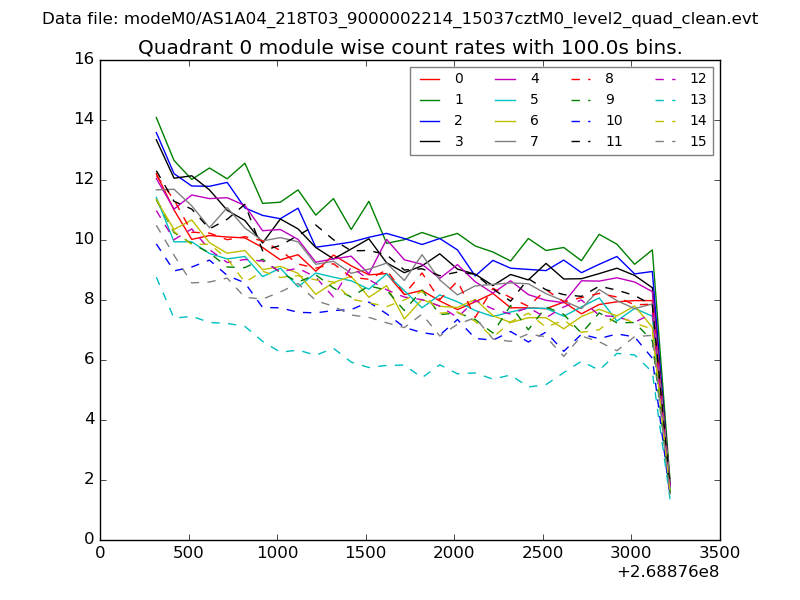 |
 |
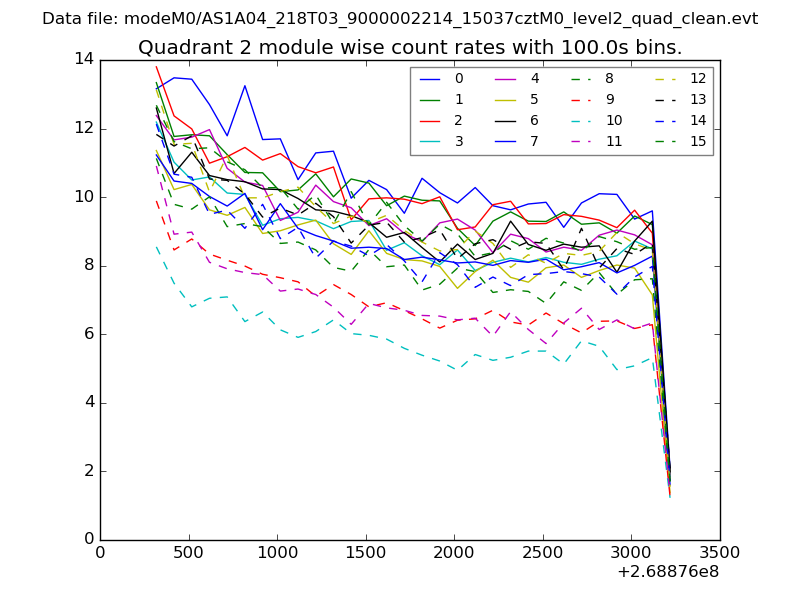
| Module-wise count rates for Quadrant B Data is divided into 100 sec bins |
 |
 |
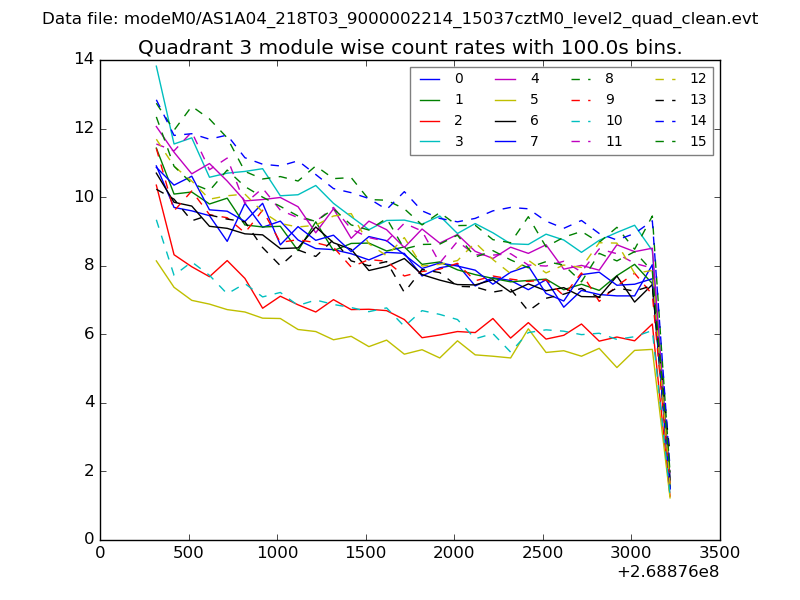
| Module-wise count rates for Quadrant C Data is divided into 100 sec bins |
 |
 |
| Module-wise count rates for Quadrant D Data is divided into 100 sec bins |
 |
 |
| Parameter | Plot |
|---|---|
| CZT HV Monitor | 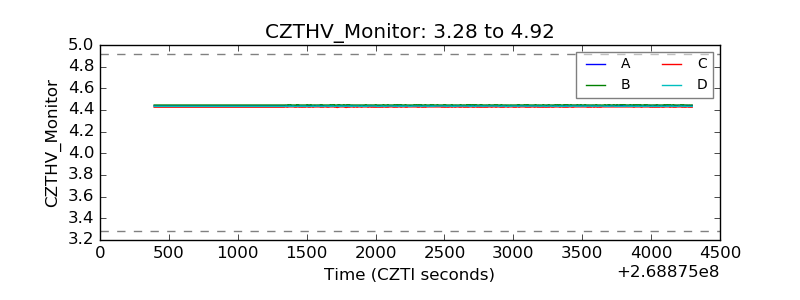 |
| D_VDD | 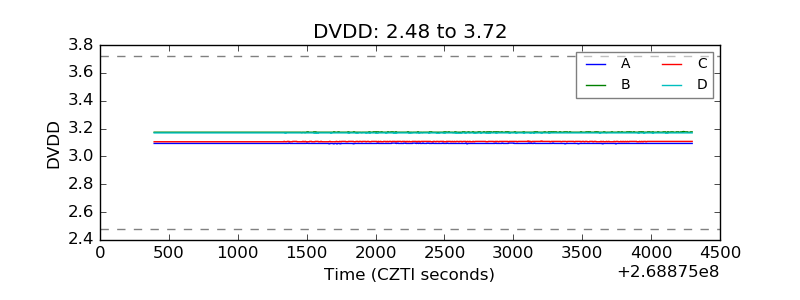 |
| Temperature 1 | 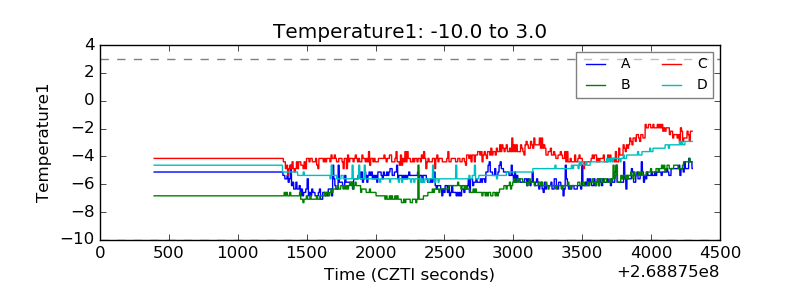 |
| Veto HV Monitor | 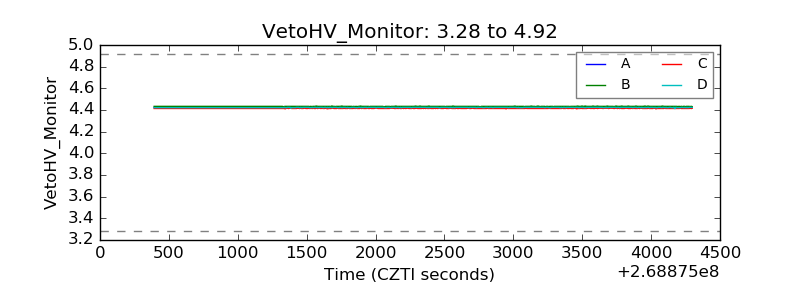 |
| Veto LLD | 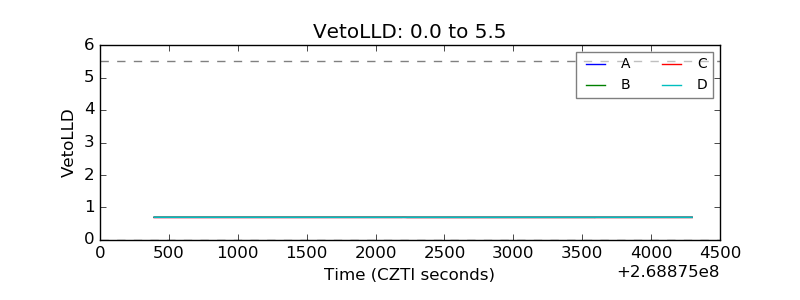 |
| Alpha Counter | 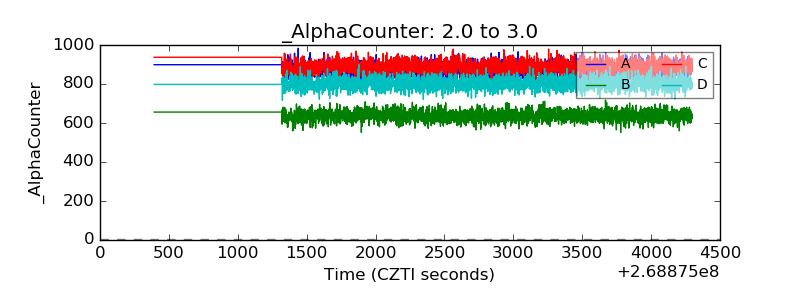 |
| _CPM_Rate | 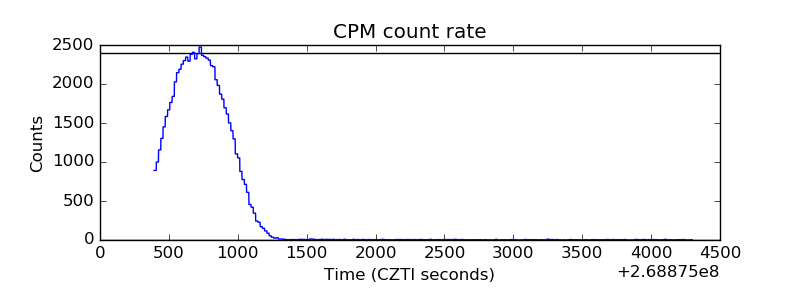 |
| CZT Counter | 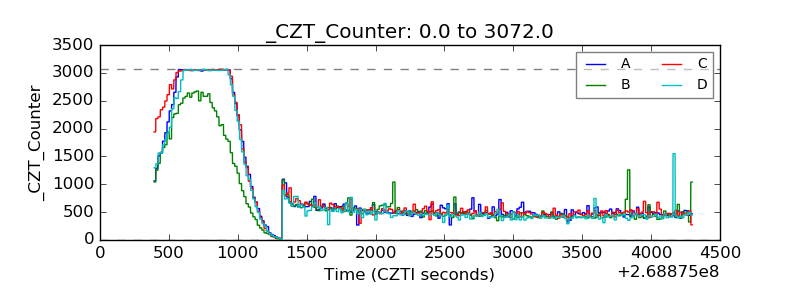 |
| +2.5 Volts monitor |  |
| +5 Volts monitor | 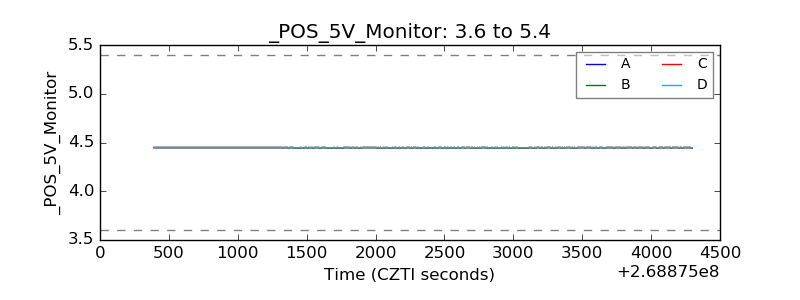 |
| _ROLL_ROT | 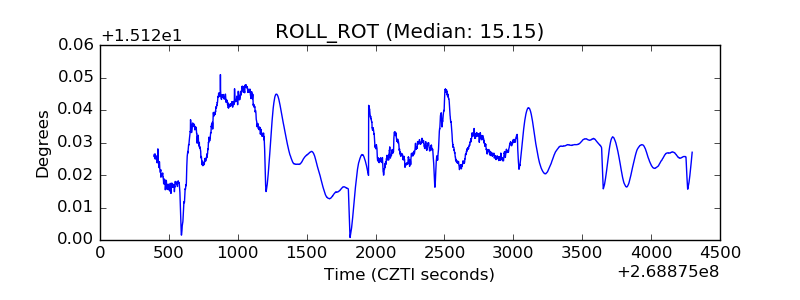 |
| _Roll_DEC | 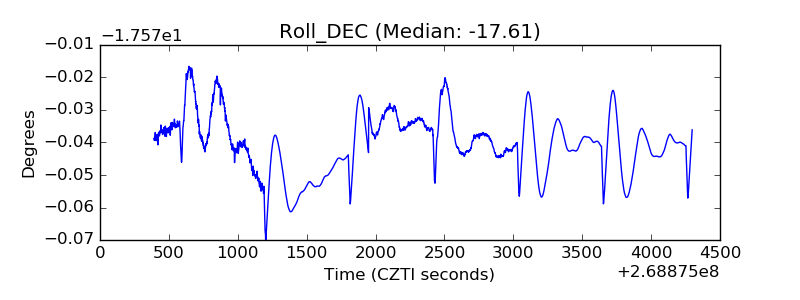 |
| _Roll_RA | 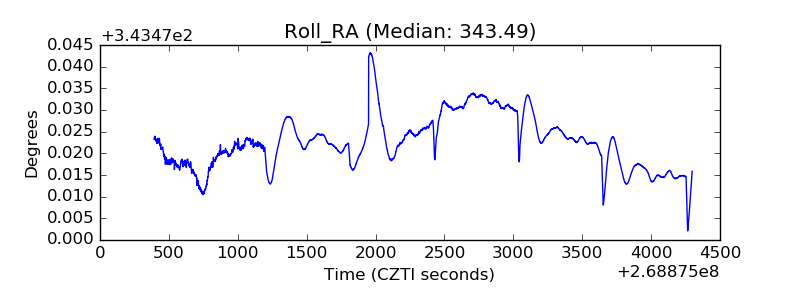 |
| Veto Counter | 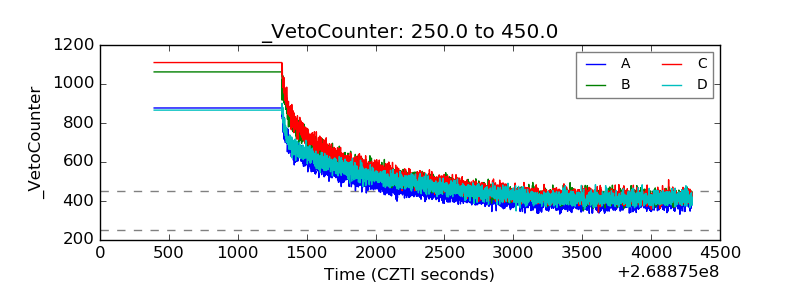 |