| Param | Original file | Final file |
|---|---|---|
| Filename | modeM0/AS1T02_060T01_9000002216cztM0_level2.fits | modeM0/AS1T02_060T01_9000002216cztM0_level2_quad_clean.evt |
| Size (bytes) | 1,972,679,040 | 1,727,519,040 |
| Size | 1.8 GB | 1.6 GB |
| Events in quadrant A | 12,124,948 | 10,104,691 |
| Events in quadrant B | 11,667,902 | 10,140,553 |
| Events in quadrant C | 11,743,668 | 9,442,020 |
| Events in quadrant D | 10,218,796 | 8,645,526 |
| Mode M0 | |||
|---|---|---|---|
| Quadrant | BADHDUFLAG | Total packets | Discarded packets |
| A | 0 | 432616 | 0 |
| B | 0 | 457942 | 0 |
| C | 0 | 500529 | 0 |
| D | 0 | 456206 | 0 |
| Mode M9 | |||
|---|---|---|---|
| Quadrant | BADHDUFLAG | Total packets | Discarded packets |
| A | 0 | 323 | 0 |
| B | 0 | 323 | 0 |
| C | 0 | 323 | 0 |
| D | 0 | 323 | 0 |
| Mode SS | |||
|---|---|---|---|
| Quadrant | BADHDUFLAG | Total packets | Discarded packets |
| A | 0 | 4162 | 0 |
| B | 0 | 4162 | 0 |
| C | 0 | 4162 | 0 |
| D | 0 | 4162 | 0 |
| Quadrant | Total seconds | Saturated seconds | Saturation percentage |
|---|---|---|---|
| A | 204169 | 2849 | 1.395413% |
| B | 204169 | 5241 | 2.566991% |
| C | 204169 | 3201 | 1.567819% |
| D | 204169 | 5755 | 2.818743% |
Noise dominated data is calculated using 1-second bins in cleaned event files. If a bin has >2000 counts, and if more than 50% of those come from <1% of pixels, then it is considered to be noise-dominated and hence unusable.
| Quadrant | # 1 sec bins | Bins with >0 counts | Bins with >2000 counts | High rate bins dominated by noise | Noise dominated (total time) | Noise dominated (detector-on time) | Marked lightcurve |
|---|---|---|---|---|---|---|---|
| A | 236484 | 204140 | 0 | 0 | 0.00% | 0.00% | 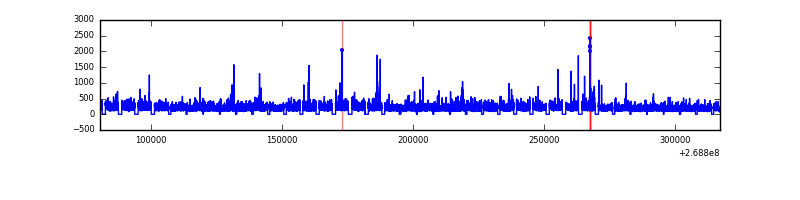 |
| B | 236484 | 204026 | 0 | 0 | 0.00% | 0.00% | 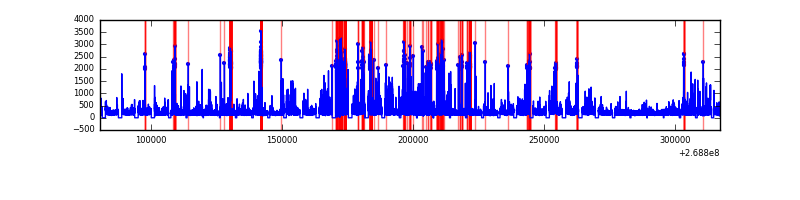 |
| C | 236484 | 204143 | 0 | 0 | 0.00% | 0.00% | 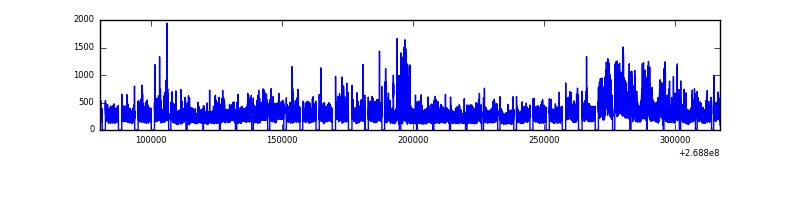 |
| D | 236484 | 203856 | 0 | 0 | 0.00% | 0.00% | 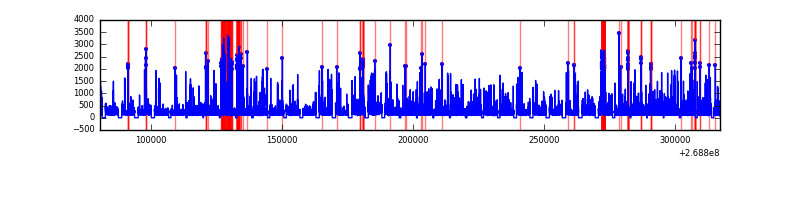 |
Top three noisy pixels from each quadrant. If the there are fewer than three noisy pixels in the level2.evt file, extra rows are filled as -1
| Pixel properties | Quadrant properties | ||||||
|---|---|---|---|---|---|---|---|
| Quadrant | DetID | PixID | Counts | Sigma | Mean | Median | Sigma |
| A | 0 | 29 | 11758 | 11.33 | 3151 | 2940 | 778.5 |
| A | 7 | 110 | 9828 | 8.85 | 3151 | 2940 | 778.5 |
| A | 15 | 236 | 9314 | 8.19 | 3151 | 2940 | 778.5 |
| B | 2 | 9 | 9918 | 11.59 | 3074 | 2924 | 603.4 |
| B | 3 | 17 | 7721 | 7.95 | 3074 | 2924 | 603.4 |
| B | 14 | 254 | 7638 | 7.81 | 3074 | 2924 | 603.4 |
| C | 12 | 241 | 8100 | 6.51 | 3104 | 2879 | 802.5 |
| C | 2 | 191 | 7807 | 6.14 | 3104 | 2879 | 802.5 |
| C | 3 | 126 | 7676 | 5.98 | 3104 | 2879 | 802.5 |
| D | 3 | 14 | 7423 | 6.1 | 2915 | 2646 | 782.5 |
| D | 6 | 231 | 7237 | 5.87 | 2915 | 2646 | 782.5 |
| D | 7 | 3 | 7120 | 5.72 | 2915 | 2646 | 782.5 |
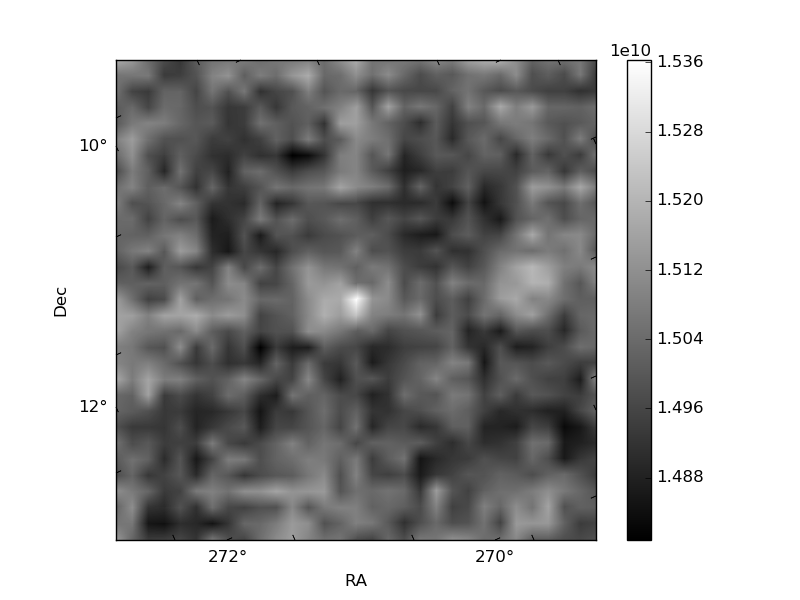
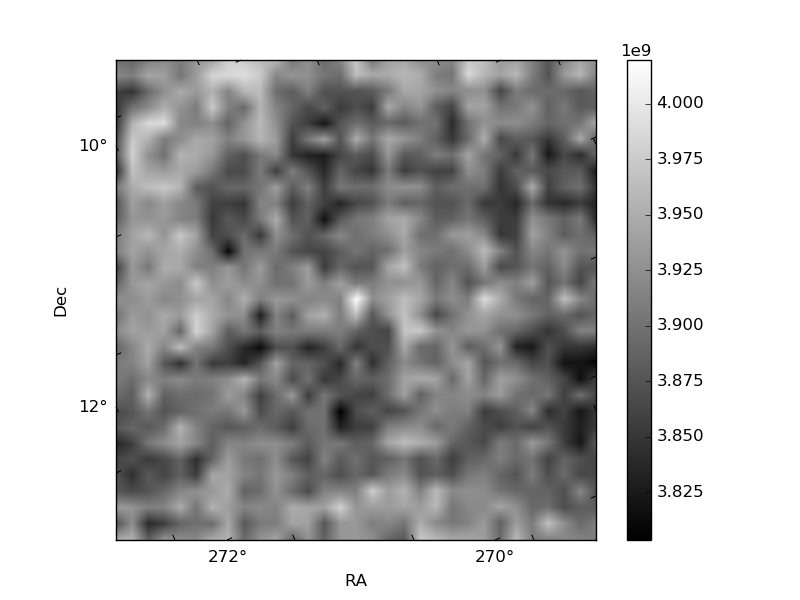
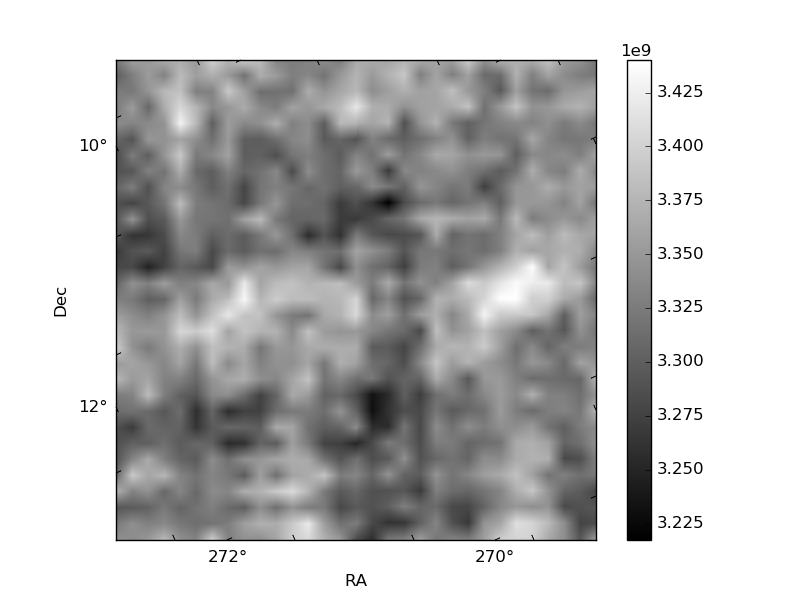
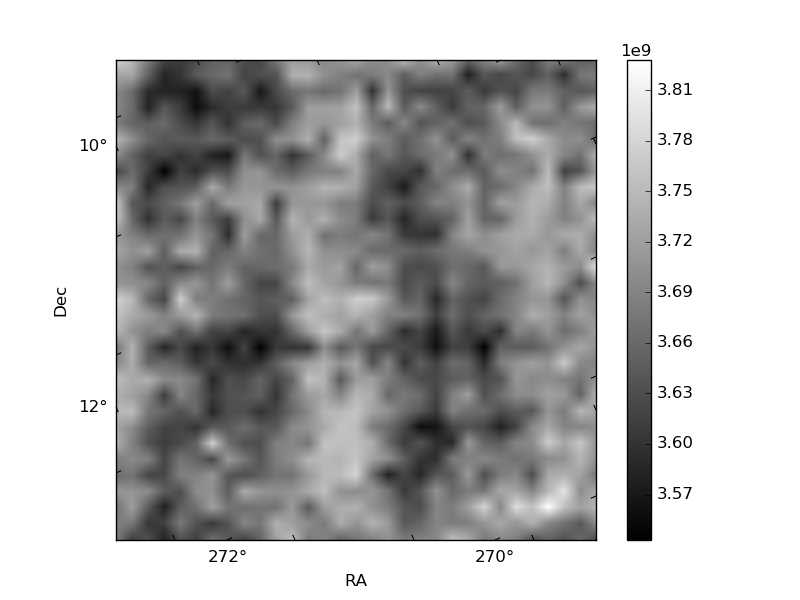
Histogram calculated using DETX and DETY for each event in the final _common_clean file
| Quadrant A | 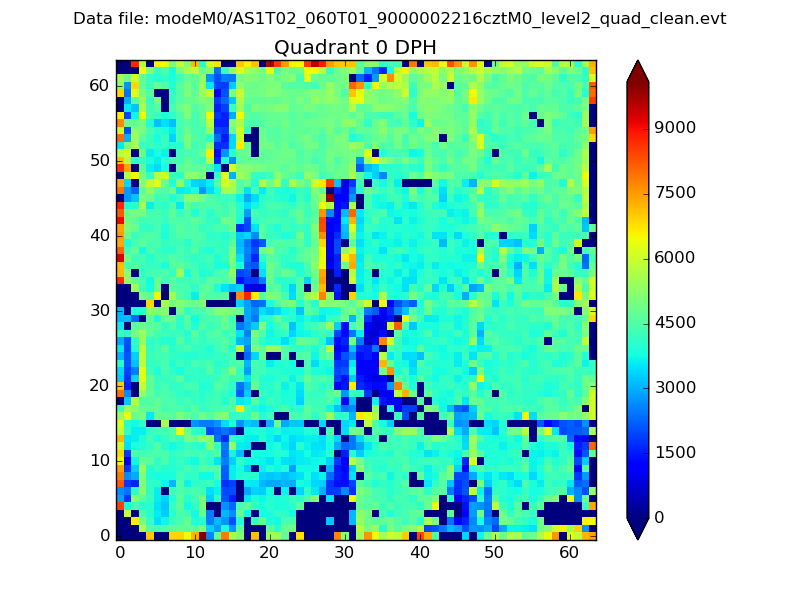 |
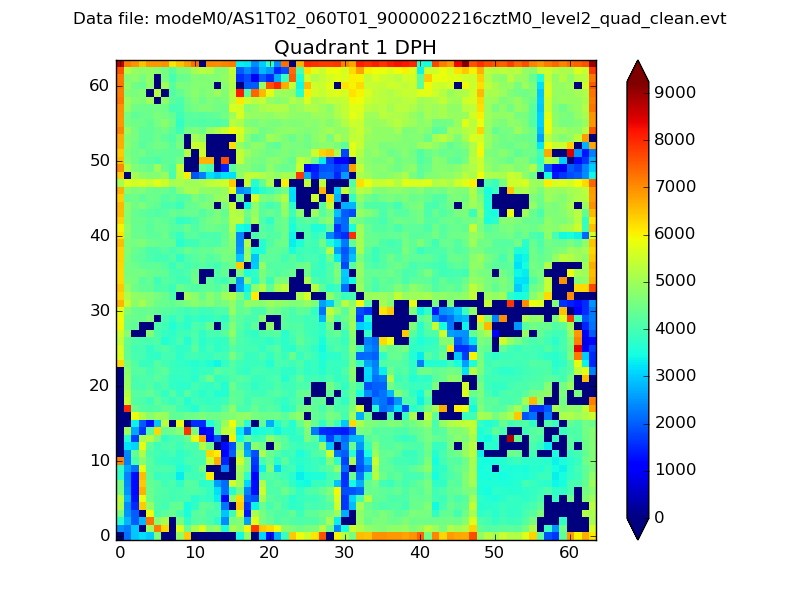 |
Quadrant B |
|---|---|---|---|
| Quadrant D | 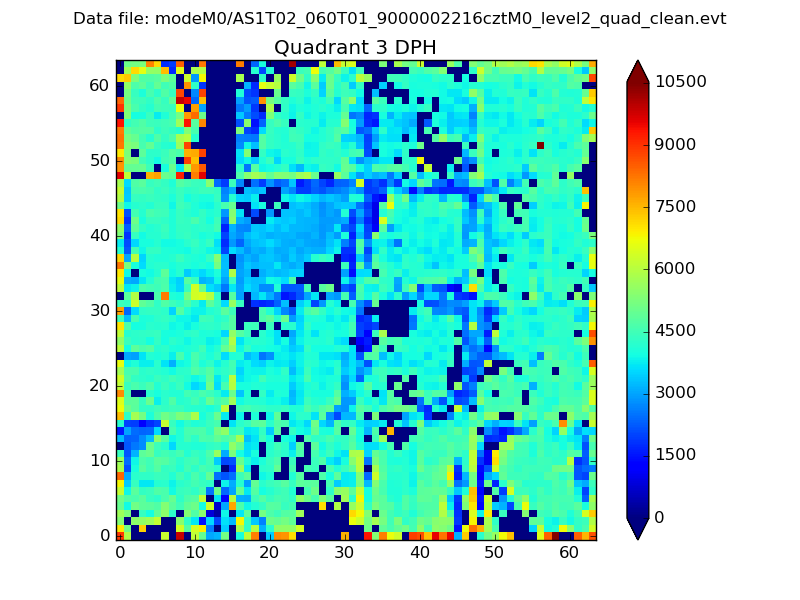 |
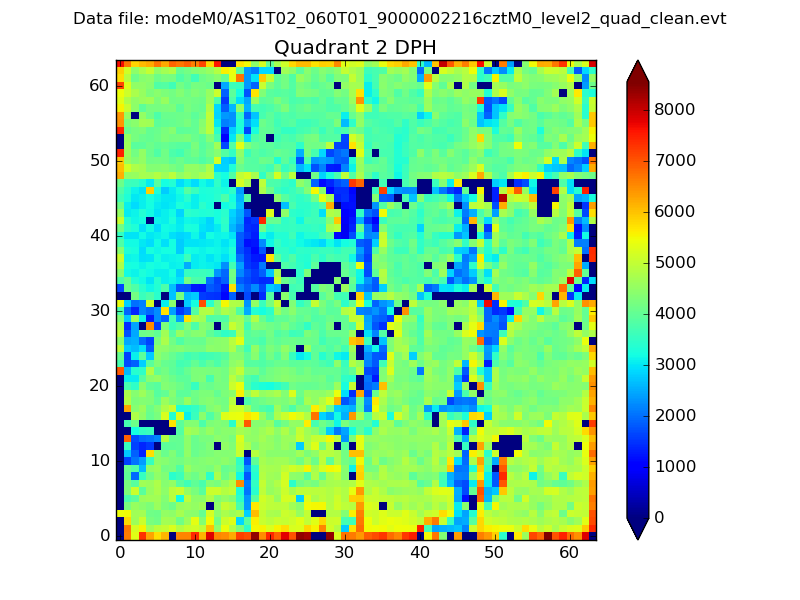 |
Quadrant C |
| Plot type | Count rate plots | Images |
|---|---|---|
| Comparison with Poisson distribution Blue bars denote a histogram of data divided into 1 sec bins. Red curve is a Poisson curve with rate = median count rate of data. |
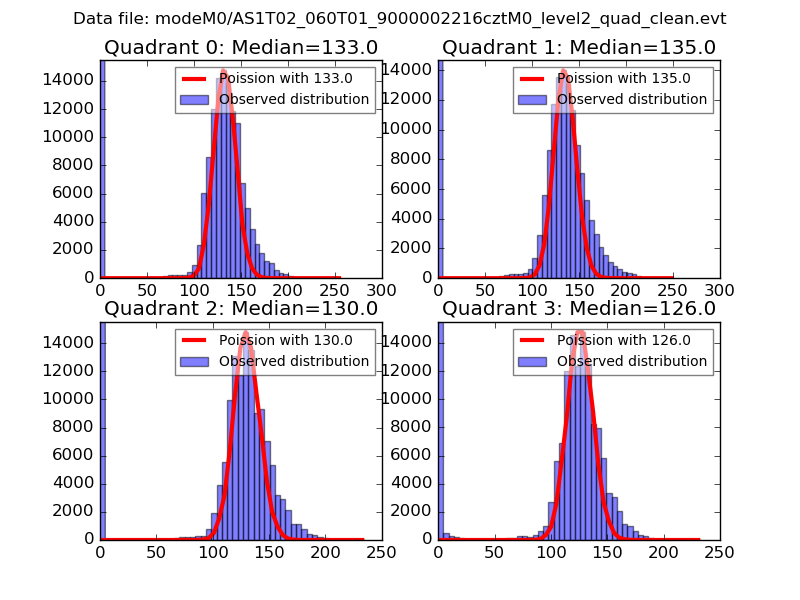 |
 |
| Quadrant-wise count rates Data is divided into 100 sec bins |
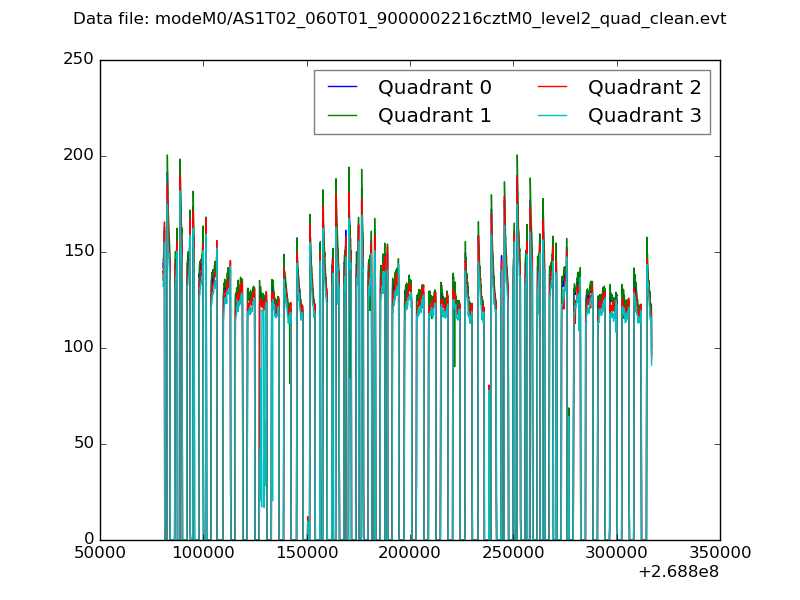 |
|
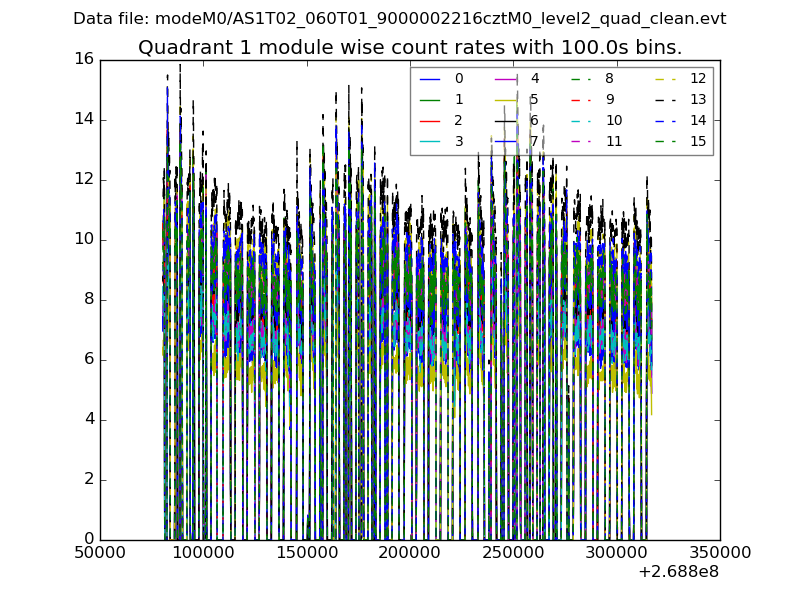
| Module-wise count rates for Quadrant A Data is divided into 100 sec bins |
 |
 |
| Module-wise count rates for Quadrant B Data is divided into 100 sec bins |
 |
 |
| Module-wise count rates for Quadrant C Data is divided into 100 sec bins |
 |
 |
| Module-wise count rates for Quadrant D Data is divided into 100 sec bins |
 |
 |
| Parameter | Plot |
|---|---|
| CZT HV Monitor | 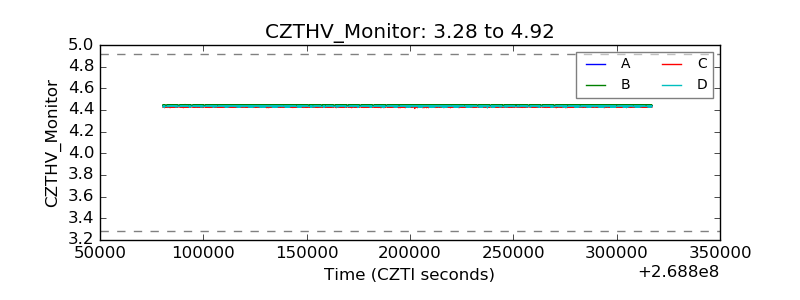 |
| D_VDD | 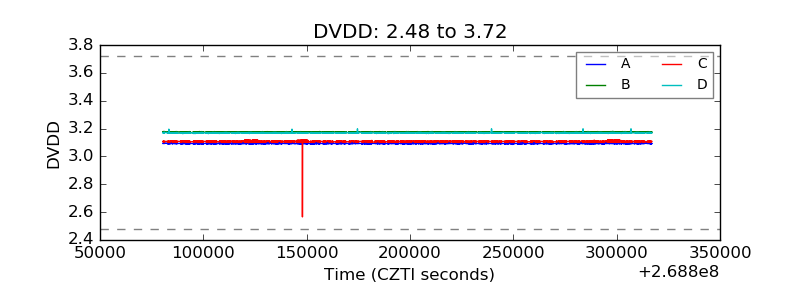 |
| Temperature 1 | 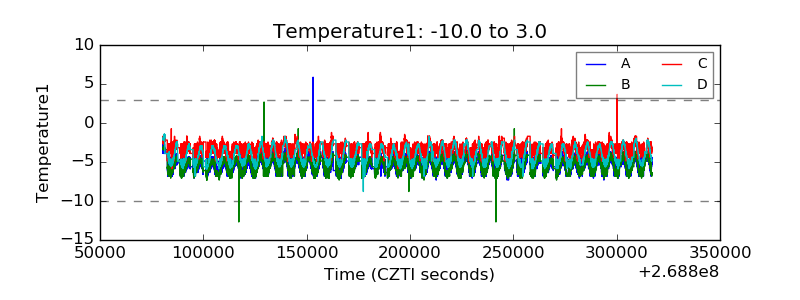 |
| Veto HV Monitor |  |
| Veto LLD | 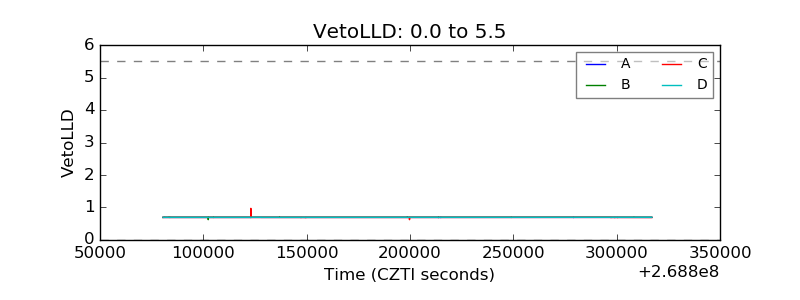 |
| Alpha Counter | 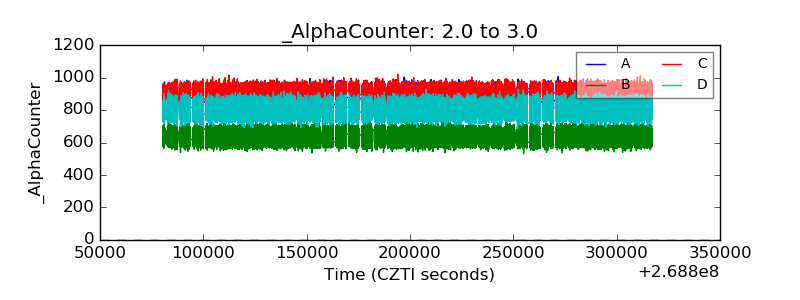 |
| _CPM_Rate | 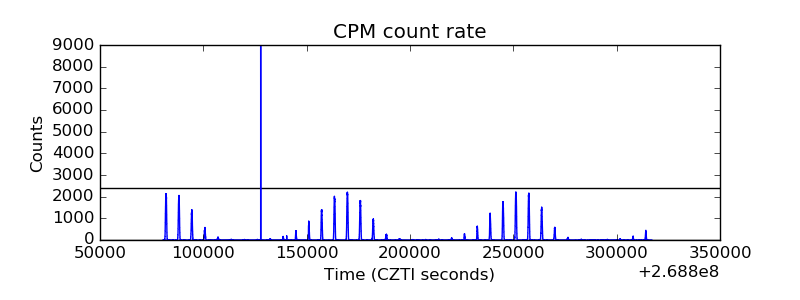 |
| CZT Counter |  |
| +2.5 Volts monitor | 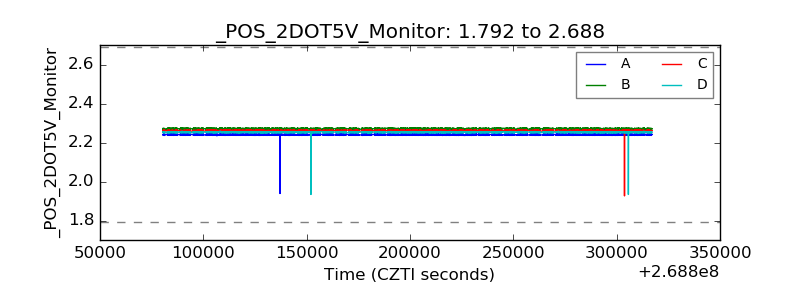 |
| +5 Volts monitor |  |
| _ROLL_ROT | 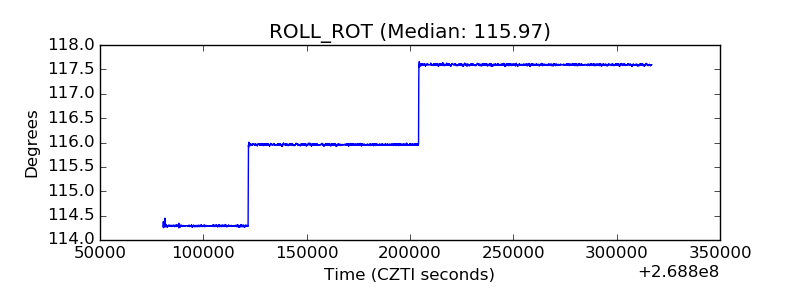 |
| _Roll_DEC | 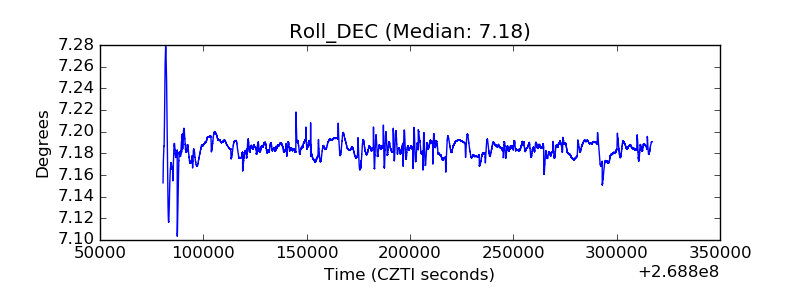 |
| _Roll_RA | 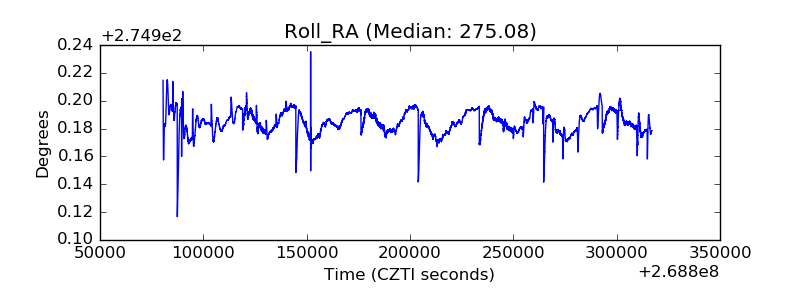 |
| Veto Counter | 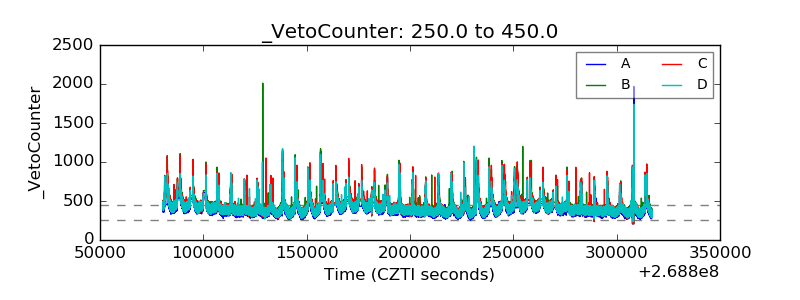 |