| Param | Original file | Final file |
|---|---|---|
| Filename | modeM0/AS1T02_060T01_9000002216_15039cztM0_level2.evt | modeM0/AS1T02_060T01_9000002216_15039cztM0_level2_quad_clean.evt |
| Size (bytes) | 448,139,520 | 81,152,640 |
| Size | 427.4 MB | 77.4 MB |
| Events in quadrant A | 3,386,597 | 511,936 |
| Events in quadrant B | 3,221,826 | 529,964 |
| Events in quadrant C | 3,480,697 | 504,468 |
| Events in quadrant D | 3,063,815 | 480,326 |
| Mode M0 | |||
|---|---|---|---|
| Quadrant | BADHDUFLAG | Total packets | Discarded packets |
| A | 0 | 13691 | 3 |
| B | 0 | 13132 | 2 |
| C | 0 | 13955 | 2 |
| D | 0 | 13108 | 2 |
| Mode M9 | |||
|---|---|---|---|
| Quadrant | BADHDUFLAG | Total packets | Discarded packets |
| A | 0 | 18 | 0 |
| B | 0 | 18 | 0 |
| C | 0 | 18 | 0 |
| D | 0 | 19 | 0 |
| Mode SS | |||
|---|---|---|---|
| Quadrant | BADHDUFLAG | Total packets | Discarded packets |
| A | 0 | 126 | 0 |
| B | 0 | 126 | 0 |
| C | 0 | 126 | 0 |
| D | 0 | 126 | 0 |
| Quadrant | Total seconds | Saturated seconds | Saturation percentage |
|---|---|---|---|
| A | 6169 | 41 | 0.664613% |
| B | 6169 | 58 | 0.940185% |
| C | 6169 | 20 | 0.324202% |
| D | 6169 | 29 | 0.470092% |
Noise dominated data is calculated using 1-second bins in cleaned event files. If a bin has >2000 counts, and if more than 50% of those come from <1% of pixels, then it is considered to be noise-dominated and hence unusable.
| Quadrant | # 1 sec bins | Bins with >0 counts | Bins with >2000 counts | High rate bins dominated by noise | Noise dominated (total time) | Noise dominated (detector-on time) | Marked lightcurve |
|---|---|---|---|---|---|---|---|
| A | 7515 | 6171 | 0 | 0 | 0.00% | 0.00% | 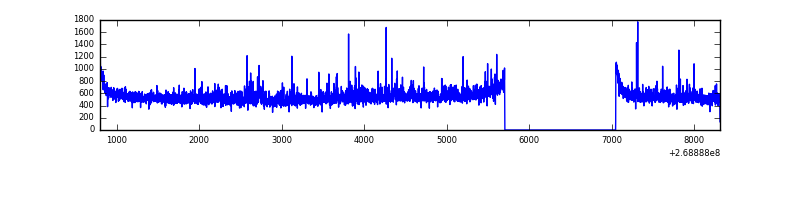 |
| B | 7515 | 6171 | 4 | 4 | 0.05% | 0.06% | 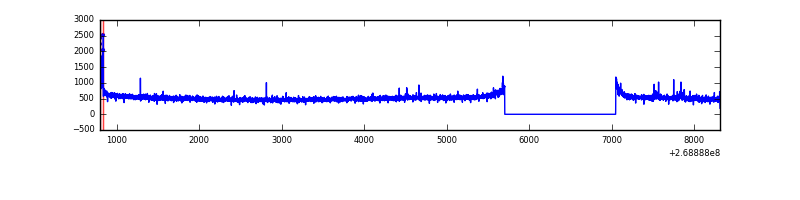 |
| C | 7515 | 6171 | 0 | 0 | 0.00% | 0.00% | 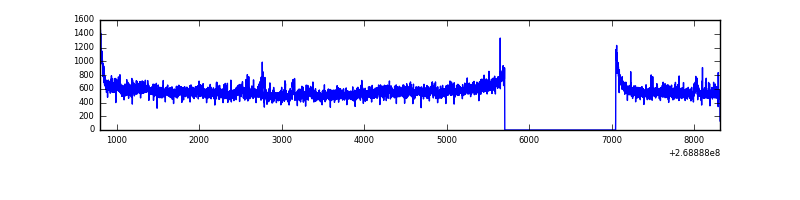 |
| D | 7515 | 6171 | 23 | 23 | 0.31% | 0.37% | 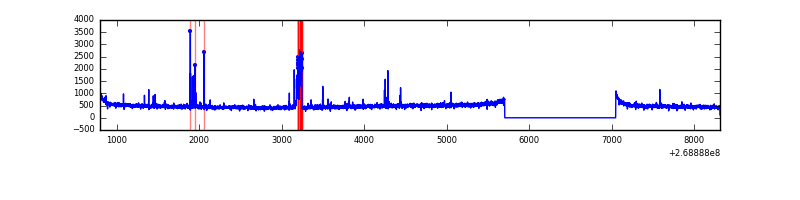 |
Top three noisy pixels from each quadrant. If the there are fewer than three noisy pixels in the level2.evt file, extra rows are filled as -1
| Pixel properties | Quadrant properties | ||||||
|---|---|---|---|---|---|---|---|
| Quadrant | DetID | PixID | Counts | Sigma | Mean | Median | Sigma |
| A | 1 | 162 | 99415 | 605.71 | 814 | 801 | 162.8 |
| A | 1 | 178 | 47774 | 288.52 | 814 | 801 | 162.8 |
| A | 1 | 161 | 41963 | 252.83 | 814 | 801 | 162.8 |
| B | 3 | 64 | 37548 | 237.65 | 815 | 796 | 154.6 |
| B | 12 | 111 | 18078 | 111.75 | 815 | 796 | 154.6 |
| B | 11 | 111 | 15763 | 96.78 | 815 | 796 | 154.6 |
| C | 3 | 233 | 428829 | 2375.72 | 782 | 790 | 180.2 |
| C | 13 | 61 | 5649 | 26.97 | 782 | 790 | 180.2 |
| C | 3 | 232 | 3187 | 13.3 | 782 | 790 | 180.2 |
| D | 13 | 104 | 97007 | 517.91 | 774 | 753 | 185.8 |
| D | 13 | 249 | 31934 | 167.78 | 774 | 753 | 185.8 |
| D | 2 | 234 | 17268 | 88.86 | 774 | 753 | 185.8 |
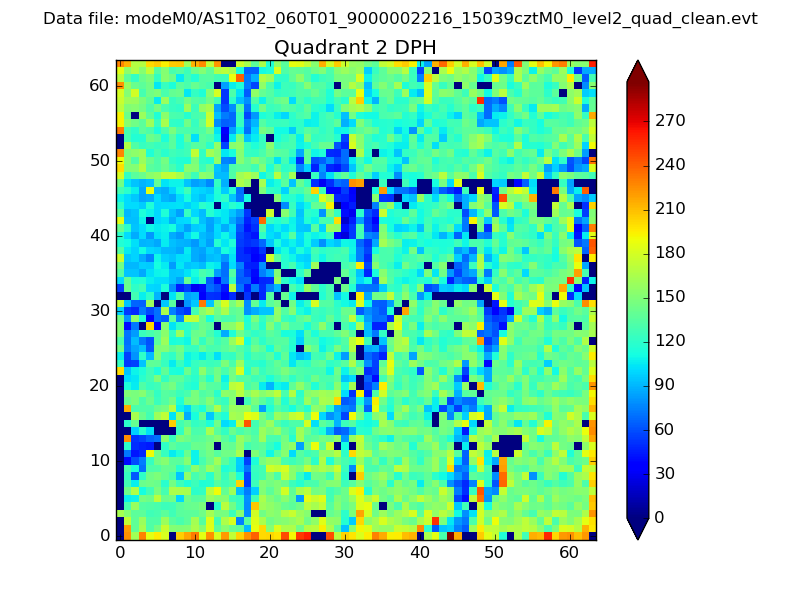
Histogram calculated using DETX and DETY for each event in the final _common_clean file
| Quadrant A |  |
 |
Quadrant B |
|---|---|---|---|
| Quadrant D | 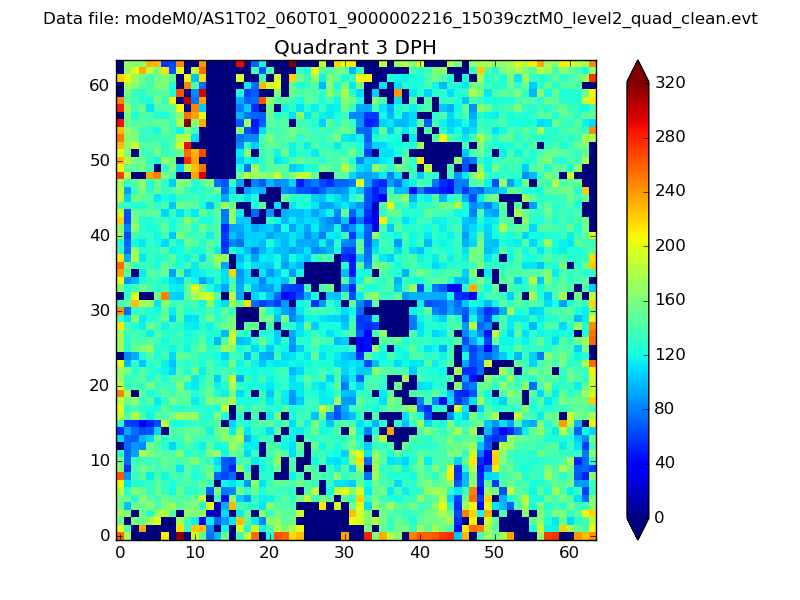 |
 |
Quadrant C |
| Plot type | Count rate plots | Images |
|---|---|---|
| Comparison with Poisson distribution Blue bars denote a histogram of data divided into 1 sec bins. Red curve is a Poisson curve with rate = median count rate of data. |
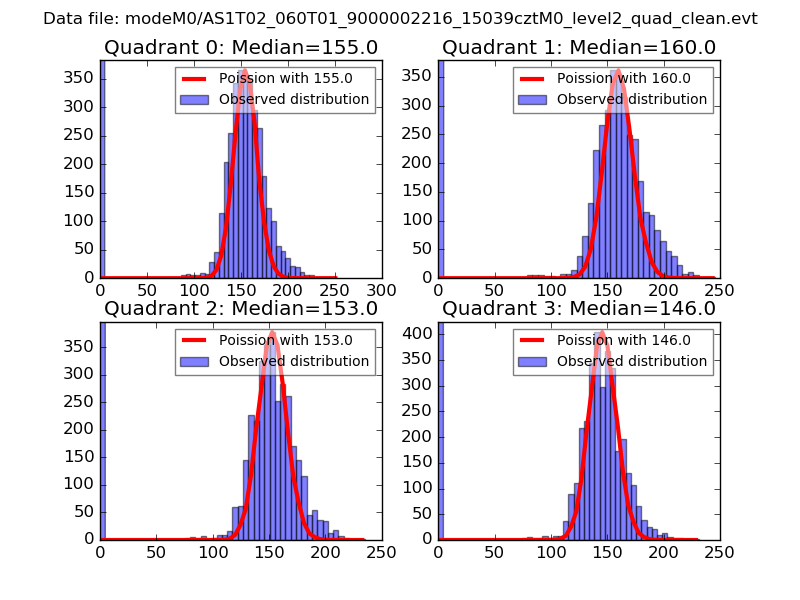 |
 |
| Quadrant-wise count rates Data is divided into 100 sec bins |
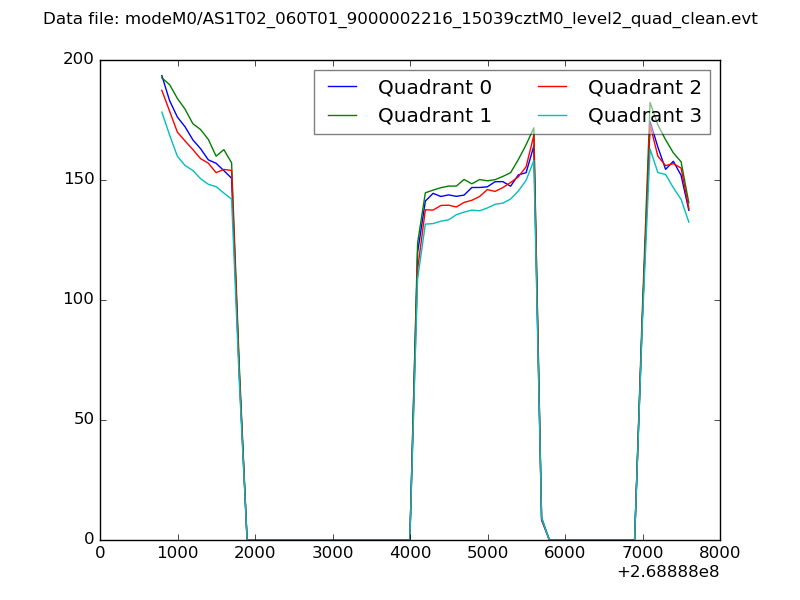 |
|
| Module-wise count rates for Quadrant A Data is divided into 100 sec bins |
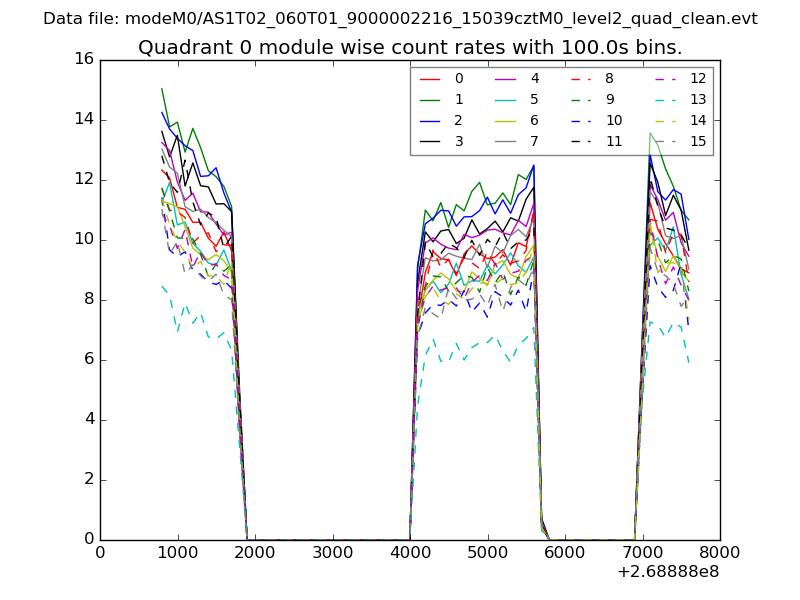 |
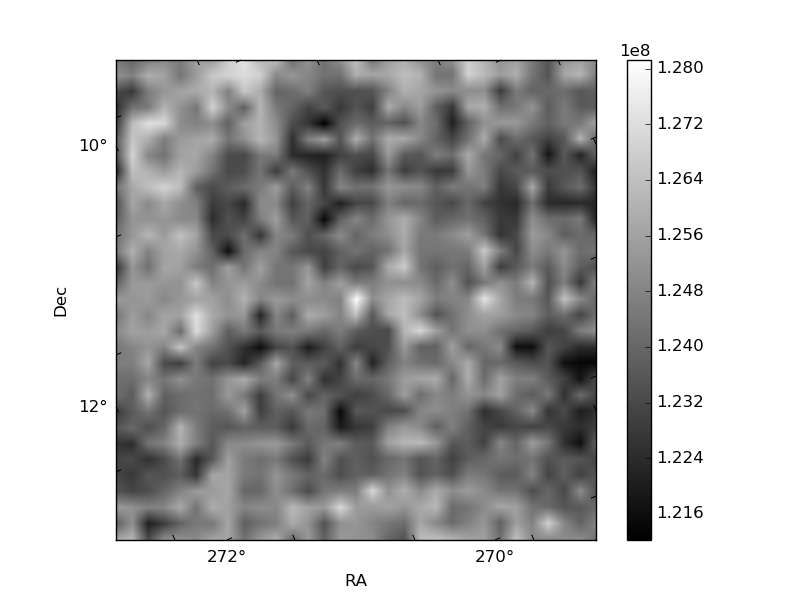 |
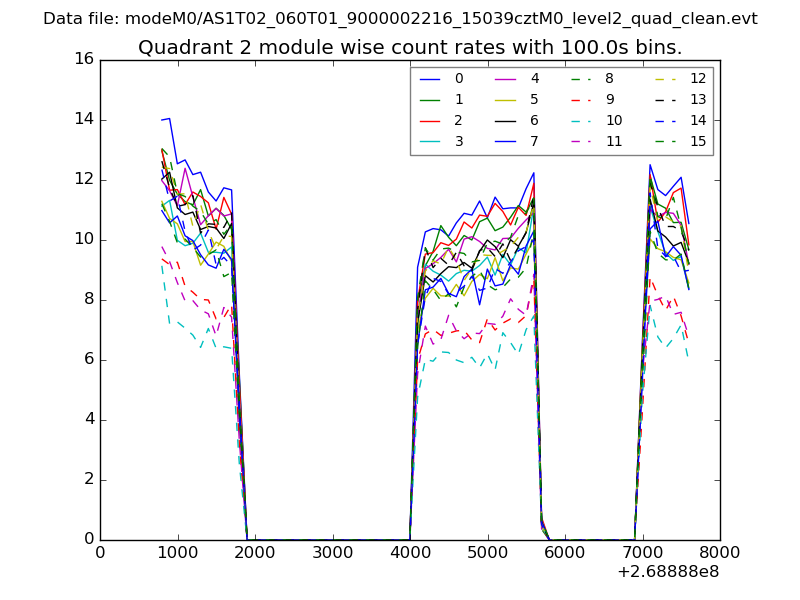
| Module-wise count rates for Quadrant B Data is divided into 100 sec bins |
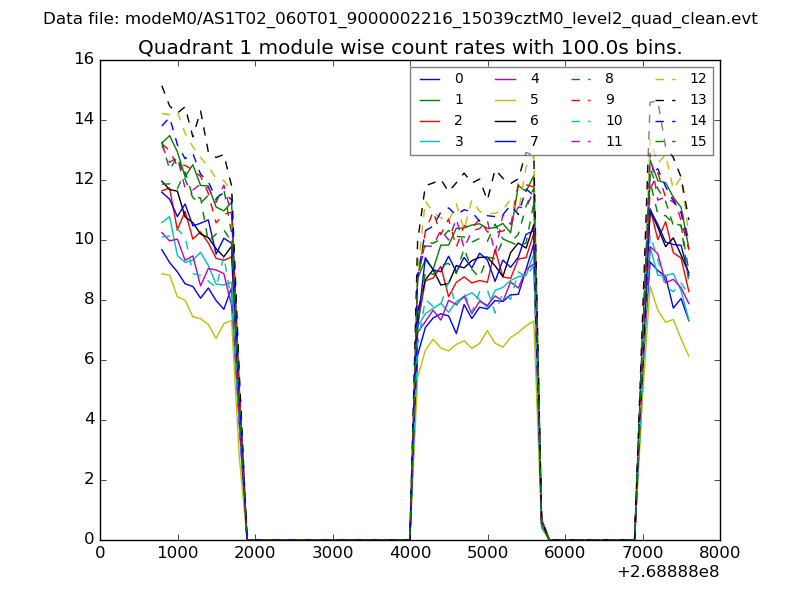 |
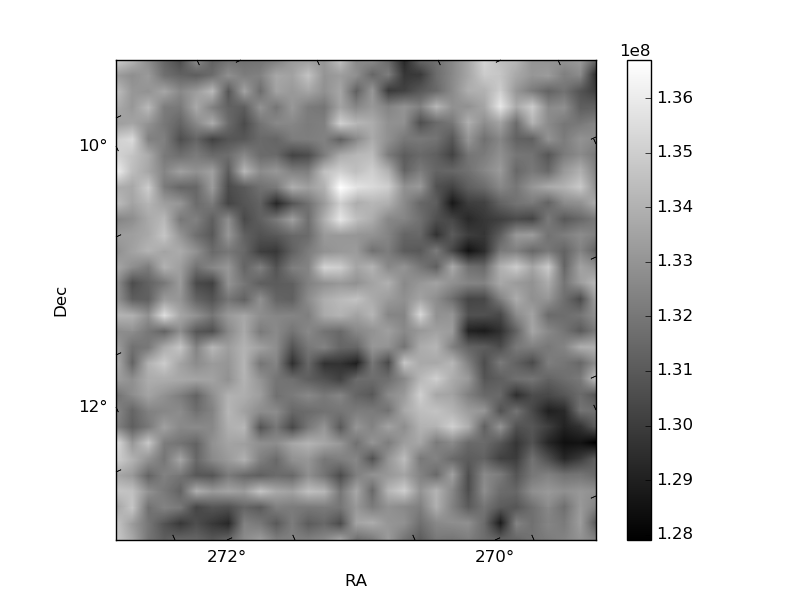 |
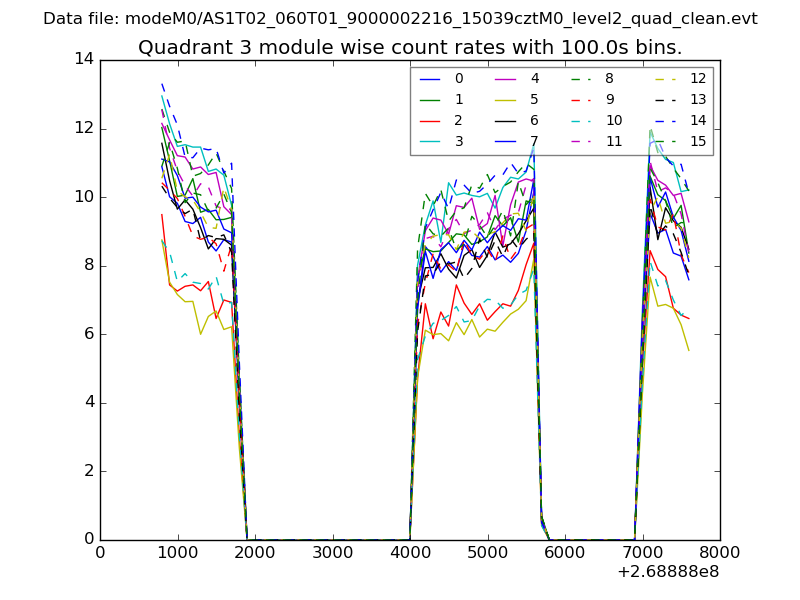
| Module-wise count rates for Quadrant C Data is divided into 100 sec bins |
 |
 |
| Module-wise count rates for Quadrant D Data is divided into 100 sec bins |
 |
 |
| Parameter | Plot |
|---|---|
| CZT HV Monitor | 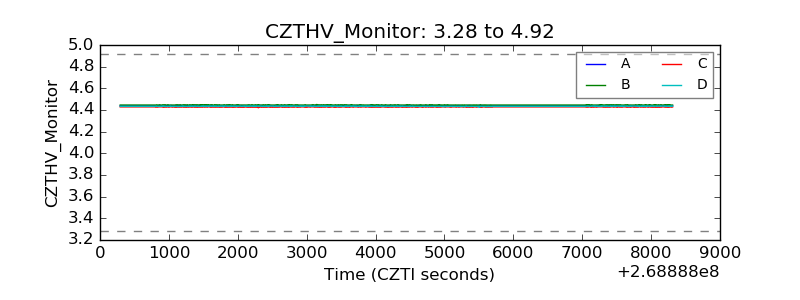 |
| D_VDD | 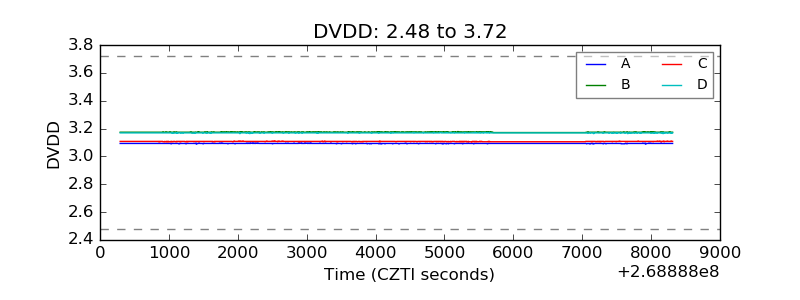 |
| Temperature 1 | 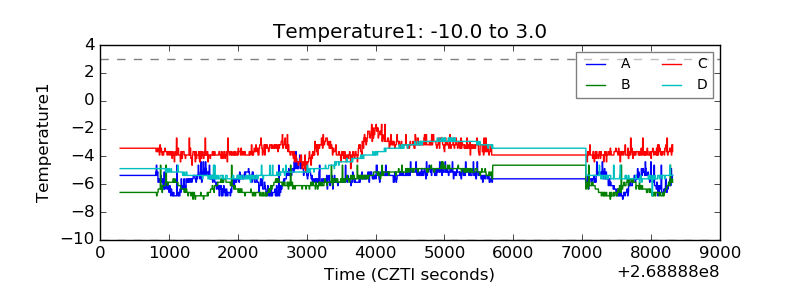 |
| Veto HV Monitor | 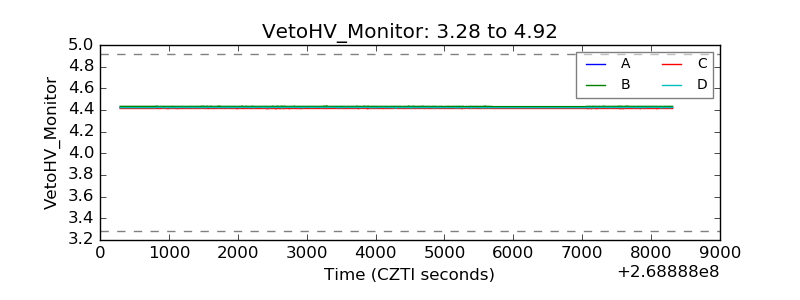 |
| Veto LLD |  |
| Alpha Counter | 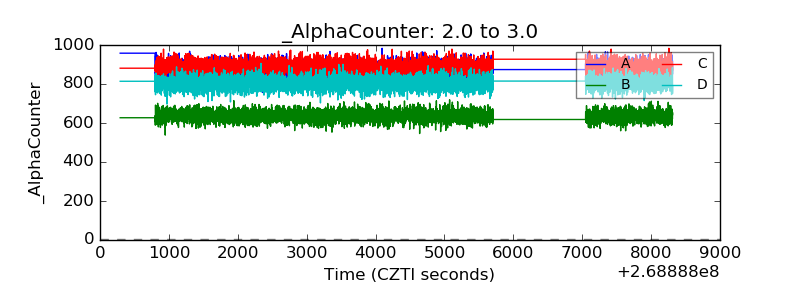 |
| _CPM_Rate | 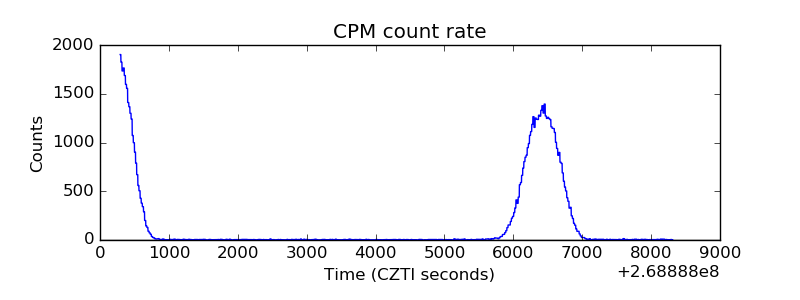 |
| CZT Counter | 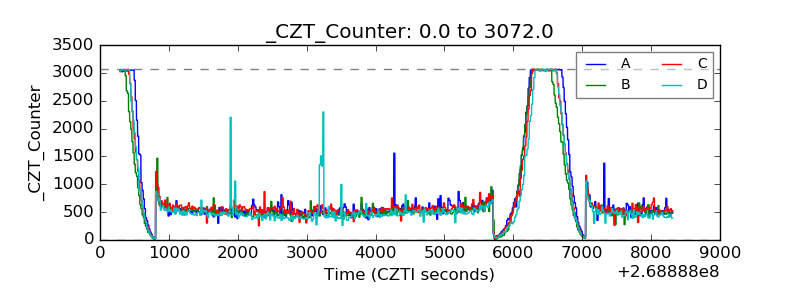 |
| +2.5 Volts monitor |  |
| +5 Volts monitor | 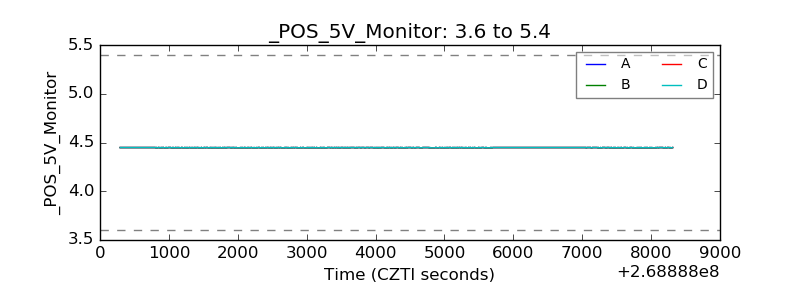 |
| _ROLL_ROT | 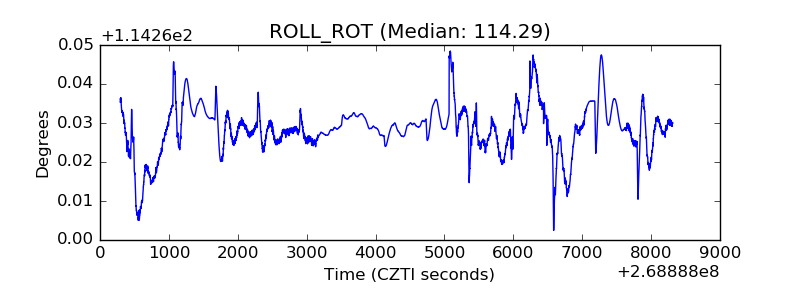 |
| _Roll_DEC | 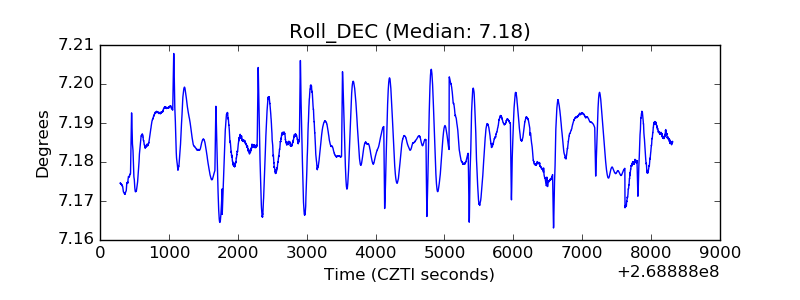 |
| _Roll_RA |  |
| Veto Counter | 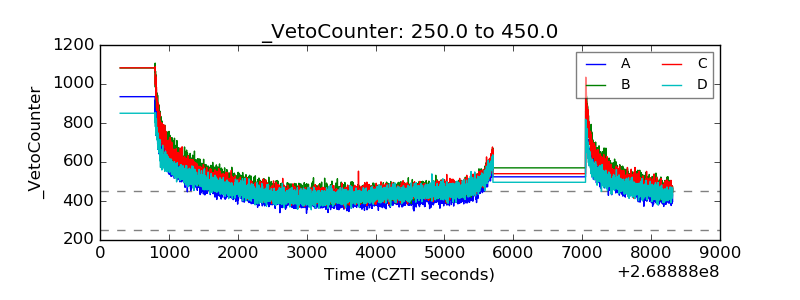 |