| Param | Original file | Final file |
|---|---|---|
| Filename | modeM0/AS1T02_060T01_9000002216_15041cztM0_level2.evt | modeM0/AS1T02_060T01_9000002216_15041cztM0_level2_quad_clean.evt |
| Size (bytes) | 487,823,040 | 71,887,680 |
| Size | 465.2 MB | 68.6 MB |
| Events in quadrant A | 3,483,817 | 431,359 |
| Events in quadrant B | 3,527,177 | 440,456 |
| Events in quadrant C | 4,097,419 | 425,355 |
| Events in quadrant D | 3,209,961 | 411,933 |
| Mode M0 | |||
|---|---|---|---|
| Quadrant | BADHDUFLAG | Total packets | Discarded packets |
| A | 0 | 14322 | 3 |
| B | 0 | 14516 | 2 |
| C | 0 | 16540 | 2 |
| D | 0 | 14118 | 2 |
| Mode M9 | |||
|---|---|---|---|
| Quadrant | BADHDUFLAG | Total packets | Discarded packets |
| A | 0 | 17 | 0 |
| B | 0 | 17 | 0 |
| C | 0 | 17 | 0 |
| D | 0 | 18 | 0 |
| Mode SS | |||
|---|---|---|---|
| Quadrant | BADHDUFLAG | Total packets | Discarded packets |
| A | 0 | 136 | 0 |
| B | 0 | 136 | 0 |
| C | 0 | 136 | 0 |
| D | 0 | 136 | 0 |
| Quadrant | Total seconds | Saturated seconds | Saturation percentage |
|---|---|---|---|
| A | 6708 | 121 | 1.803816% |
| B | 6708 | 183 | 2.728086% |
| C | 6708 | 100 | 1.490757% |
| D | 6708 | 89 | 1.326774% |
Noise dominated data is calculated using 1-second bins in cleaned event files. If a bin has >2000 counts, and if more than 50% of those come from <1% of pixels, then it is considered to be noise-dominated and hence unusable.
| Quadrant | # 1 sec bins | Bins with >0 counts | Bins with >2000 counts | High rate bins dominated by noise | Noise dominated (total time) | Noise dominated (detector-on time) | Marked lightcurve |
|---|---|---|---|---|---|---|---|
| A | 7589 | 6709 | 0 | 0 | 0.00% | 0.00% | 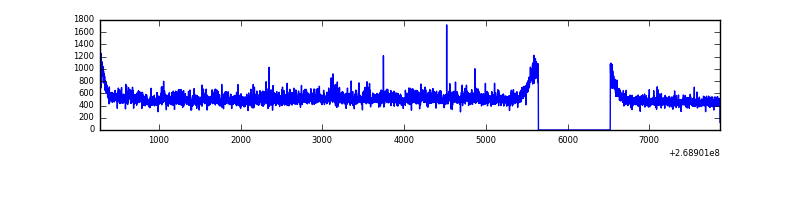 |
| B | 7589 | 6709 | 14 | 14 | 0.18% | 0.21% | 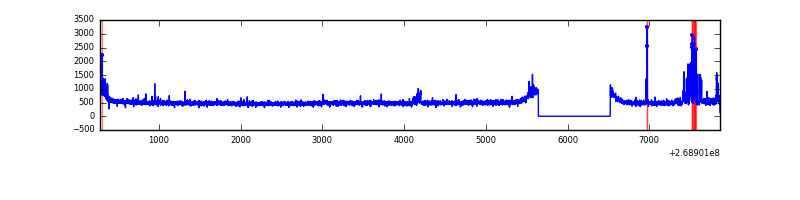 |
| C | 7589 | 6709 | 1 | 1 | 0.01% | 0.01% | 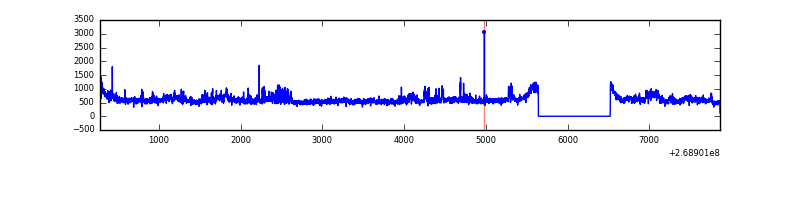 |
| D | 7589 | 6709 | 11 | 11 | 0.14% | 0.16% | 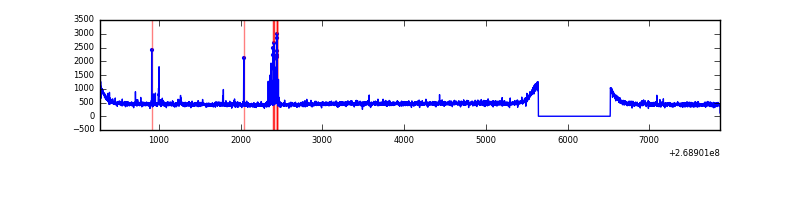 |
Top three noisy pixels from each quadrant. If the there are fewer than three noisy pixels in the level2.evt file, extra rows are filled as -1
| Pixel properties | Quadrant properties | ||||||
|---|---|---|---|---|---|---|---|
| Quadrant | DetID | PixID | Counts | Sigma | Mean | Median | Sigma |
| A | 1 | 162 | 81920 | 469.55 | 854 | 838 | 172.7 |
| A | 1 | 178 | 37970 | 215.04 | 854 | 838 | 172.7 |
| A | 1 | 161 | 32794 | 185.06 | 854 | 838 | 172.7 |
| B | 10 | 16 | 169125 | 1024.64 | 850 | 831 | 164.2 |
| B | 3 | 64 | 21989 | 128.82 | 850 | 831 | 164.2 |
| B | 12 | 111 | 20444 | 119.41 | 850 | 831 | 164.2 |
| C | 3 | 233 | 875491 | 4538.87 | 823 | 829 | 192.7 |
| C | 3 | 232 | 6511 | 29.49 | 823 | 829 | 192.7 |
| C | 13 | 61 | 5838 | 25.99 | 823 | 829 | 192.7 |
| D | 10 | 70 | 61673 | 304.47 | 822 | 799 | 199.9 |
| D | 2 | 234 | 20908 | 100.58 | 822 | 799 | 199.9 |
| D | 2 | 152 | 15414 | 73.1 | 822 | 799 | 199.9 |
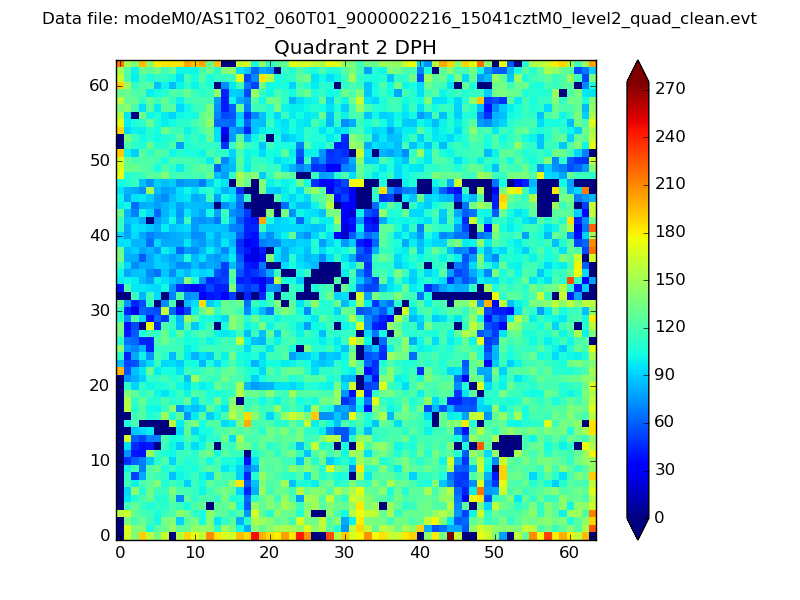
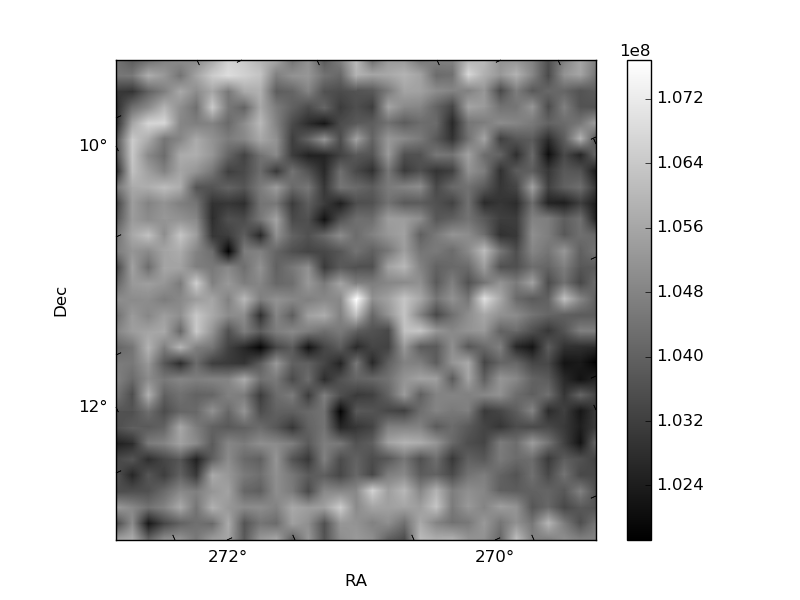
Histogram calculated using DETX and DETY for each event in the final _common_clean file
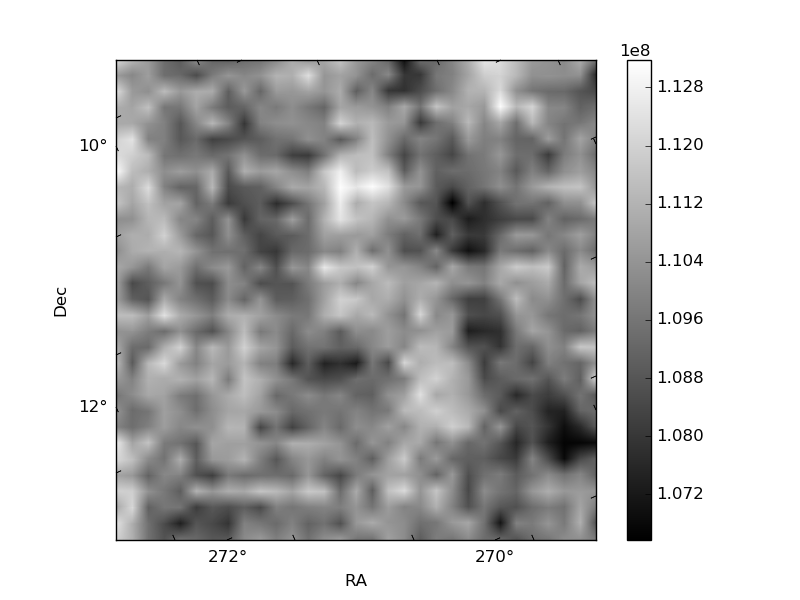
| Quadrant A | 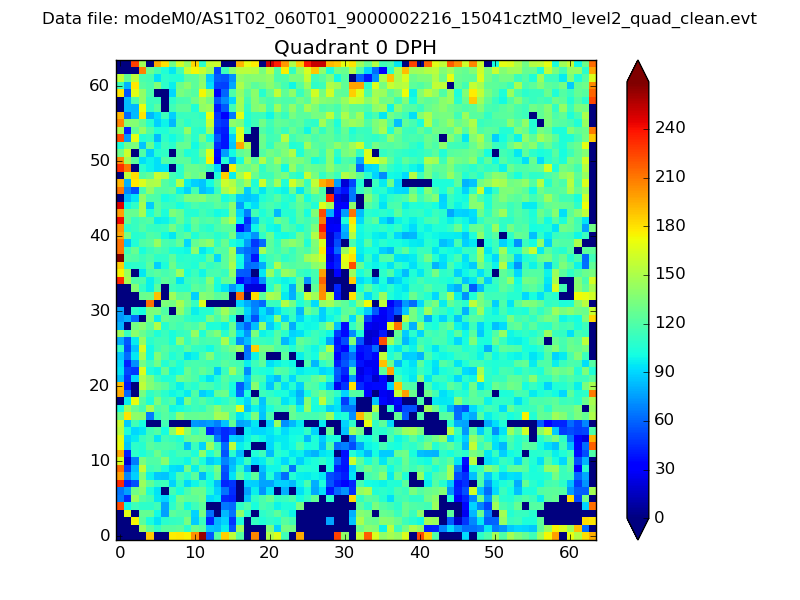 |
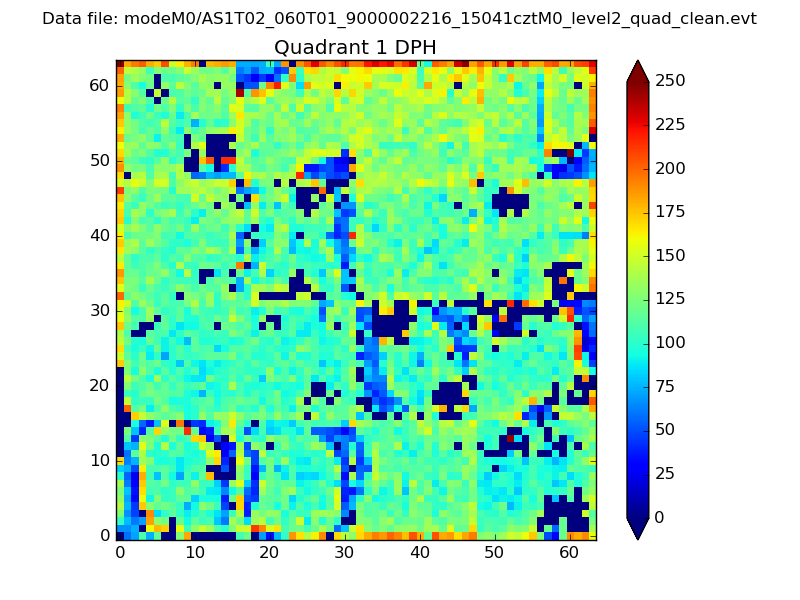 |
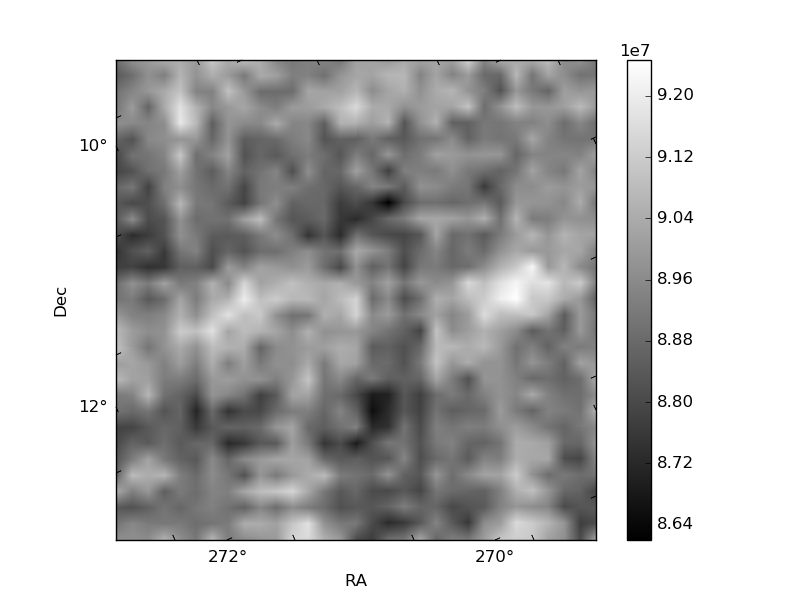
Quadrant B |
|---|---|---|---|
| Quadrant D | 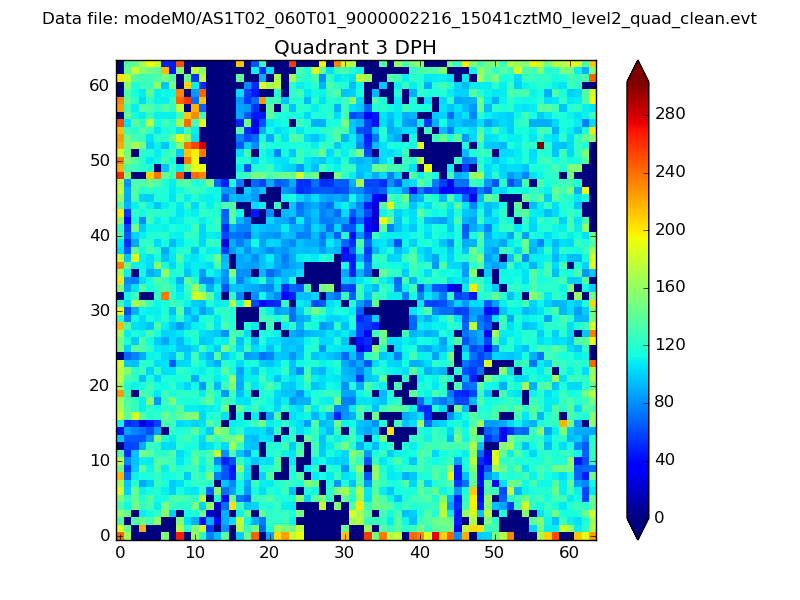 |
 |
Quadrant C |
| Plot type | Count rate plots | Images |
|---|---|---|
| Comparison with Poisson distribution Blue bars denote a histogram of data divided into 1 sec bins. Red curve is a Poisson curve with rate = median count rate of data. |
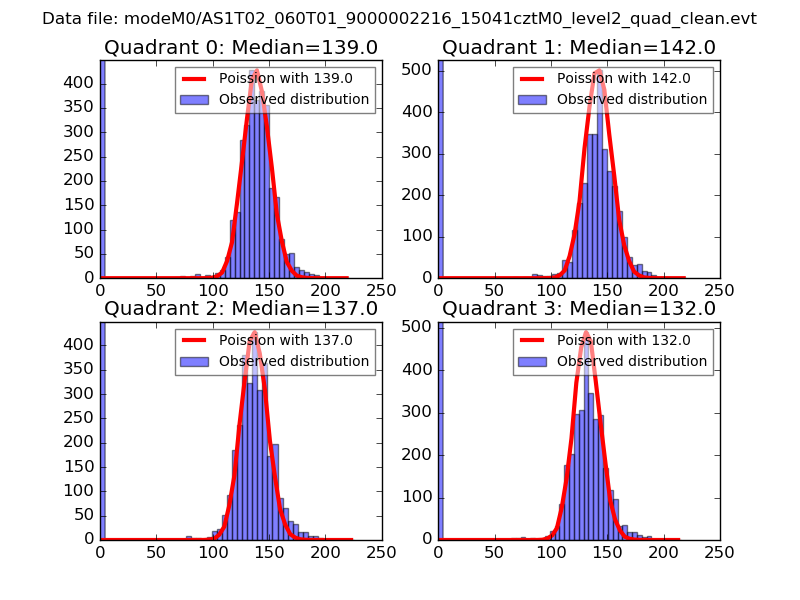 |
 |
| Quadrant-wise count rates Data is divided into 100 sec bins |
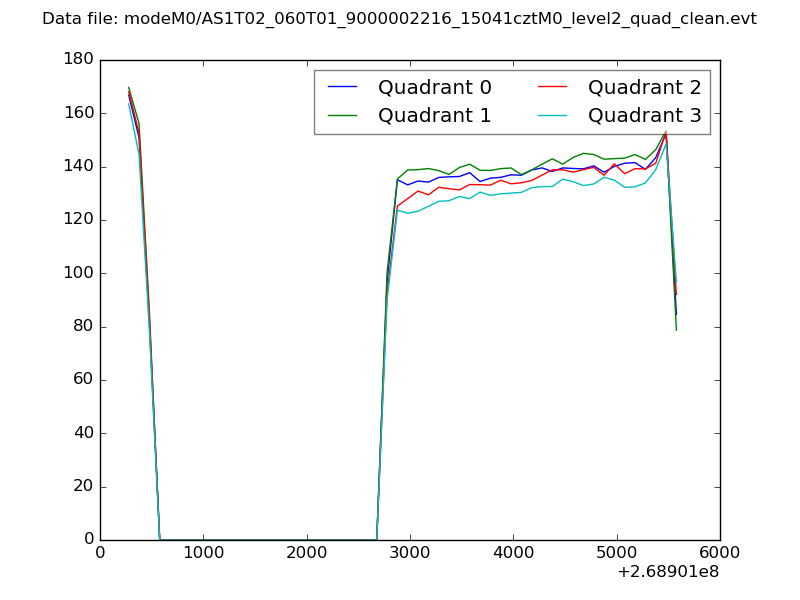 |
|
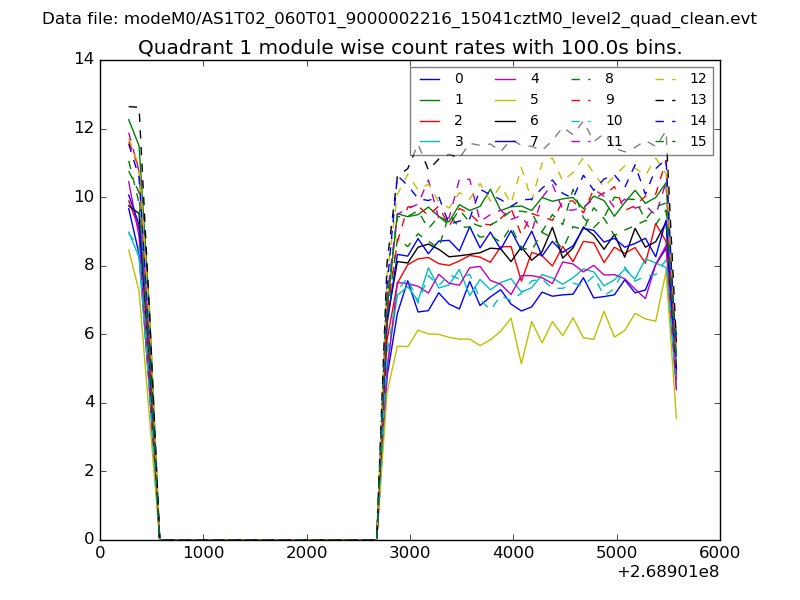
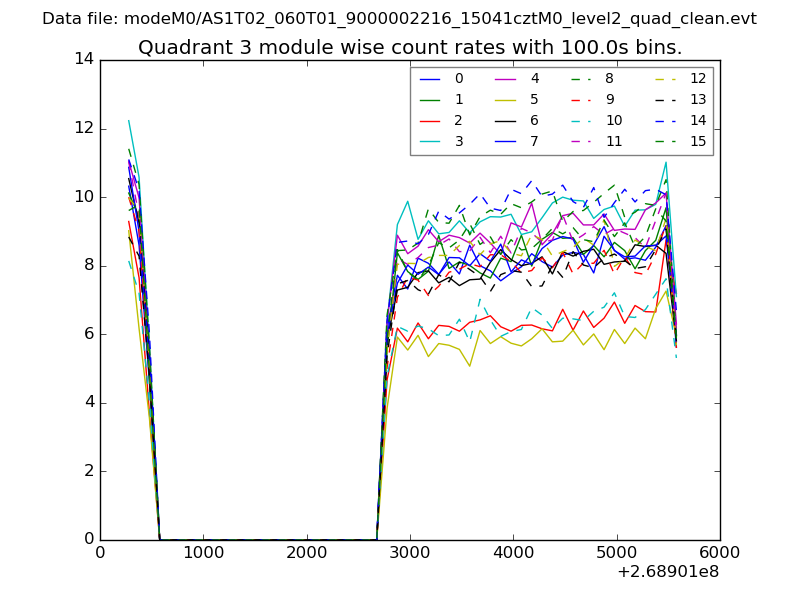
| Module-wise count rates for Quadrant A Data is divided into 100 sec bins |
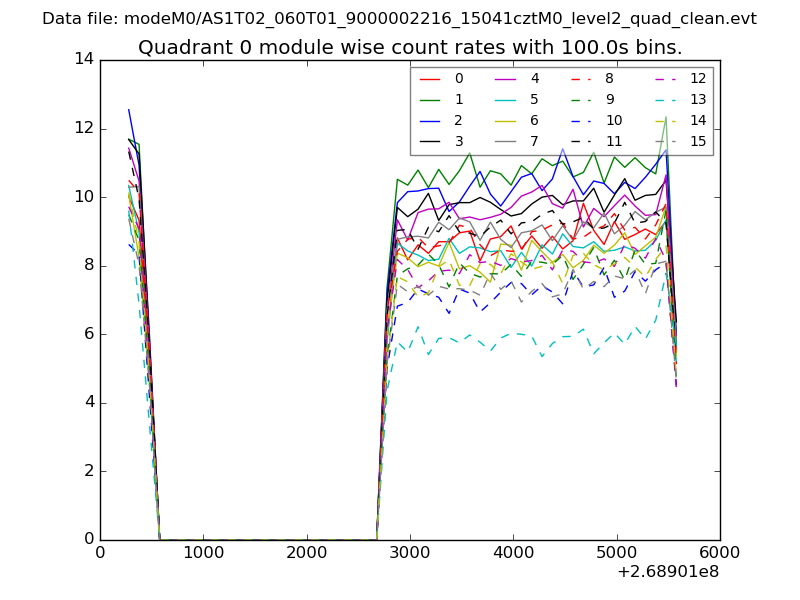 |
 |
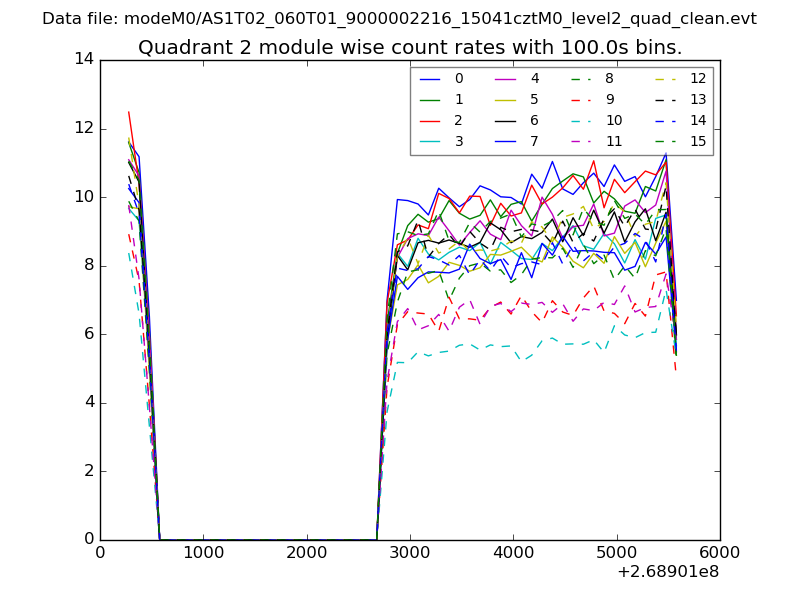
| Module-wise count rates for Quadrant B Data is divided into 100 sec bins |
 |
 |
| Module-wise count rates for Quadrant C Data is divided into 100 sec bins |
 |
 |
| Module-wise count rates for Quadrant D Data is divided into 100 sec bins |
 |
 |
| Parameter | Plot |
|---|---|
| CZT HV Monitor | 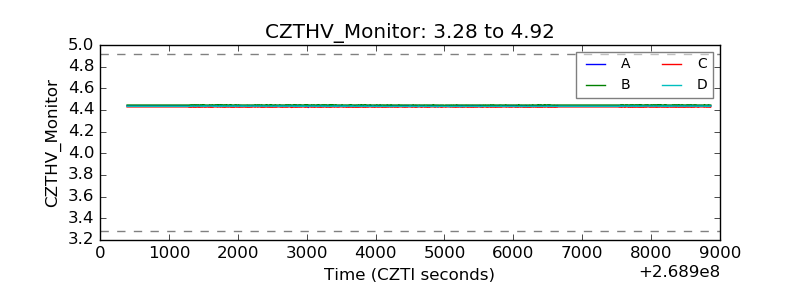 |
| D_VDD | 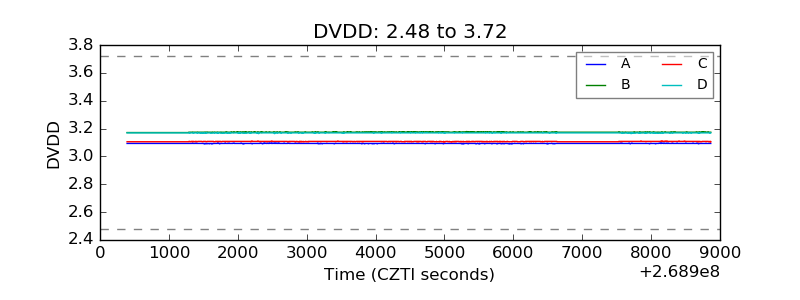 |
| Temperature 1 | 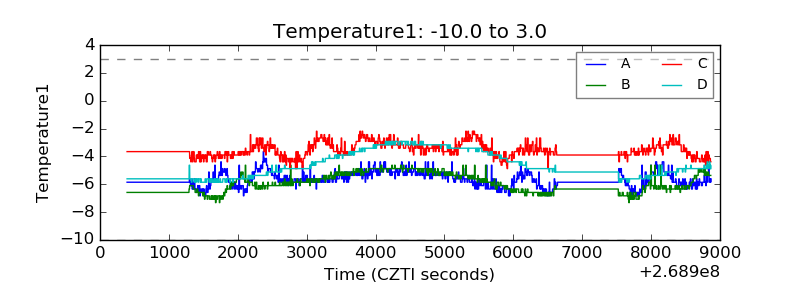 |
| Veto HV Monitor | 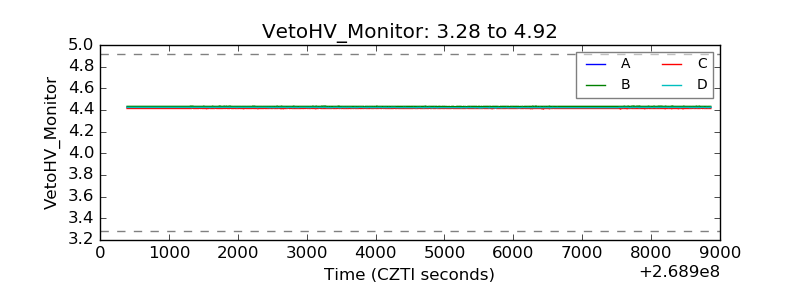 |
| Veto LLD | 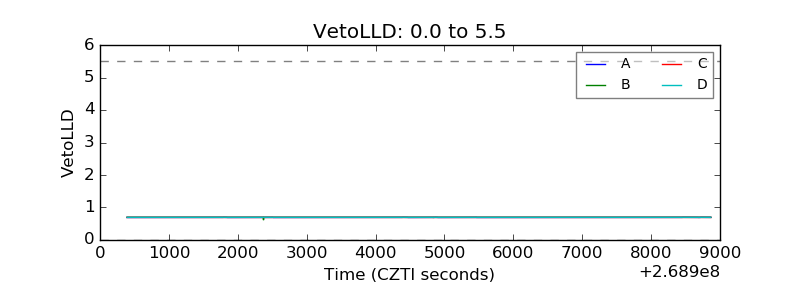 |
| Alpha Counter | 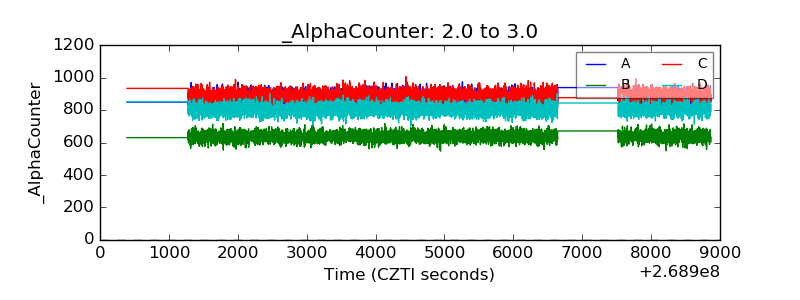 |
| _CPM_Rate | 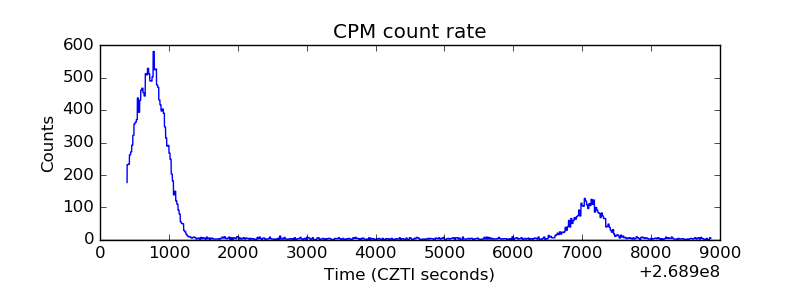 |
| CZT Counter |  |
| +2.5 Volts monitor |  |
| +5 Volts monitor | 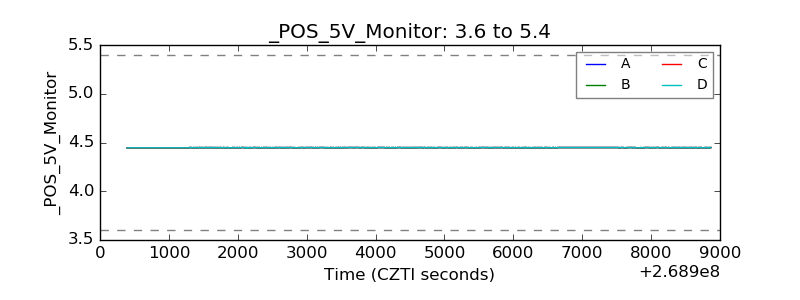 |
| _ROLL_ROT | 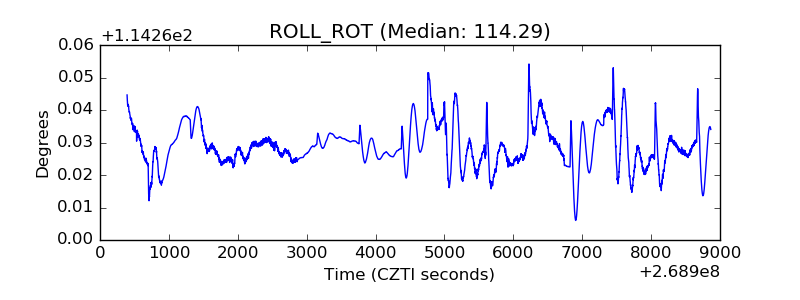 |
| _Roll_DEC | 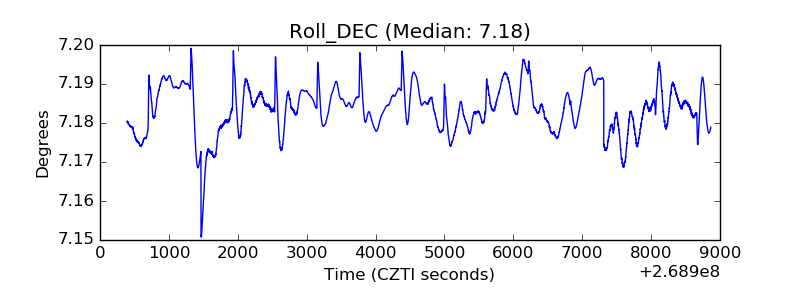 |
| _Roll_RA |  |
| Veto Counter | 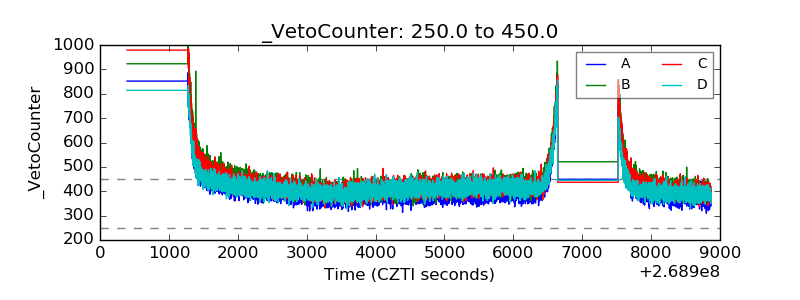 |