| Param | Original file | Final file |
|---|---|---|
| Filename | modeM0/AS1T02_060T01_9000002216_15043cztM0_level2.evt | modeM0/AS1T02_060T01_9000002216_15043cztM0_level2_quad_clean.evt |
| Size (bytes) | 587,782,080 | 97,217,280 |
| Size | 560.6 MB | 92.7 MB |
| Events in quadrant A | 4,250,659 | 594,682 |
| Events in quadrant B | 4,291,686 | 605,623 |
| Events in quadrant C | 4,572,572 | 585,450 |
| Events in quadrant D | 4,108,568 | 567,708 |
| Mode M0 | |||
|---|---|---|---|
| Quadrant | BADHDUFLAG | Total packets | Discarded packets |
| A | 0 | 17990 | 3 |
| B | 0 | 18079 | 2 |
| C | 0 | 18455 | 2 |
| D | 0 | 18169 | 2 |
| Mode M9 | |||
|---|---|---|---|
| Quadrant | BADHDUFLAG | Total packets | Discarded packets |
| A | 0 | 6 | 0 |
| B | 0 | 6 | 0 |
| C | 0 | 6 | 0 |
| D | 0 | 6 | 0 |
| Mode SS | |||
|---|---|---|---|
| Quadrant | BADHDUFLAG | Total packets | Discarded packets |
| A | 0 | 174 | 0 |
| B | 0 | 174 | 0 |
| C | 0 | 174 | 0 |
| D | 0 | 174 | 0 |
| Quadrant | Total seconds | Saturated seconds | Saturation percentage |
|---|---|---|---|
| A | 8503 | 375 | 4.410208% |
| B | 8503 | 391 | 4.598377% |
| C | 8503 | 291 | 3.422322% |
| D | 8503 | 300 | 3.528167% |
Noise dominated data is calculated using 1-second bins in cleaned event files. If a bin has >2000 counts, and if more than 50% of those come from <1% of pixels, then it is considered to be noise-dominated and hence unusable.
| Quadrant | # 1 sec bins | Bins with >0 counts | Bins with >2000 counts | High rate bins dominated by noise | Noise dominated (total time) | Noise dominated (detector-on time) | Marked lightcurve |
|---|---|---|---|---|---|---|---|
| A | 9109 | 8504 | 0 | 0 | 0.00% | 0.00% | 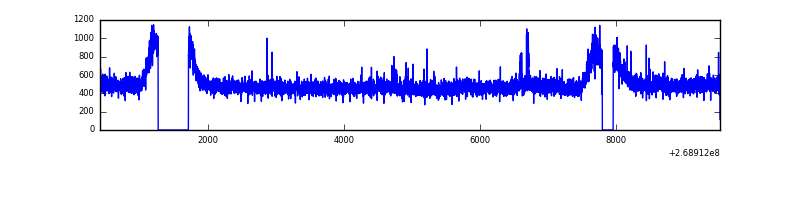 |
| B | 9109 | 8504 | 10 | 10 | 0.11% | 0.12% | 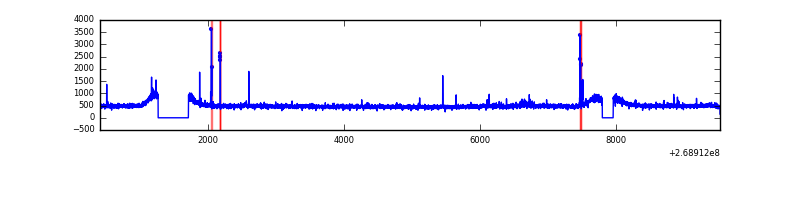 |
| C | 9109 | 8505 | 0 | 0 | 0.00% | 0.00% | 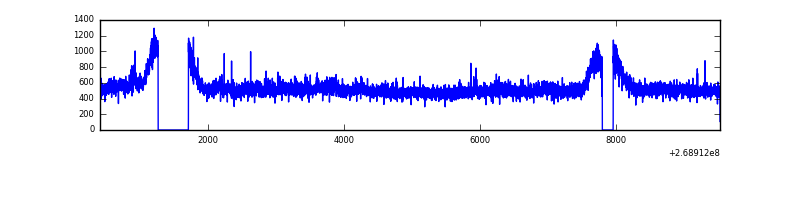 |
| D | 9109 | 8504 | 24 | 24 | 0.26% | 0.28% | 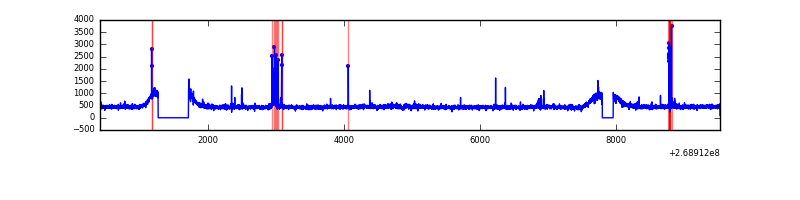 |
Top three noisy pixels from each quadrant. If the there are fewer than three noisy pixels in the level2.evt file, extra rows are filled as -1
| Pixel properties | Quadrant properties | ||||||
|---|---|---|---|---|---|---|---|
| Quadrant | DetID | PixID | Counts | Sigma | Mean | Median | Sigma |
| A | 12 | 189 | 88713 | 395.45 | 1078 | 1052 | 221.7 |
| A | 1 | 162 | 10263 | 41.55 | 1078 | 1052 | 221.7 |
| A | 0 | 226 | 9365 | 37.5 | 1078 | 1052 | 221.7 |
| B | 10 | 245 | 29540 | 136.66 | 1071 | 1042 | 208.5 |
| B | 12 | 111 | 26093 | 120.13 | 1071 | 1042 | 208.5 |
| B | 4 | 80 | 23374 | 107.09 | 1071 | 1042 | 208.5 |
| C | 3 | 233 | 483788 | 1980.6 | 1045 | 1050 | 243.7 |
| C | 13 | 61 | 7489 | 26.42 | 1045 | 1050 | 243.7 |
| C | 8 | 128 | 5396 | 17.83 | 1045 | 1050 | 243.7 |
| D | 10 | 70 | 108166 | 415.91 | 1045 | 1013 | 257.6 |
| D | 2 | 234 | 30619 | 114.91 | 1045 | 1013 | 257.6 |
| D | 2 | 152 | 23207 | 86.14 | 1045 | 1013 | 257.6 |
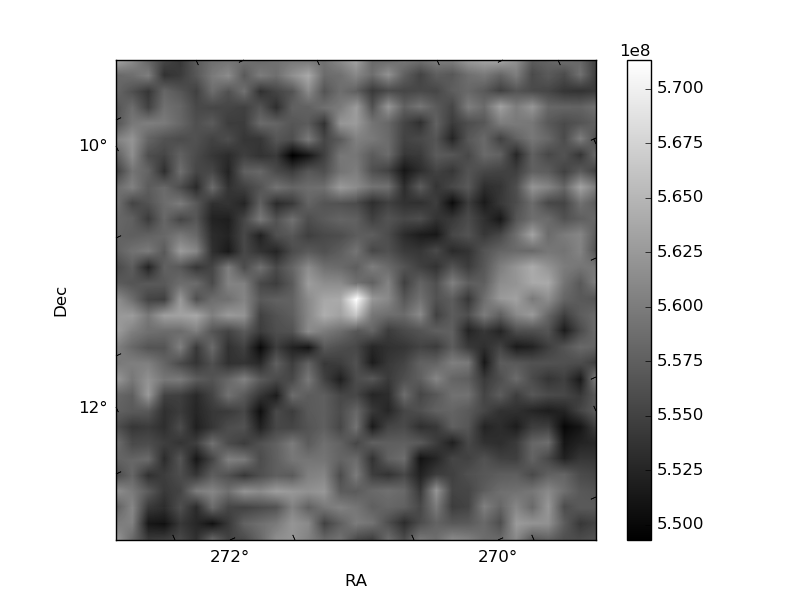
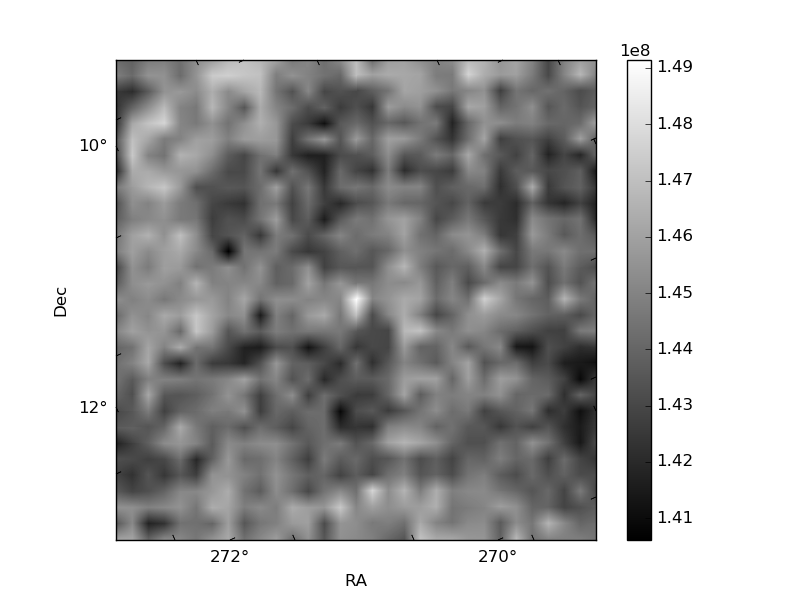
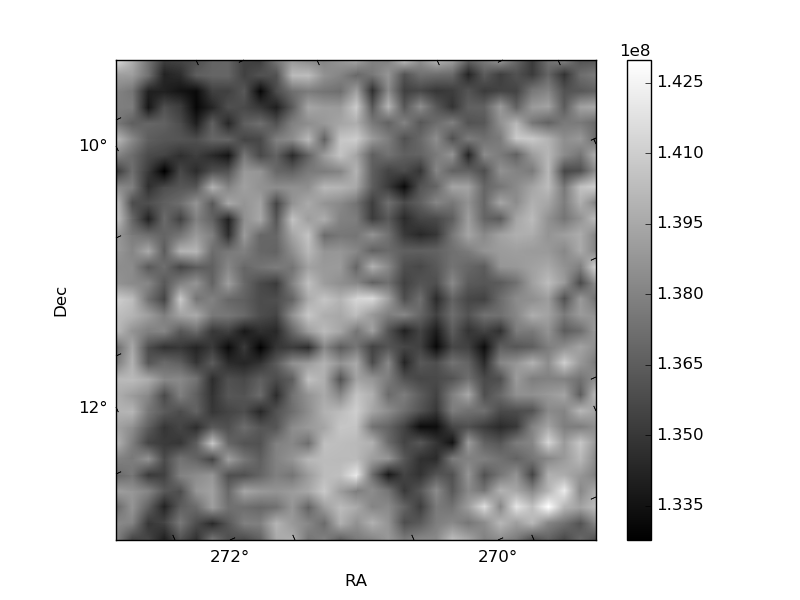
Histogram calculated using DETX and DETY for each event in the final _common_clean file
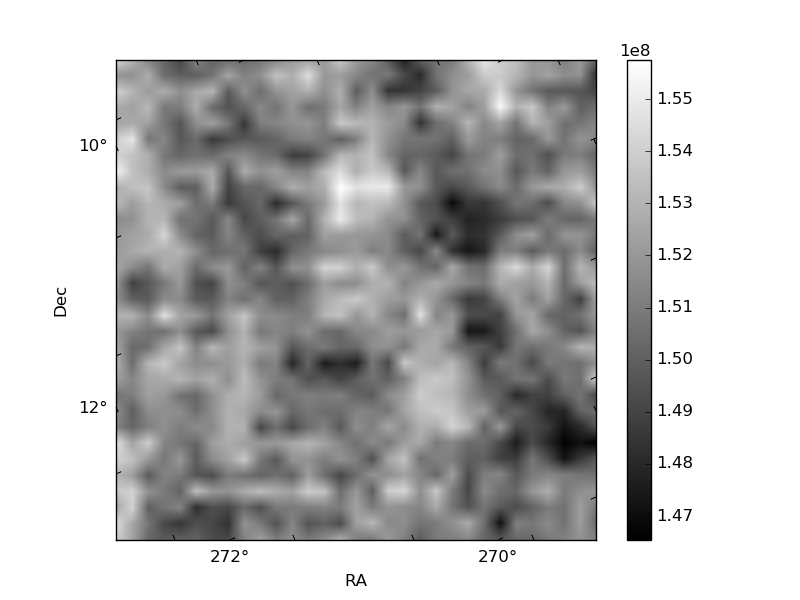
| Quadrant A | 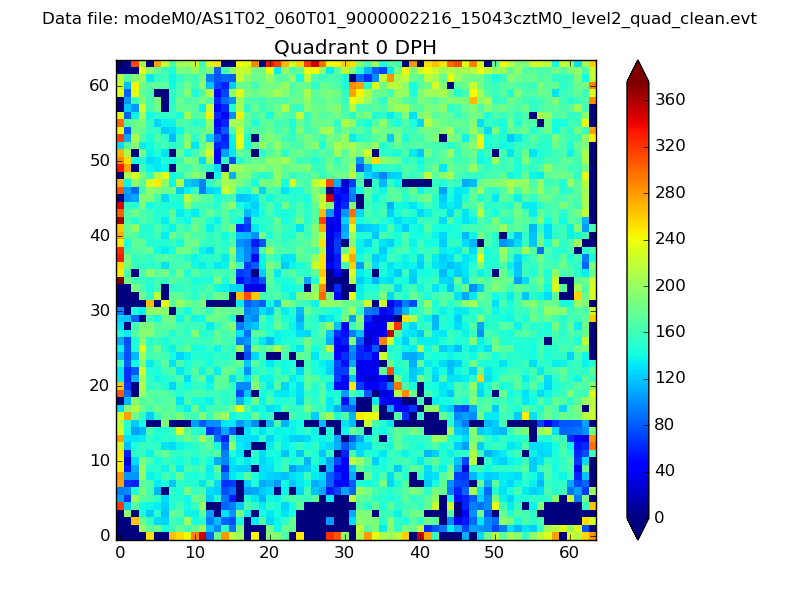 |
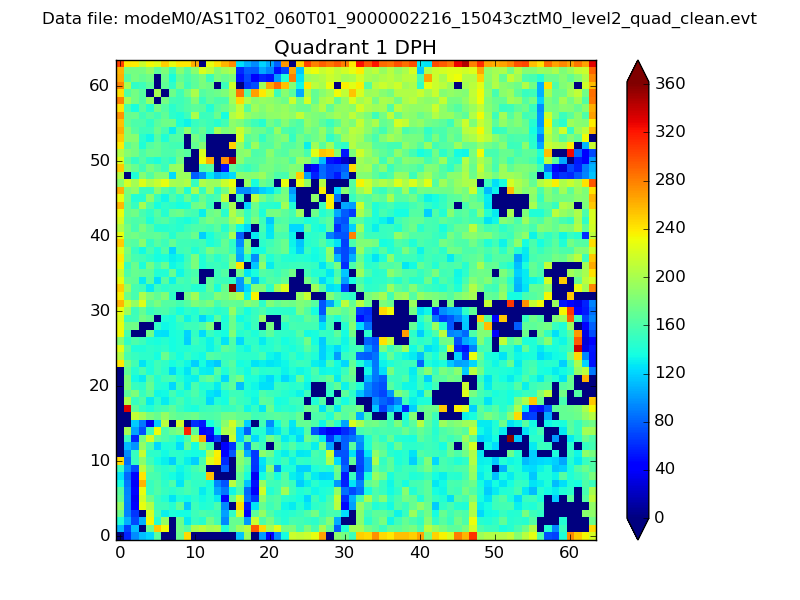 |
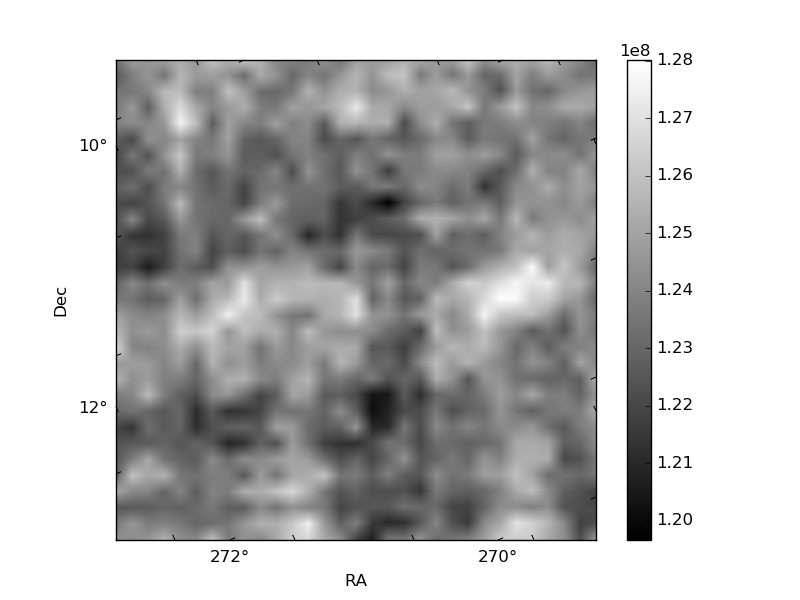
Quadrant B |
|---|---|---|---|
| Quadrant D |  |
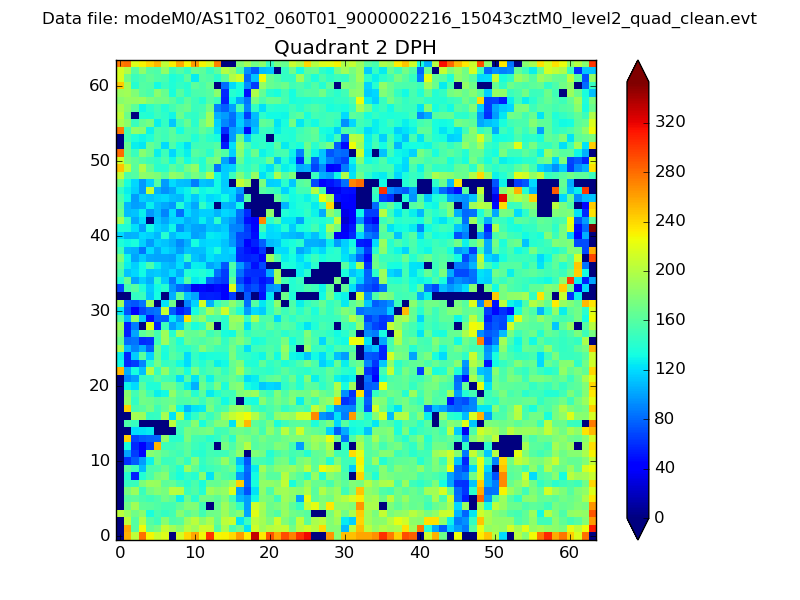 |
Quadrant C |
| Plot type | Count rate plots | Images |
|---|---|---|
| Comparison with Poisson distribution Blue bars denote a histogram of data divided into 1 sec bins. Red curve is a Poisson curve with rate = median count rate of data. |
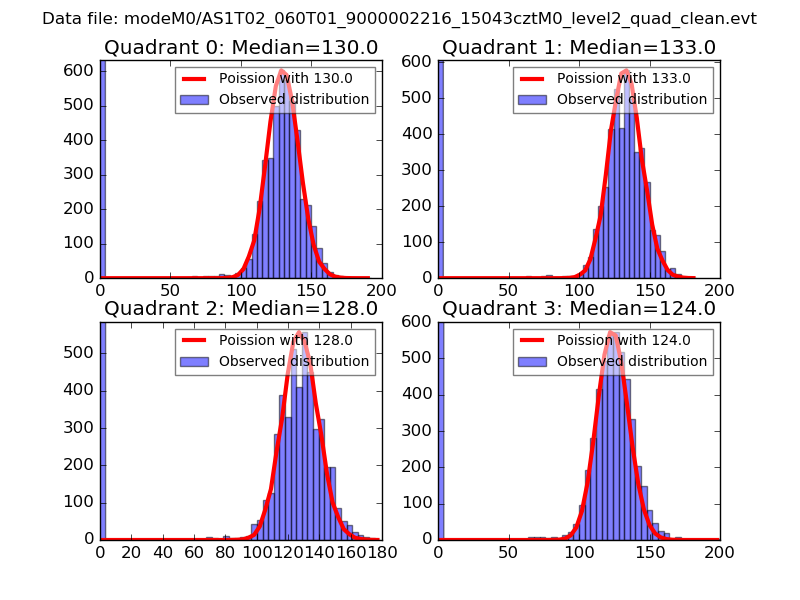 |
 |
| Quadrant-wise count rates Data is divided into 100 sec bins |
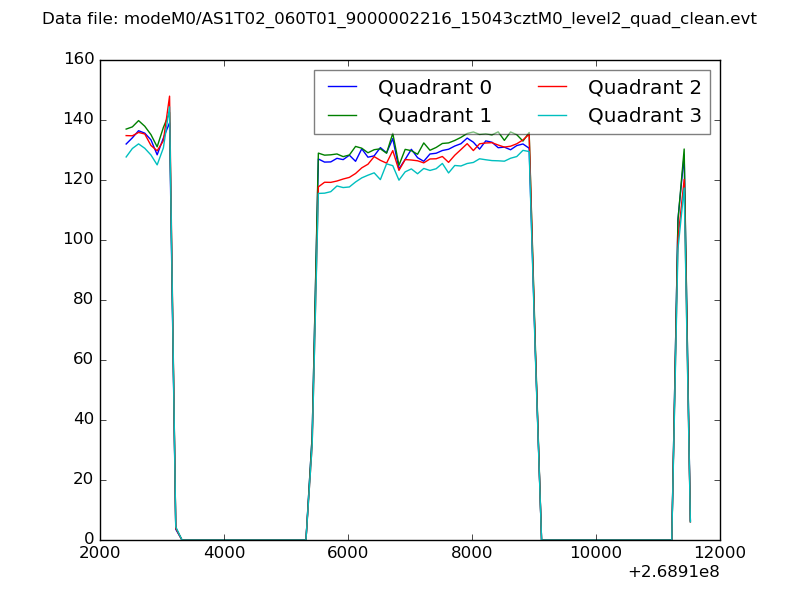 |
|
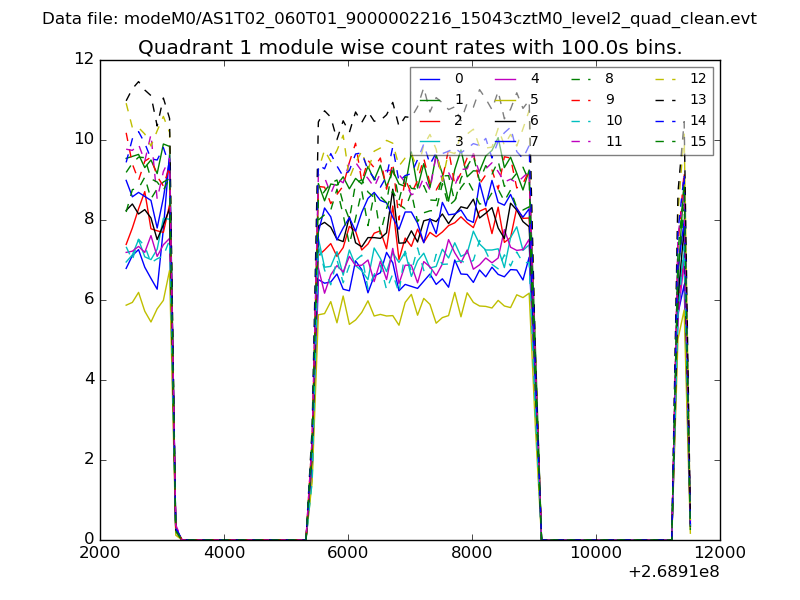
| Module-wise count rates for Quadrant A Data is divided into 100 sec bins |
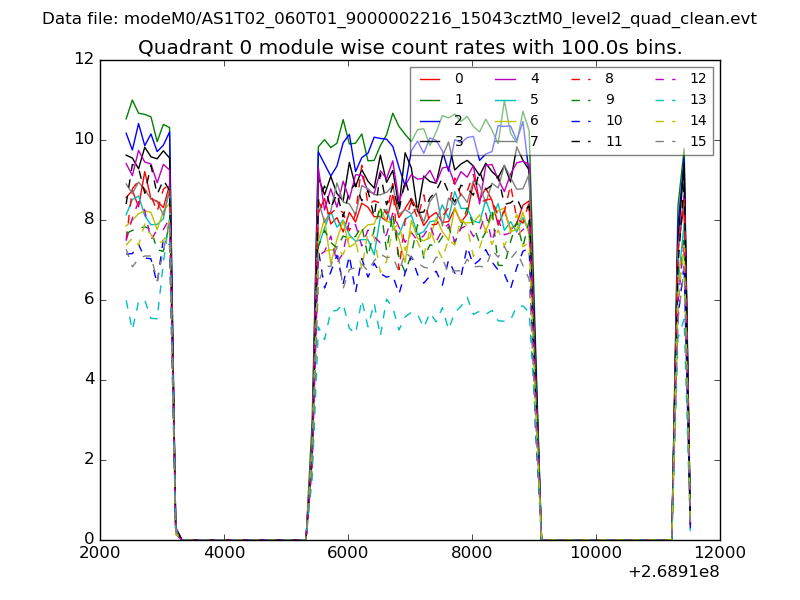 |
 |
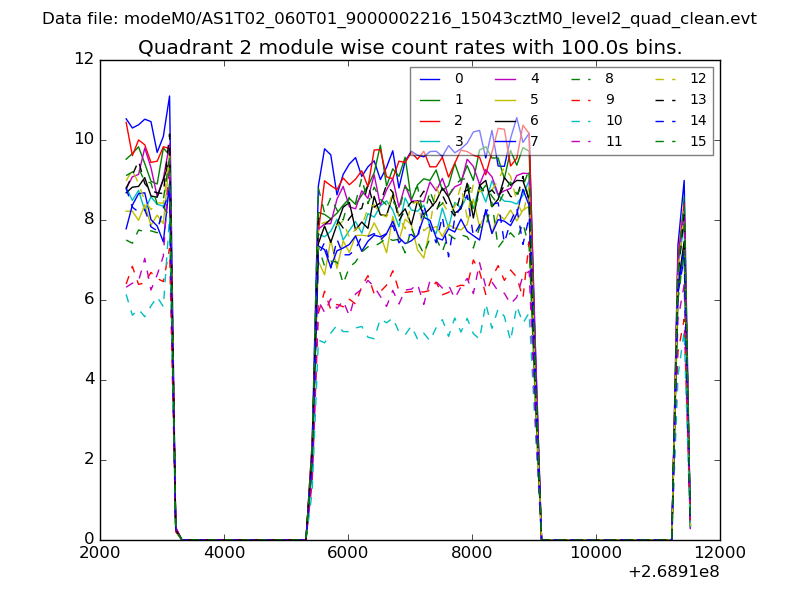
| Module-wise count rates for Quadrant B Data is divided into 100 sec bins |
 |
 |
| Module-wise count rates for Quadrant C Data is divided into 100 sec bins |
 |
 |
| Module-wise count rates for Quadrant D Data is divided into 100 sec bins |
 |
 |
| Parameter | Plot |
|---|---|
| CZT HV Monitor |  |
| D_VDD | 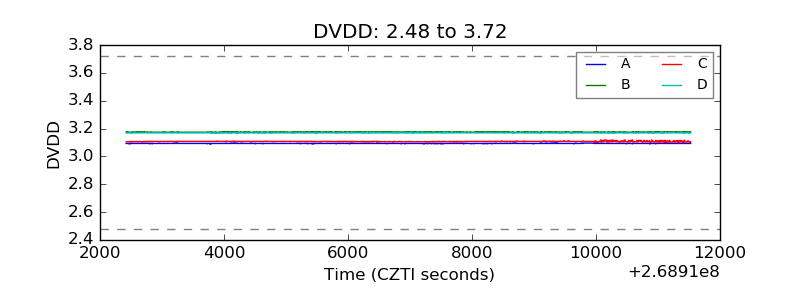 |
| Temperature 1 | 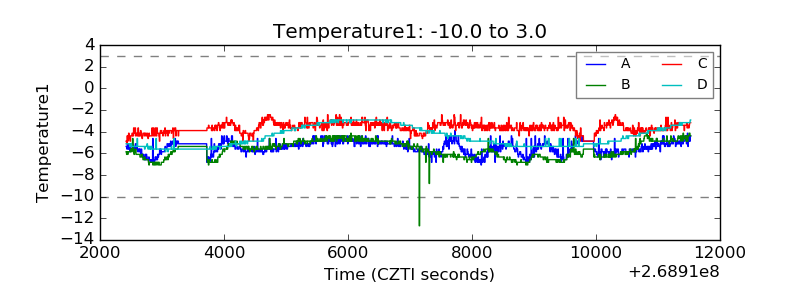 |
| Veto HV Monitor | 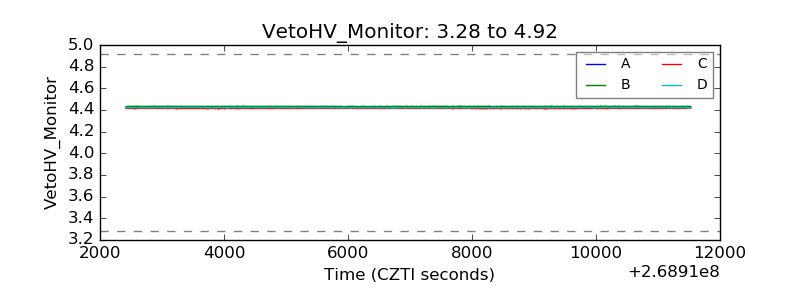 |
| Veto LLD | 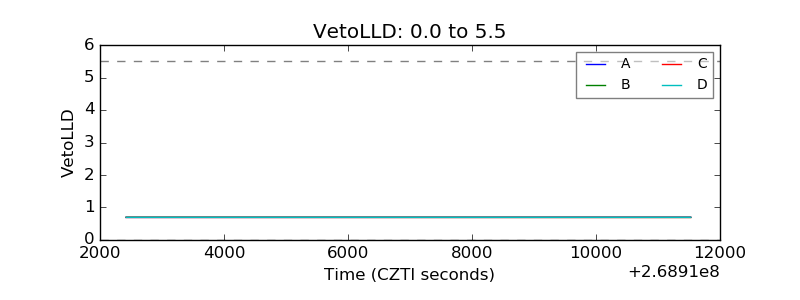 |
| Alpha Counter | 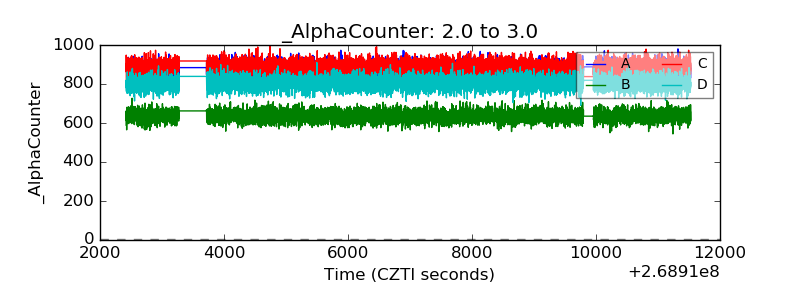 |
| _CPM_Rate | 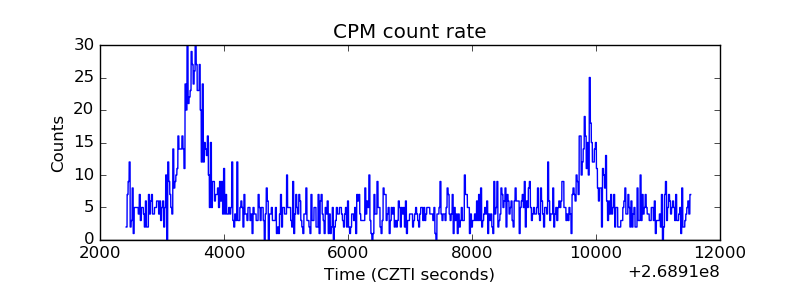 |
| CZT Counter | 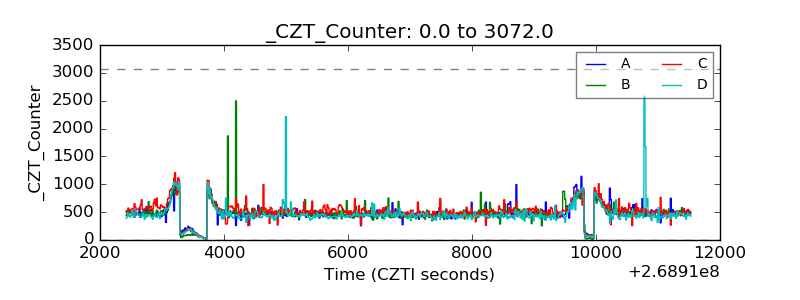 |
| +2.5 Volts monitor |  |
| +5 Volts monitor |  |
| _ROLL_ROT |  |
| _Roll_DEC | 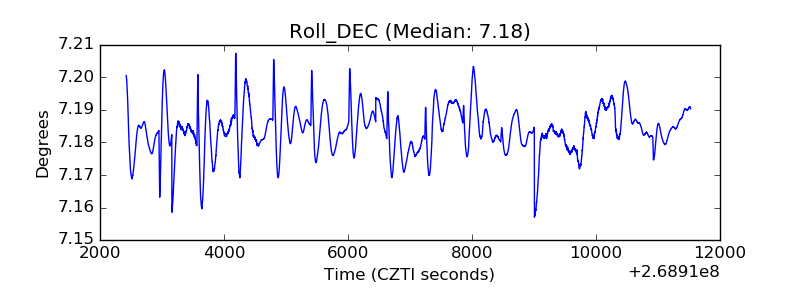 |
| _Roll_RA | 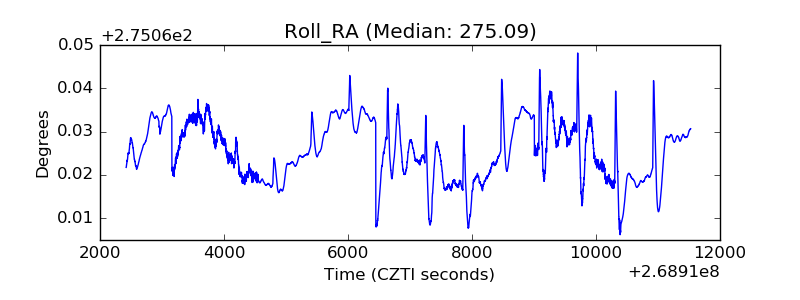 |
| Veto Counter | 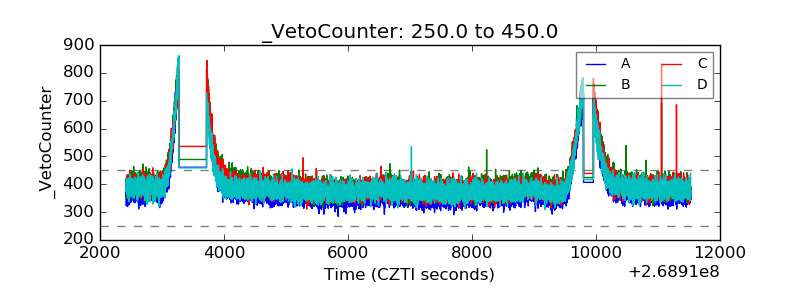 |