| Param | Original file | Final file |
|---|---|---|
| Filename | modeM0/AS1T02_060T01_9000002216_15044cztM0_level2.evt | modeM0/AS1T02_060T01_9000002216_15044cztM0_level2_quad_clean.evt |
| Size (bytes) | 623,185,920 | 87,917,760 |
| Size | 594.3 MB | 83.8 MB |
| Events in quadrant A | 4,120,227 | 544,944 |
| Events in quadrant B | 4,143,605 | 549,366 |
| Events in quadrant C | 4,522,786 | 530,010 |
| Events in quadrant D | 5,526,750 | 464,406 |
| Mode M0 | |||
|---|---|---|---|
| Quadrant | BADHDUFLAG | Total packets | Discarded packets |
| A | 0 | 17357 | 3 |
| B | 0 | 17526 | 2 |
| C | 0 | 18371 | 2 |
| D | 0 | 22171 | 2 |
| Mode M9 | |||
|---|---|---|---|
| Quadrant | BADHDUFLAG | Total packets | Discarded packets |
| A | 0 | 4 | 0 |
| B | 0 | 4 | 0 |
| C | 0 | 4 | 0 |
| D | 0 | 4 | 0 |
| Mode SS | |||
|---|---|---|---|
| Quadrant | BADHDUFLAG | Total packets | Discarded packets |
| A | 0 | 170 | 0 |
| B | 0 | 170 | 0 |
| C | 0 | 170 | 0 |
| D | 0 | 170 | 0 |
| Quadrant | Total seconds | Saturated seconds | Saturation percentage |
|---|---|---|---|
| A | 8246 | 331 | 4.014067% |
| B | 8246 | 356 | 4.317245% |
| C | 8246 | 277 | 3.359204% |
| D | 8246 | 967 | 11.726898% |
Noise dominated data is calculated using 1-second bins in cleaned event files. If a bin has >2000 counts, and if more than 50% of those come from <1% of pixels, then it is considered to be noise-dominated and hence unusable.
| Quadrant | # 1 sec bins | Bins with >0 counts | Bins with >2000 counts | High rate bins dominated by noise | Noise dominated (total time) | Noise dominated (detector-on time) | Marked lightcurve |
|---|---|---|---|---|---|---|---|
| A | 8702 | 8247 | 0 | 0 | 0.00% | 0.00% | 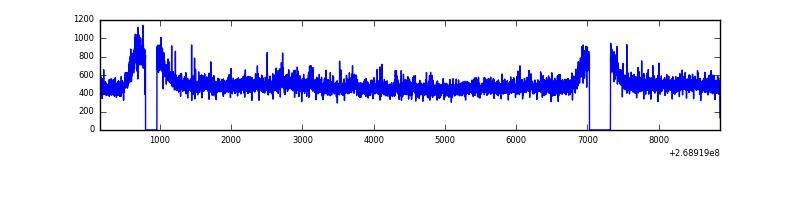 |
| B | 8702 | 8247 | 7 | 7 | 0.08% | 0.08% | 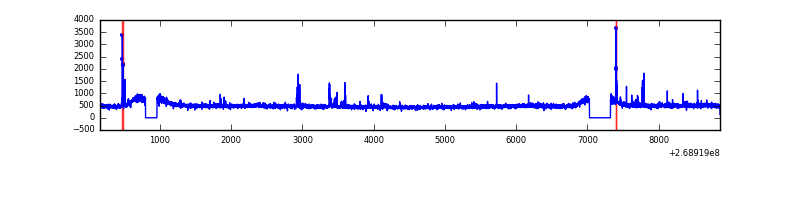 |
| C | 8702 | 8248 | 0 | 0 | 0.00% | 0.00% |  |
| D | 8701 | 8246 | 647 | 647 | 7.44% | 7.85% | 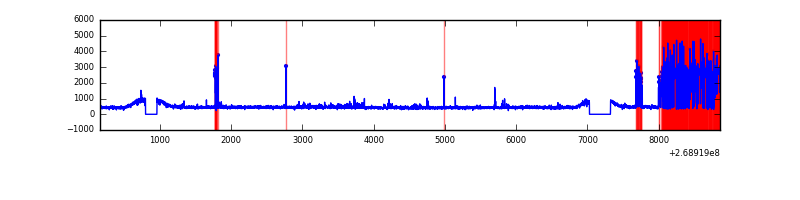 |
Top three noisy pixels from each quadrant. If the there are fewer than three noisy pixels in the level2.evt file, extra rows are filled as -1
| Pixel properties | Quadrant properties | ||||||
|---|---|---|---|---|---|---|---|
| Quadrant | DetID | PixID | Counts | Sigma | Mean | Median | Sigma |
| A | 12 | 189 | 99654 | 469.46 | 1032 | 1010 | 210.1 |
| A | 1 | 162 | 26742 | 122.46 | 1032 | 1010 | 210.1 |
| A | 1 | 178 | 11741 | 51.07 | 1032 | 1010 | 210.1 |
| B | 10 | 245 | 47104 | 231.67 | 1026 | 998 | 199.0 |
| B | 10 | 16 | 45563 | 223.93 | 1026 | 998 | 199.0 |
| B | 12 | 111 | 25076 | 120.99 | 1026 | 998 | 199.0 |
| C | 3 | 233 | 580286 | 2487.13 | 1001 | 1006 | 232.9 |
| C | 8 | 128 | 15878 | 63.85 | 1001 | 1006 | 232.9 |
| C | 7 | 247 | 13896 | 55.34 | 1001 | 1006 | 232.9 |
| D | 7 | 223 | 1799886 | 7744.66 | 948 | 918 | 232.3 |
| D | 10 | 70 | 118797 | 507.48 | 948 | 918 | 232.3 |
| D | 2 | 234 | 26695 | 110.97 | 948 | 918 | 232.3 |
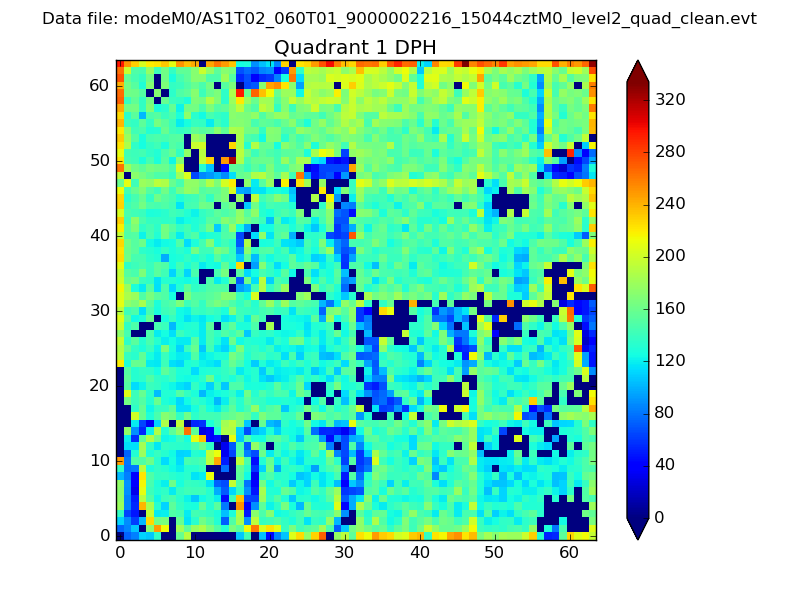
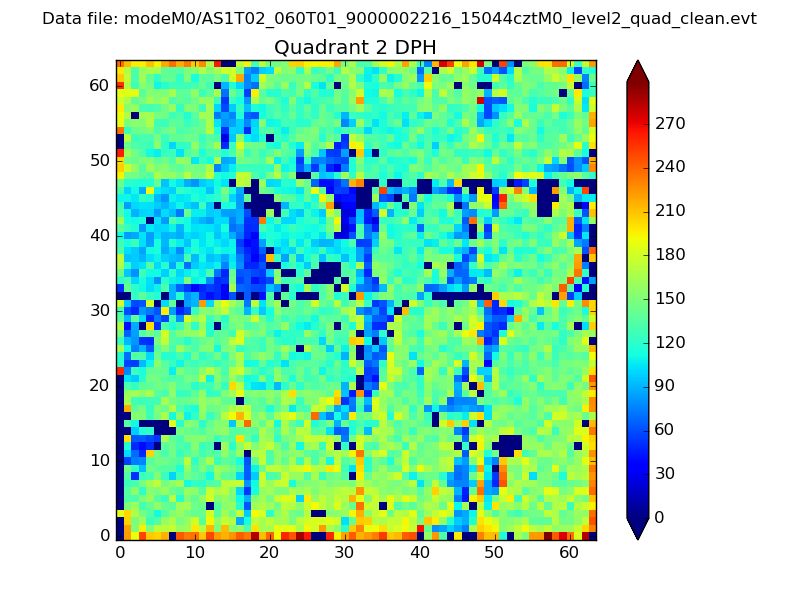
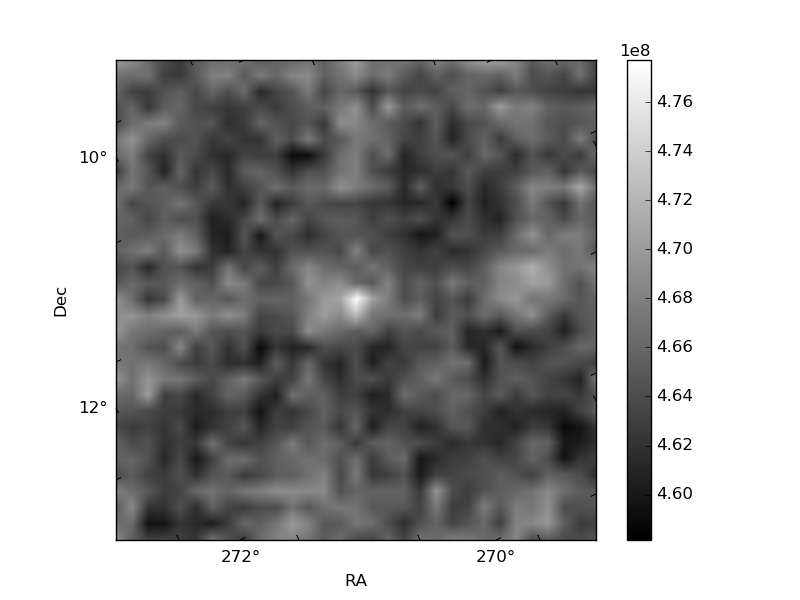
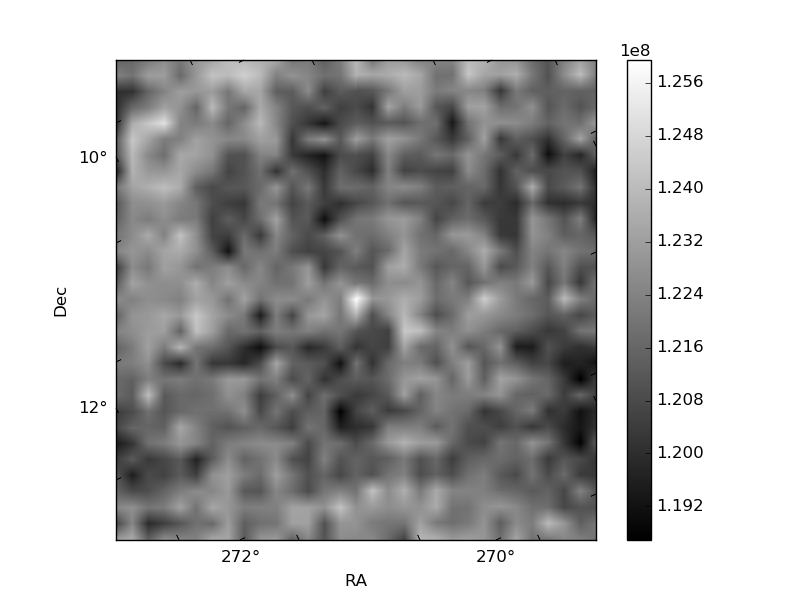
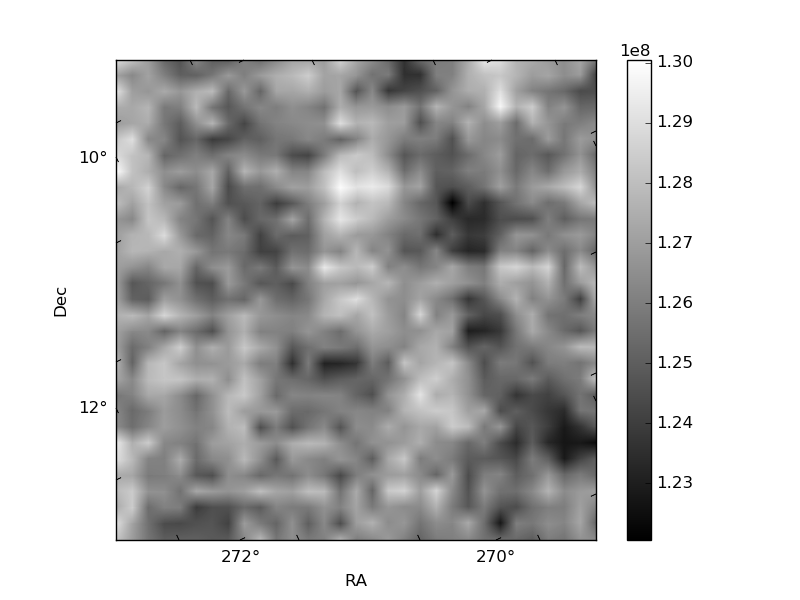
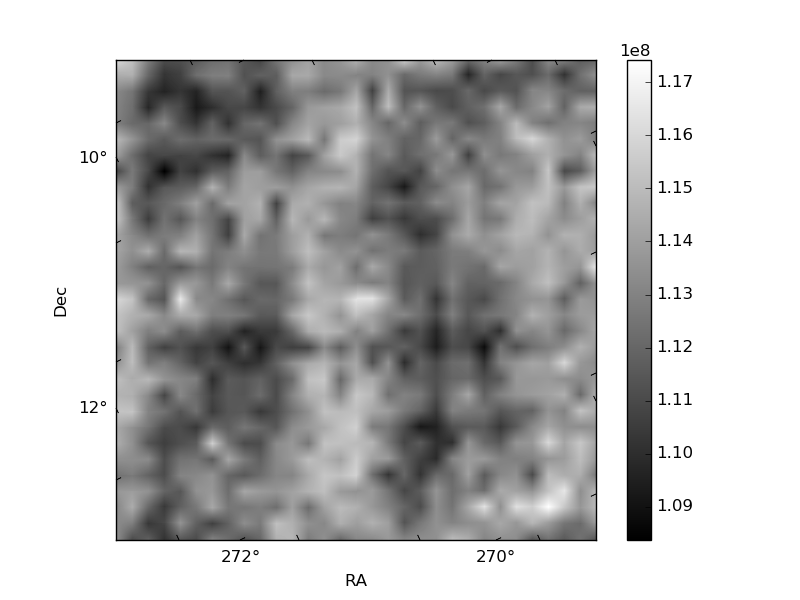
Histogram calculated using DETX and DETY for each event in the final _common_clean file
| Quadrant A | 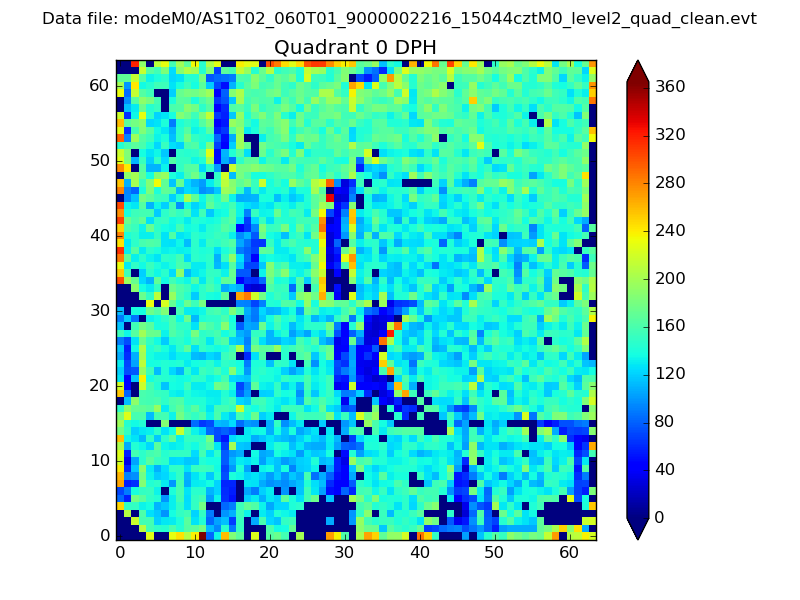 |
 |
Quadrant B |
|---|---|---|---|
| Quadrant D | 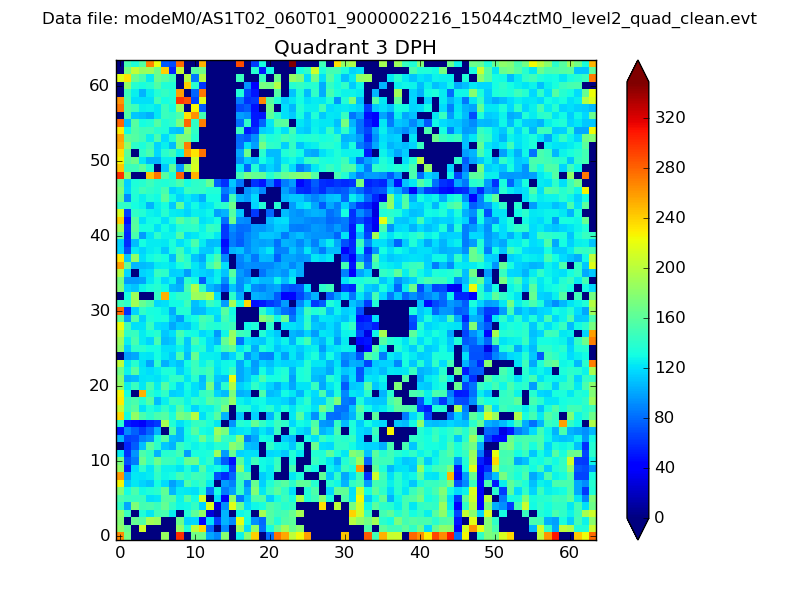 |
 |
Quadrant C |
| Plot type | Count rate plots | Images |
|---|---|---|
| Comparison with Poisson distribution Blue bars denote a histogram of data divided into 1 sec bins. Red curve is a Poisson curve with rate = median count rate of data. |
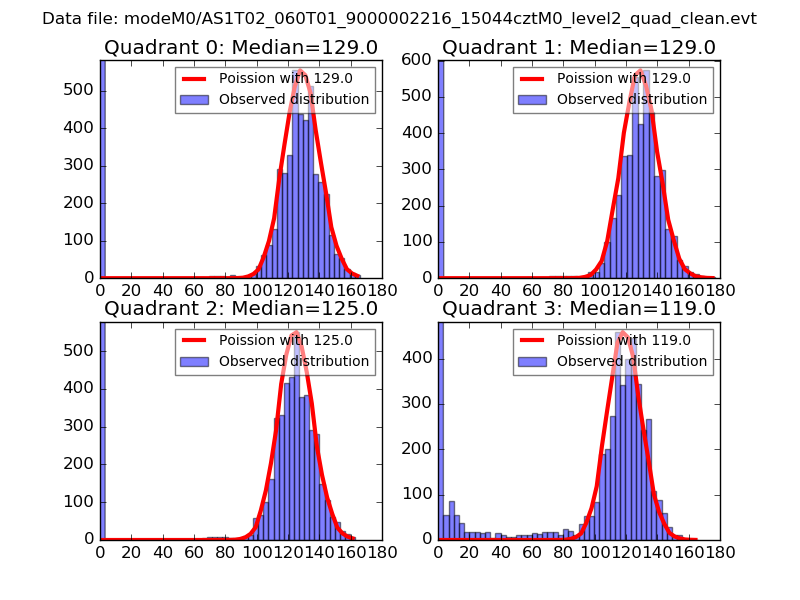 |
 |
| Quadrant-wise count rates Data is divided into 100 sec bins |
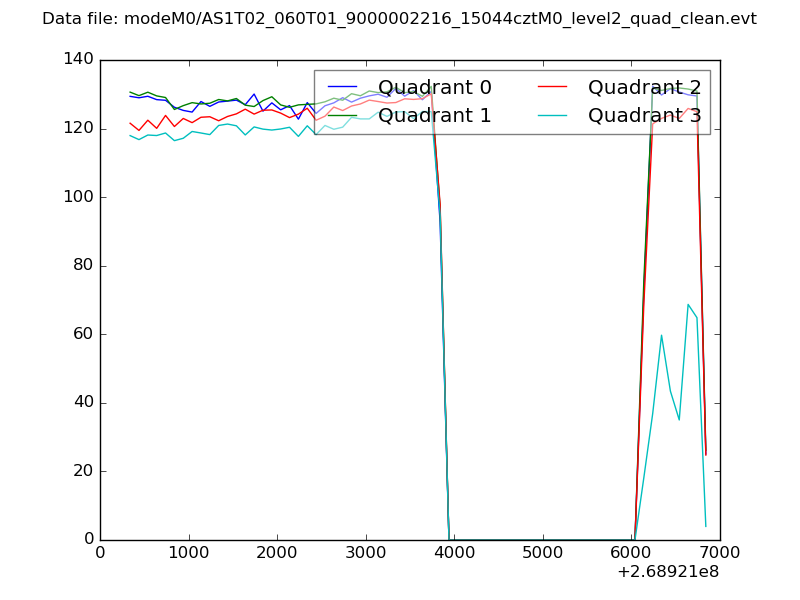 |
|
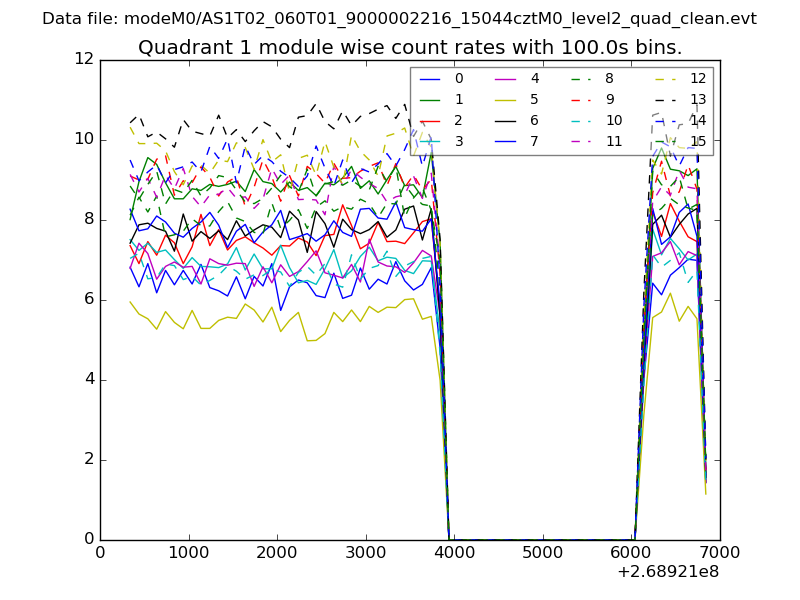
| Module-wise count rates for Quadrant A Data is divided into 100 sec bins |
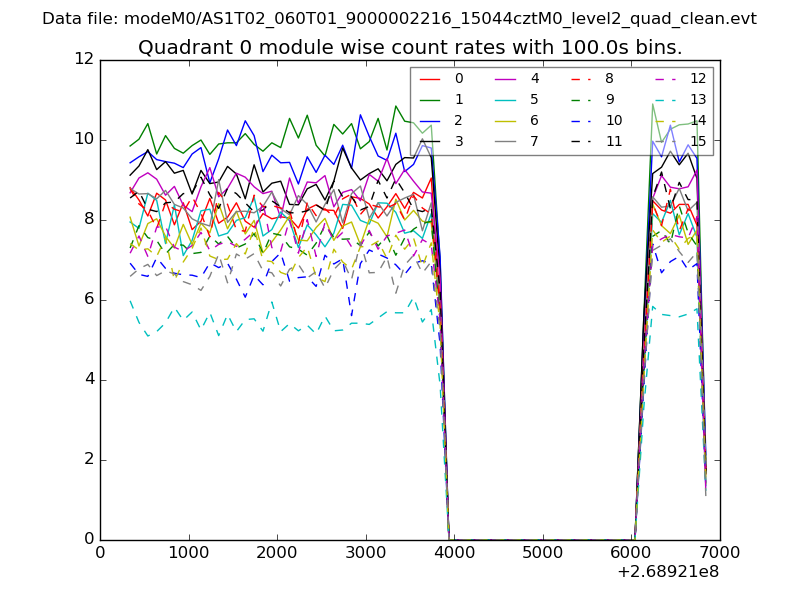 |
 |
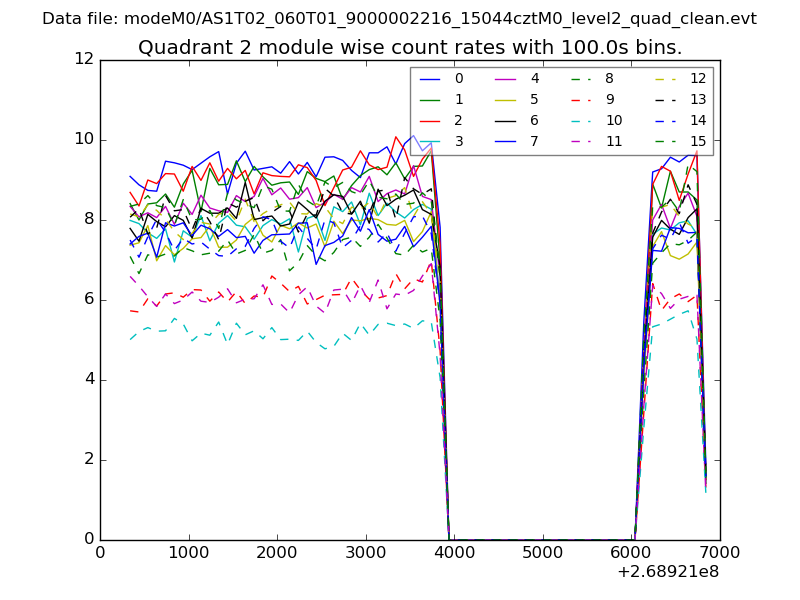
| Module-wise count rates for Quadrant B Data is divided into 100 sec bins |
 |
 |
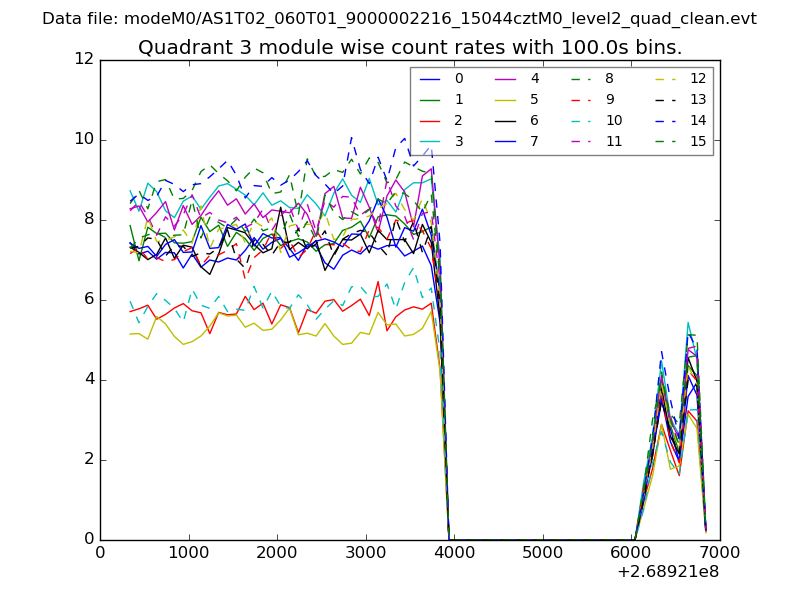
| Module-wise count rates for Quadrant C Data is divided into 100 sec bins |
 |
 |
| Module-wise count rates for Quadrant D Data is divided into 100 sec bins |
 |
 |
| Parameter | Plot |
|---|---|
| CZT HV Monitor | 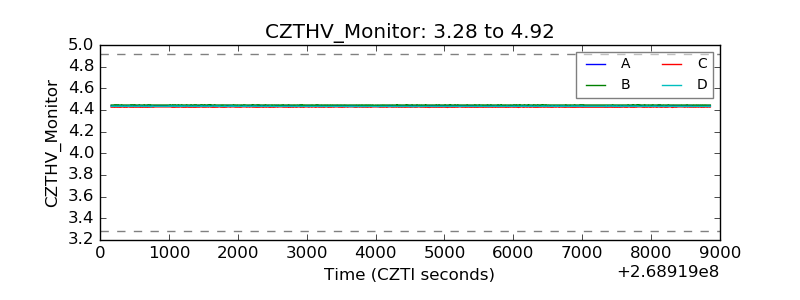 |
| D_VDD | 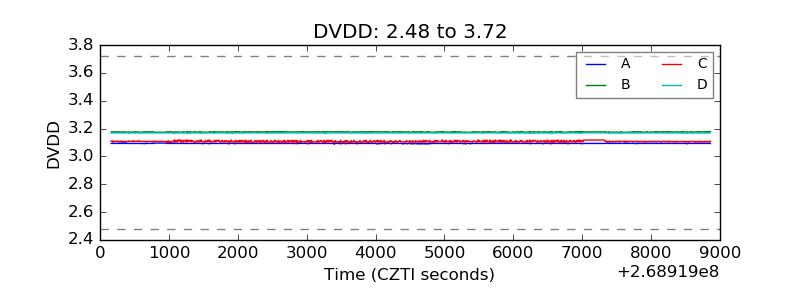 |
| Temperature 1 | 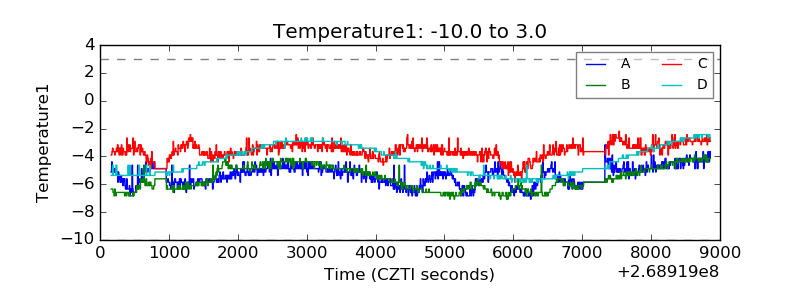 |
| Veto HV Monitor | 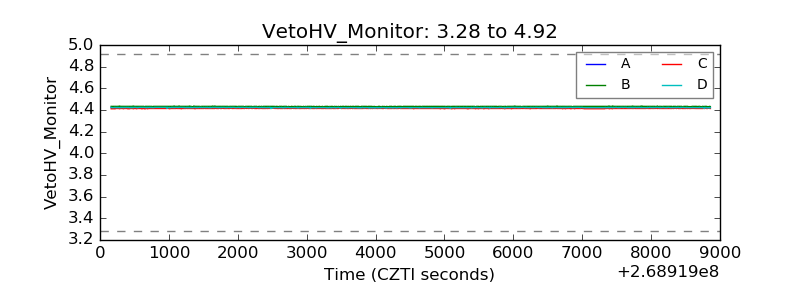 |
| Veto LLD | 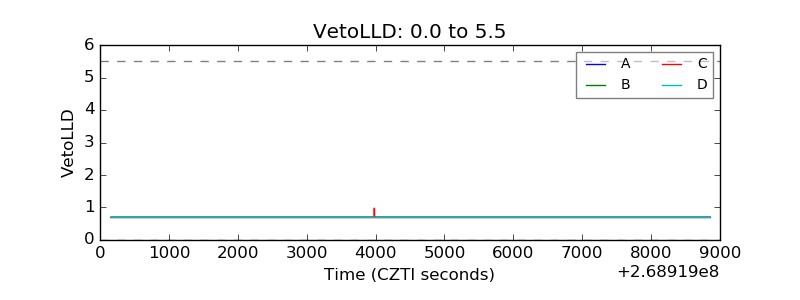 |
| Alpha Counter | 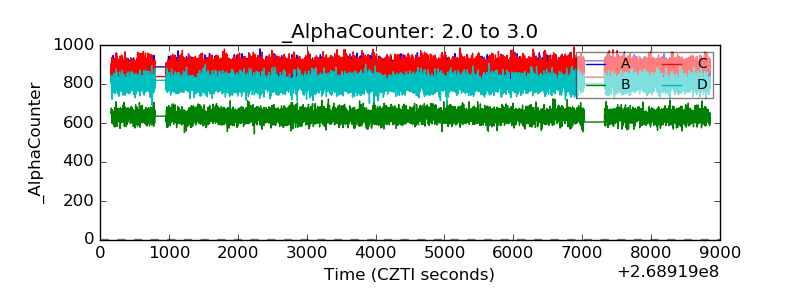 |
| _CPM_Rate | 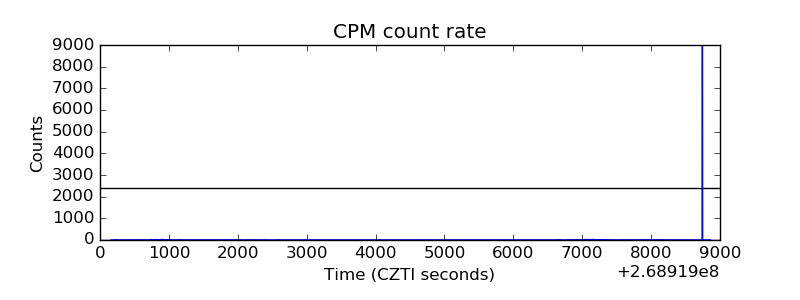 |
| CZT Counter | 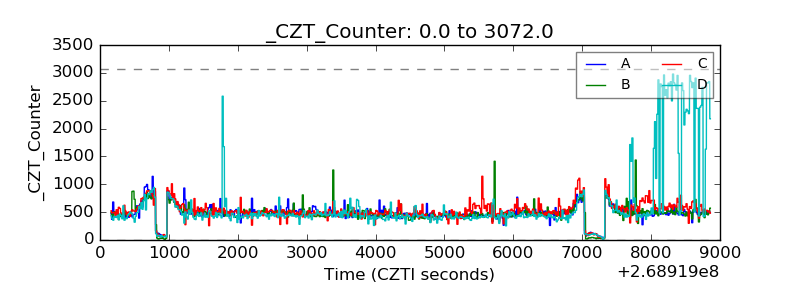 |
| +2.5 Volts monitor |  |
| +5 Volts monitor | 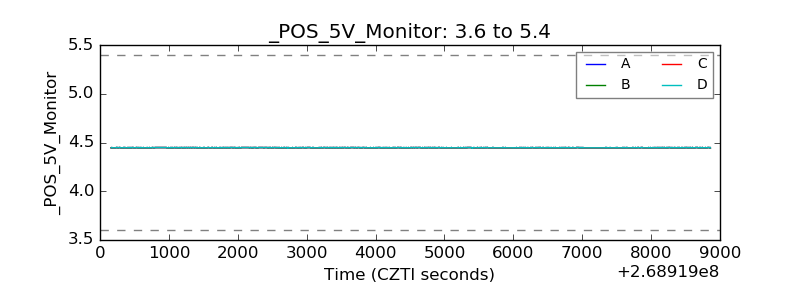 |
| _ROLL_ROT | 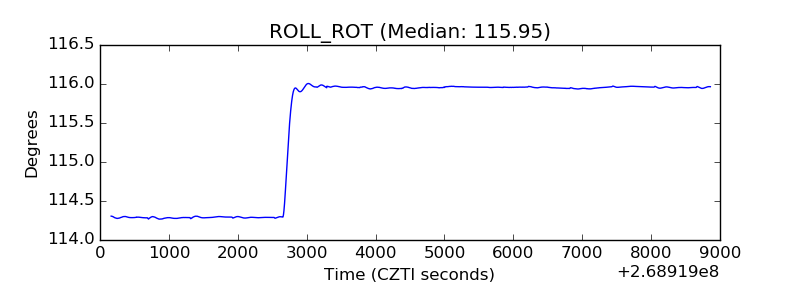 |
| _Roll_DEC | 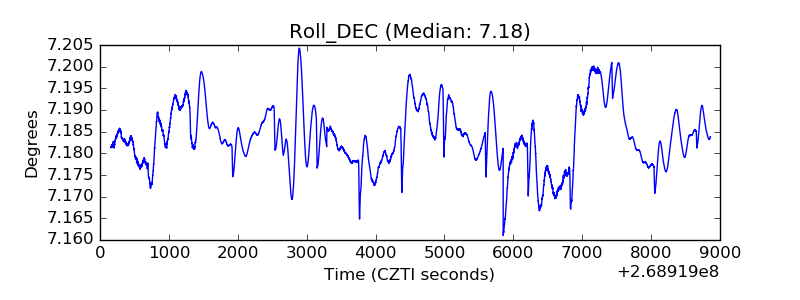 |
| _Roll_RA | 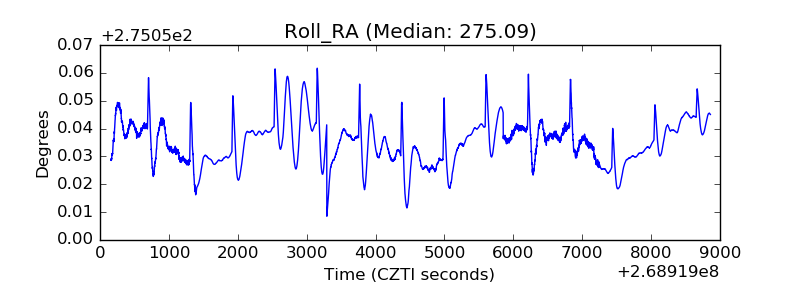 |
| Veto Counter | 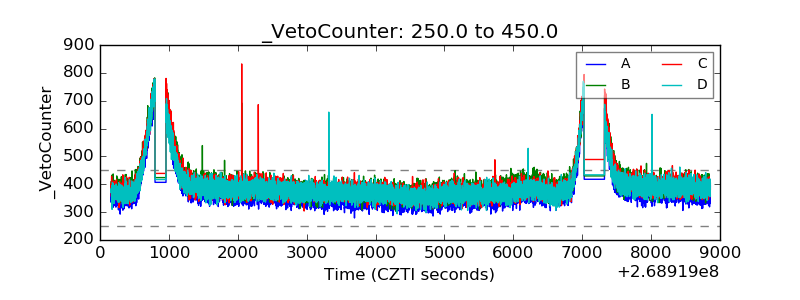 |