| Param | Original file | Final file |
|---|---|---|
| Filename | modeM0/AS1T02_060T01_9000002216_15048cztM0_level2.evt | modeM0/AS1T02_060T01_9000002216_15048cztM0_level2_quad_clean.evt |
| Size (bytes) | 439,479,360 | 85,654,080 |
| Size | 419.1 MB | 81.7 MB |
| Events in quadrant A | 2,993,606 | 541,083 |
| Events in quadrant B | 3,120,043 | 554,270 |
| Events in quadrant C | 3,820,128 | 535,584 |
| Events in quadrant D | 2,944,806 | 520,254 |
| Mode M0 | |||
|---|---|---|---|
| Quadrant | BADHDUFLAG | Total packets | Discarded packets |
| A | 0 | 13096 | 2 |
| B | 0 | 13401 | 1 |
| C | 0 | 15852 | 1 |
| D | 0 | 13260 | 1 |
| Mode M9 | |||
|---|---|---|---|
| Quadrant | BADHDUFLAG | Total packets | Discarded packets |
| A | 0 | 10 | 0 |
| B | 0 | 10 | 0 |
| C | 0 | 10 | 0 |
| D | 0 | 10 | 0 |
| Mode SS | |||
|---|---|---|---|
| Quadrant | BADHDUFLAG | Total packets | Discarded packets |
| A | 0 | 128 | 0 |
| B | 0 | 128 | 0 |
| C | 0 | 128 | 0 |
| D | 0 | 128 | 0 |
| Quadrant | Total seconds | Saturated seconds | Saturation percentage |
|---|---|---|---|
| A | 6346 | 34 | 0.535771% |
| B | 6346 | 49 | 0.772140% |
| C | 6346 | 31 | 0.488497% |
| D | 6346 | 40 | 0.630318% |
Noise dominated data is calculated using 1-second bins in cleaned event files. If a bin has >2000 counts, and if more than 50% of those come from <1% of pixels, then it is considered to be noise-dominated and hence unusable.
| Quadrant | # 1 sec bins | Bins with >0 counts | Bins with >2000 counts | High rate bins dominated by noise | Noise dominated (total time) | Noise dominated (detector-on time) | Marked lightcurve |
|---|---|---|---|---|---|---|---|
| A | 7337 | 6347 | 0 | 0 | 0.00% | 0.00% | 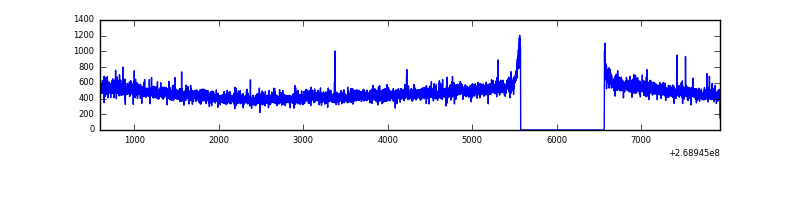 |
| B | 7337 | 6347 | 2 | 2 | 0.03% | 0.03% | 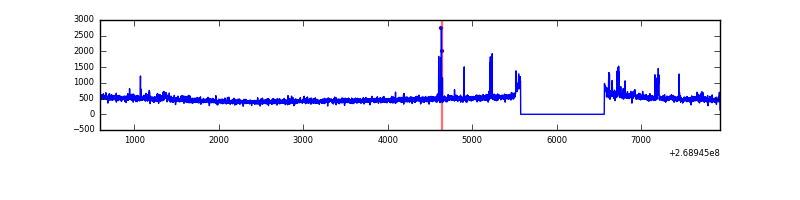 |
| C | 7337 | 6348 | 0 | 0 | 0.00% | 0.00% | 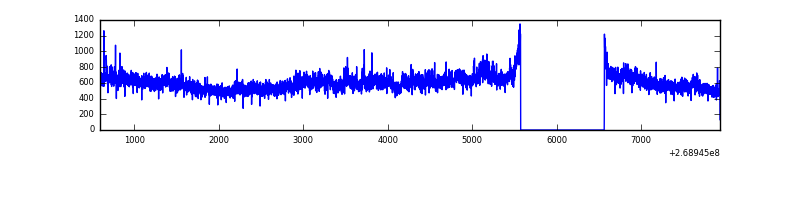 |
| D | 7337 | 6348 | 12 | 12 | 0.16% | 0.19% | 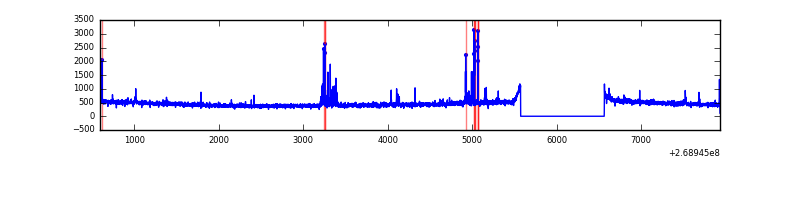 |
Top three noisy pixels from each quadrant. If the there are fewer than three noisy pixels in the level2.evt file, extra rows are filled as -1
| Pixel properties | Quadrant properties | ||||||
|---|---|---|---|---|---|---|---|
| Quadrant | DetID | PixID | Counts | Sigma | Mean | Median | Sigma |
| A | 1 | 162 | 18184 | 112.3 | 769 | 753 | 155.2 |
| A | 1 | 178 | 7015 | 40.34 | 769 | 753 | 155.2 |
| A | 0 | 226 | 6525 | 37.19 | 769 | 753 | 155.2 |
| B | 3 | 64 | 101995 | 685.4 | 767 | 749 | 147.7 |
| B | 12 | 111 | 17761 | 115.17 | 767 | 749 | 147.7 |
| B | 11 | 111 | 15481 | 99.73 | 767 | 749 | 147.7 |
| C | 3 | 233 | 845487 | 4861.66 | 749 | 754 | 173.8 |
| C | 7 | 247 | 25176 | 140.55 | 749 | 754 | 173.8 |
| C | 8 | 128 | 11946 | 64.41 | 749 | 754 | 173.8 |
| D | 10 | 70 | 65748 | 358.85 | 748 | 726 | 181.2 |
| D | 13 | 104 | 50601 | 275.25 | 748 | 726 | 181.2 |
| D | 2 | 234 | 20685 | 110.15 | 748 | 726 | 181.2 |
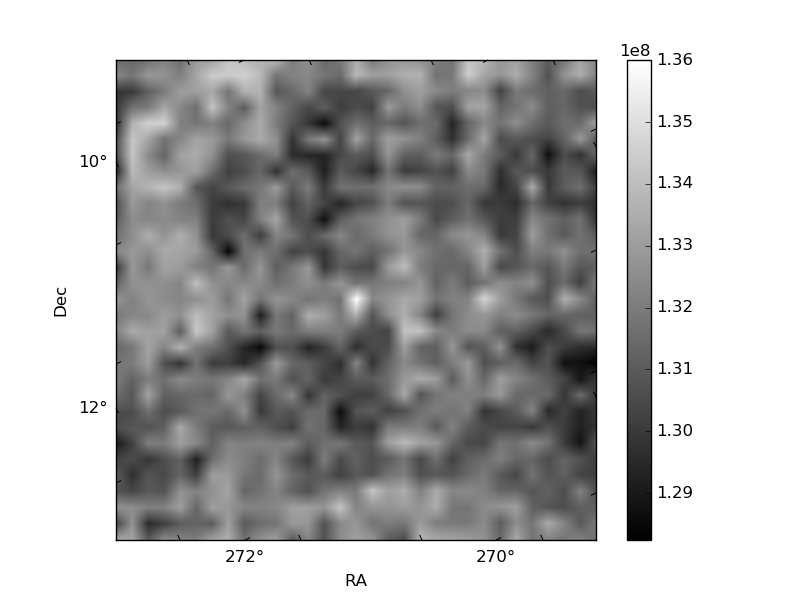
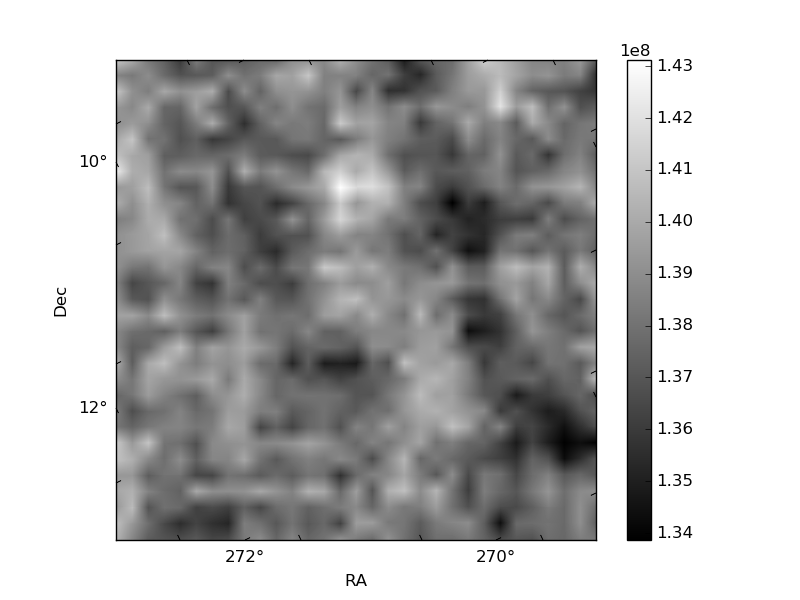
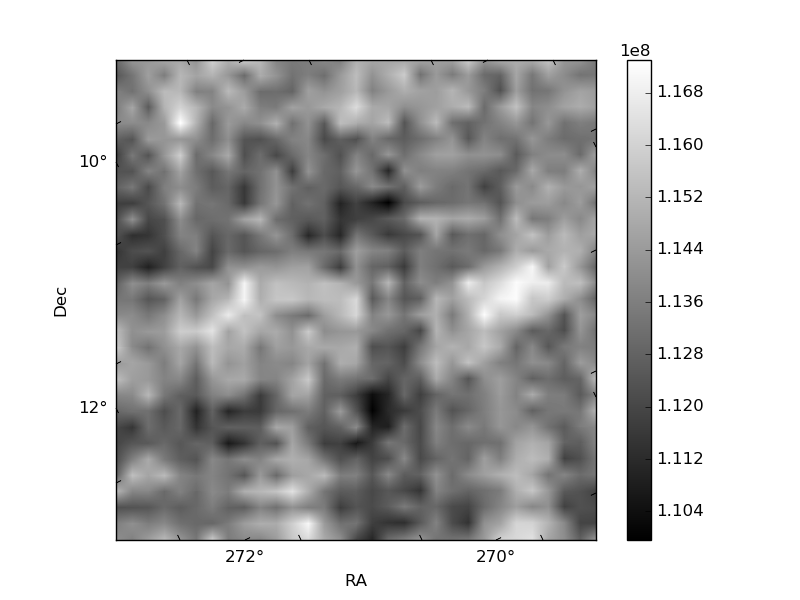
Histogram calculated using DETX and DETY for each event in the final _common_clean file
| Quadrant A |  |
 |
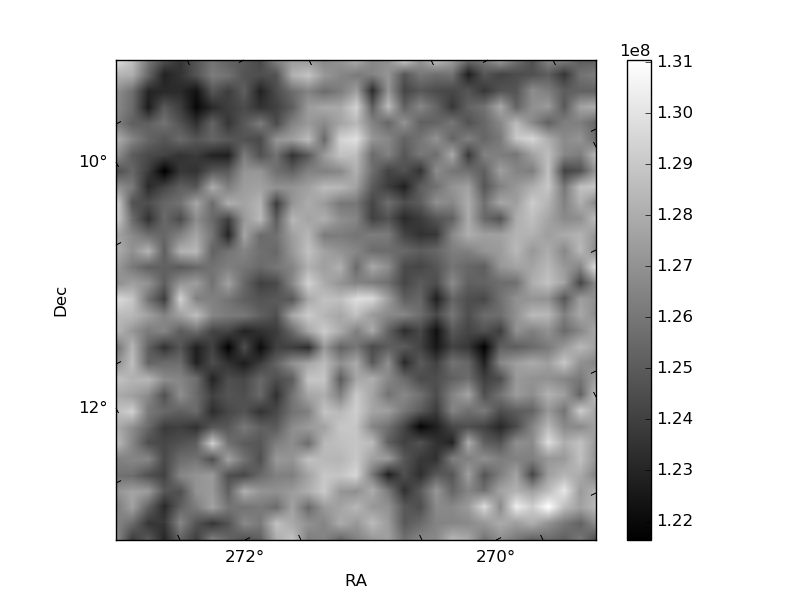
Quadrant B |
|---|---|---|---|
| Quadrant D |  |
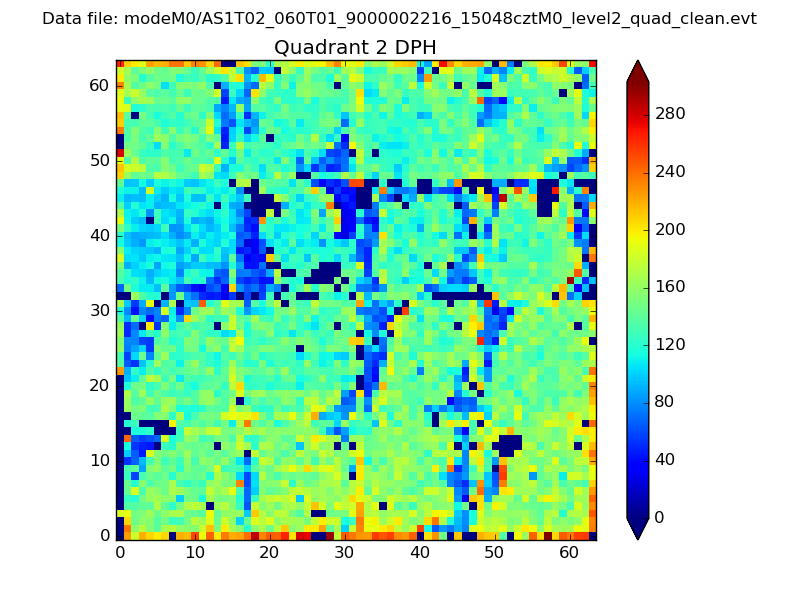 |
Quadrant C |
| Plot type | Count rate plots | Images |
|---|---|---|
| Comparison with Poisson distribution Blue bars denote a histogram of data divided into 1 sec bins. Red curve is a Poisson curve with rate = median count rate of data. |
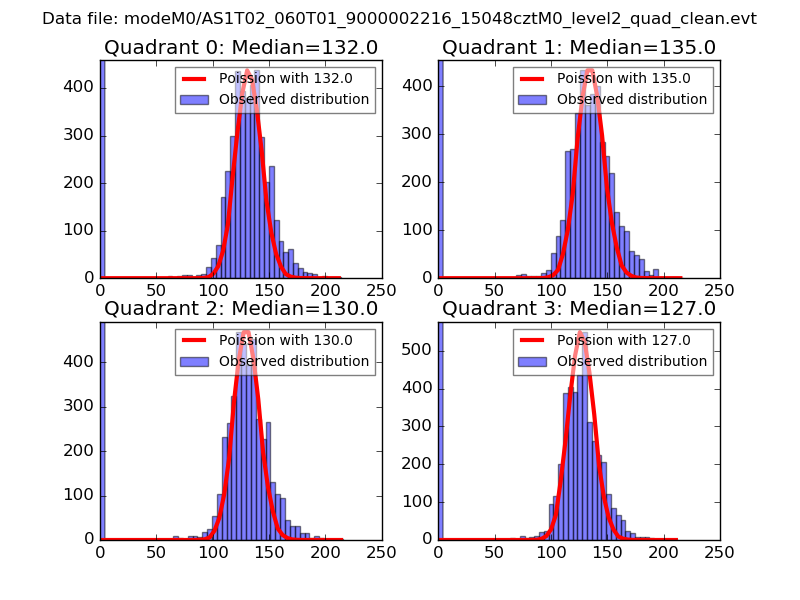 |
 |
| Quadrant-wise count rates Data is divided into 100 sec bins |
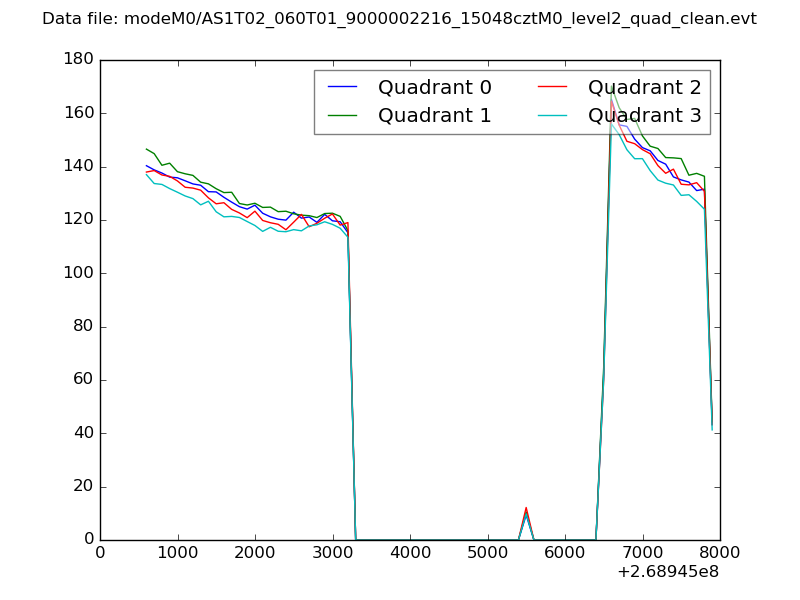 |
|
| Module-wise count rates for Quadrant A Data is divided into 100 sec bins |
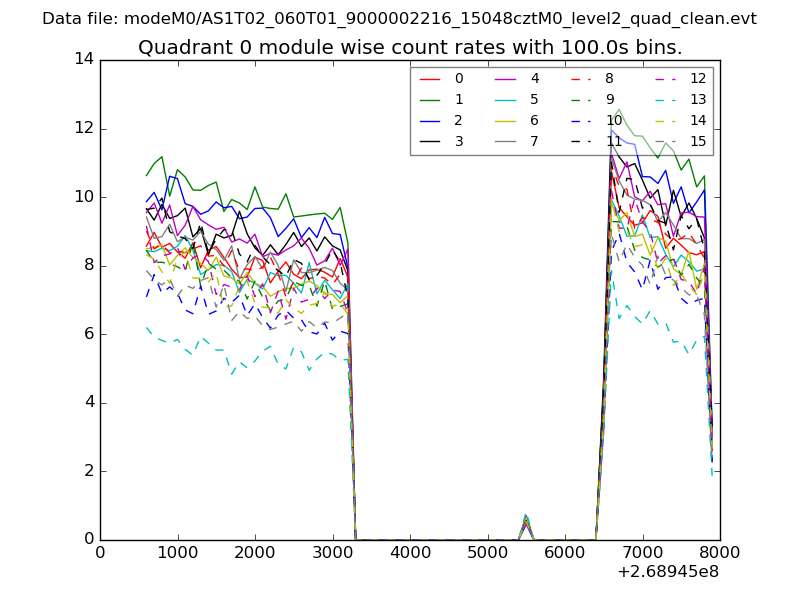 |
 |
| Module-wise count rates for Quadrant B Data is divided into 100 sec bins |
 |
 |
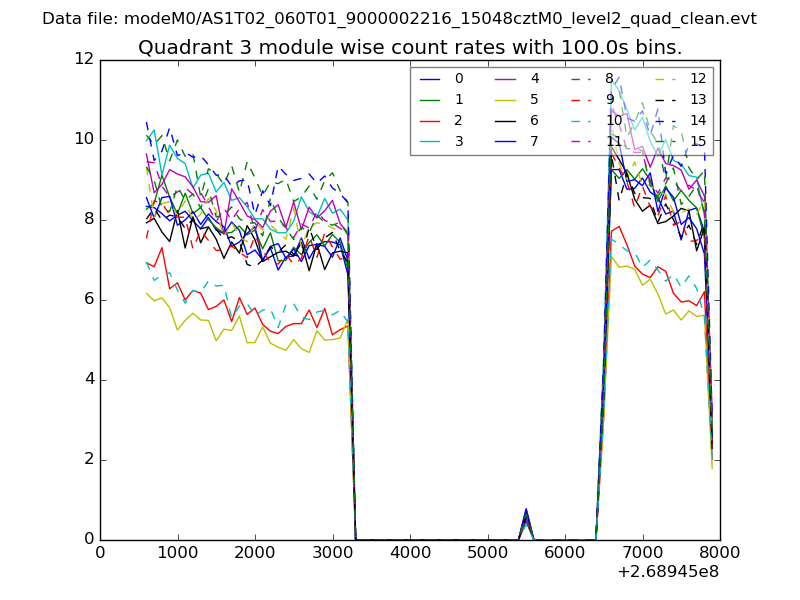
| Module-wise count rates for Quadrant C Data is divided into 100 sec bins |
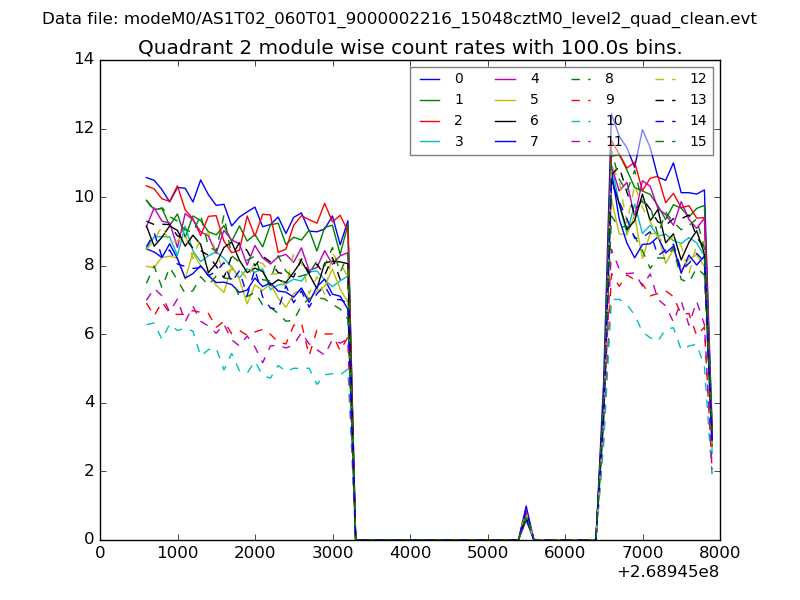 |
 |
| Module-wise count rates for Quadrant D Data is divided into 100 sec bins |
 |
 |
| Parameter | Plot |
|---|---|
| CZT HV Monitor |  |
| D_VDD | 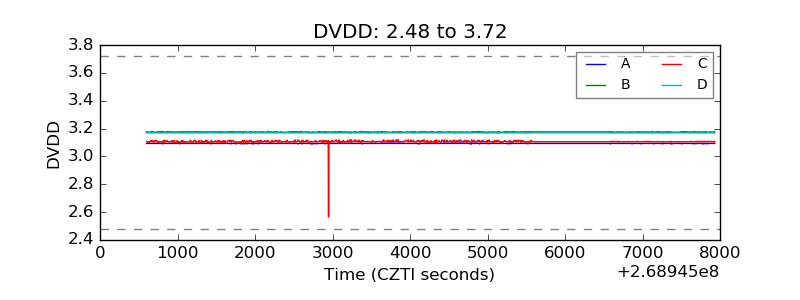 |
| Temperature 1 | 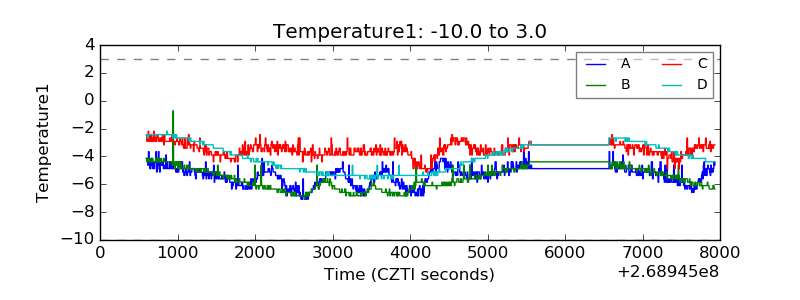 |
| Veto HV Monitor | 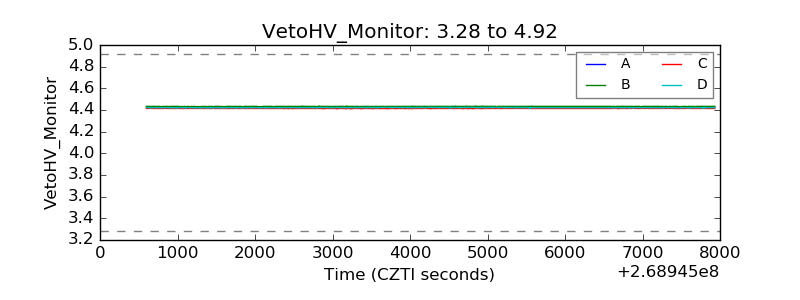 |
| Veto LLD | 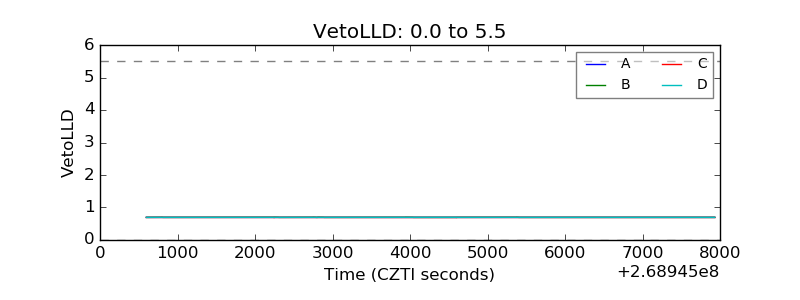 |
| Alpha Counter | 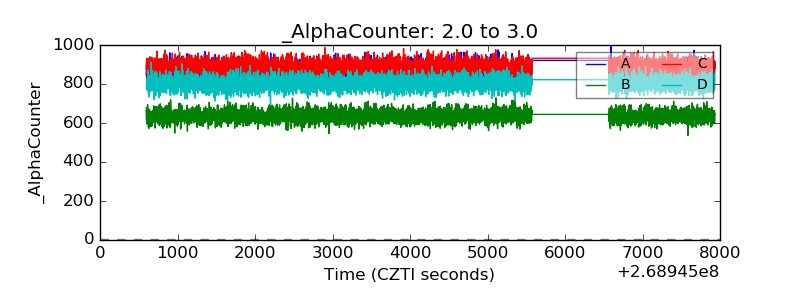 |
| _CPM_Rate | 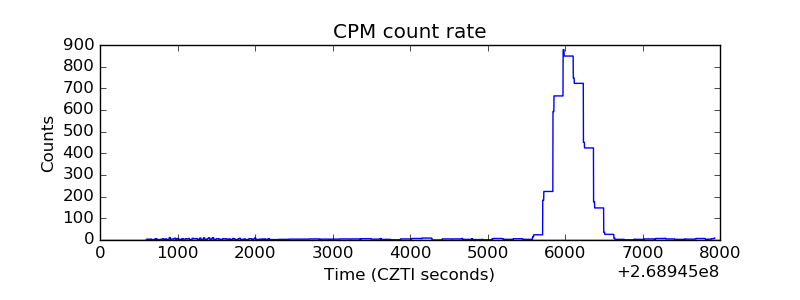 |
| CZT Counter | 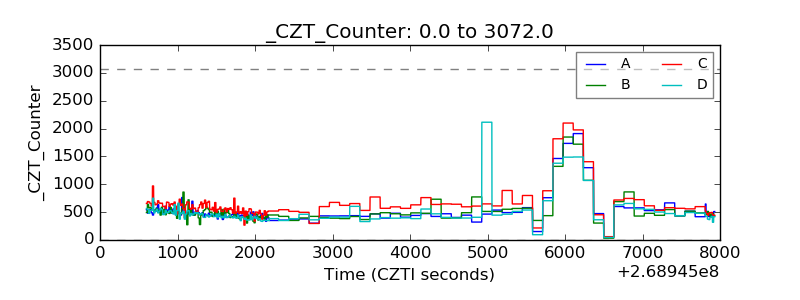 |
| +2.5 Volts monitor |  |
| +5 Volts monitor | 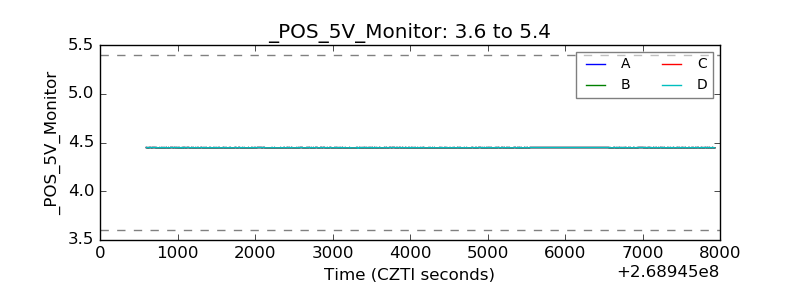 |
| _ROLL_ROT | 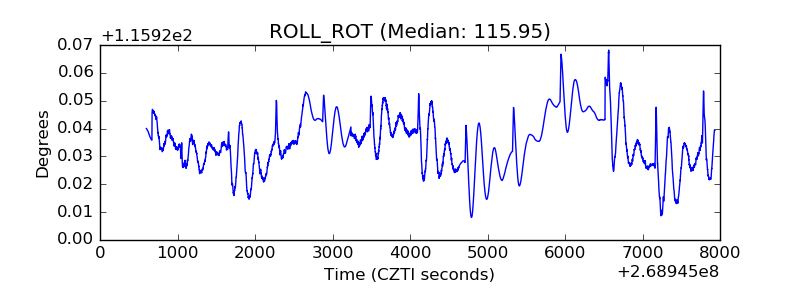 |
| _Roll_DEC | 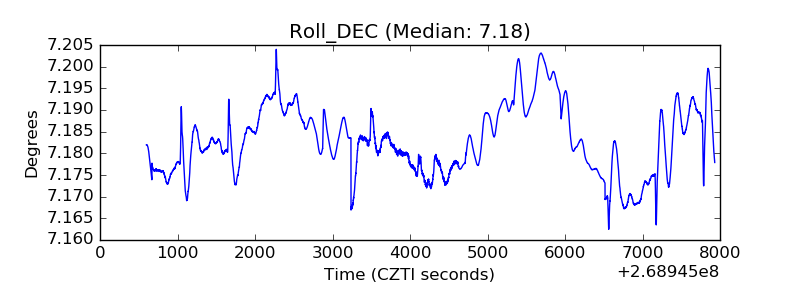 |
| _Roll_RA | 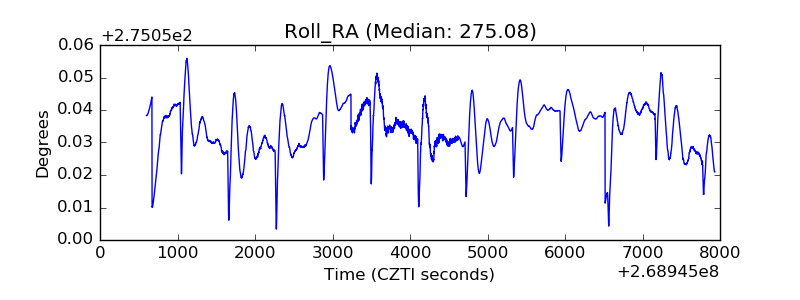 |
| Veto Counter | 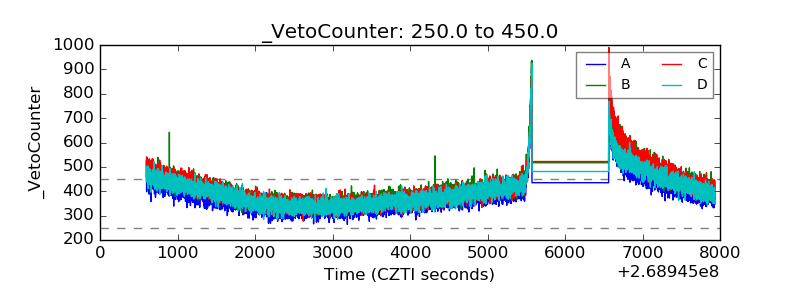 |