| Param | Original file | Final file |
|---|---|---|
| Filename | modeM0/AS1T02_060T01_9000002216_15051cztM0_level2.evt | modeM0/AS1T02_060T01_9000002216_15051cztM0_level2_quad_clean.evt |
| Size (bytes) | 442,535,040 | 91,742,400 |
| Size | 422.0 MB | 87.5 MB |
| Events in quadrant A | 3,145,188 | 591,549 |
| Events in quadrant B | 3,190,244 | 613,667 |
| Events in quadrant C | 3,509,657 | 585,735 |
| Events in quadrant D | 3,134,221 | 552,703 |
| Mode M0 | |||
|---|---|---|---|
| Quadrant | BADHDUFLAG | Total packets | Discarded packets |
| A | 0 | 13228 | 3 |
| B | 0 | 13340 | 2 |
| C | 0 | 14293 | 2 |
| D | 0 | 13579 | 2 |
| Mode M9 | |||
|---|---|---|---|
| Quadrant | BADHDUFLAG | Total packets | Discarded packets |
| A | 0 | 16 | 0 |
| B | 0 | 16 | 0 |
| C | 0 | 16 | 0 |
| D | 0 | 17 | 0 |
| Mode SS | |||
|---|---|---|---|
| Quadrant | BADHDUFLAG | Total packets | Discarded packets |
| A | 0 | 126 | 0 |
| B | 0 | 126 | 0 |
| C | 0 | 126 | 0 |
| D | 0 | 126 | 0 |
| Quadrant | Total seconds | Saturated seconds | Saturation percentage |
|---|---|---|---|
| A | 6229 | 19 | 0.305025% |
| B | 6229 | 21 | 0.337133% |
| C | 6229 | 12 | 0.192647% |
| D | 6229 | 65 | 1.043506% |
Noise dominated data is calculated using 1-second bins in cleaned event files. If a bin has >2000 counts, and if more than 50% of those come from <1% of pixels, then it is considered to be noise-dominated and hence unusable.
| Quadrant | # 1 sec bins | Bins with >0 counts | Bins with >2000 counts | High rate bins dominated by noise | Noise dominated (total time) | Noise dominated (detector-on time) | Marked lightcurve |
|---|---|---|---|---|---|---|---|
| A | 7505 | 6231 | 1 | 1 | 0.01% | 0.02% | 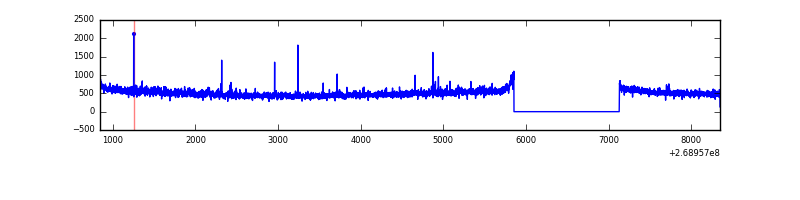 |
| B | 7505 | 6231 | 0 | 0 | 0.00% | 0.00% | 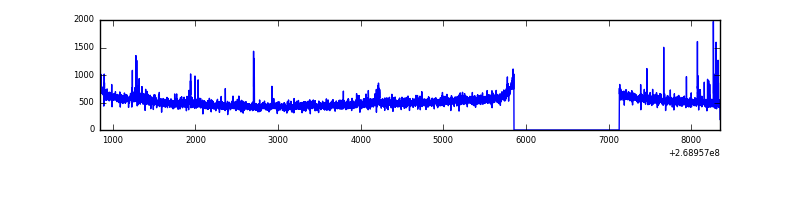 |
| C | 7505 | 6231 | 0 | 0 | 0.00% | 0.00% | 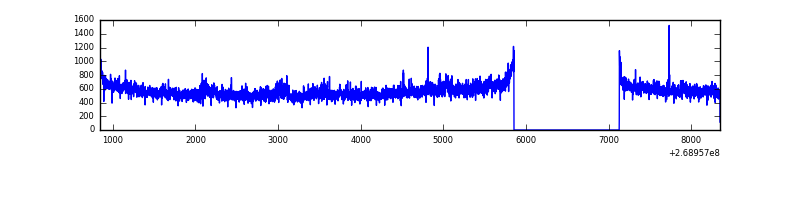 |
| D | 7505 | 6231 | 50 | 50 | 0.67% | 0.80% | 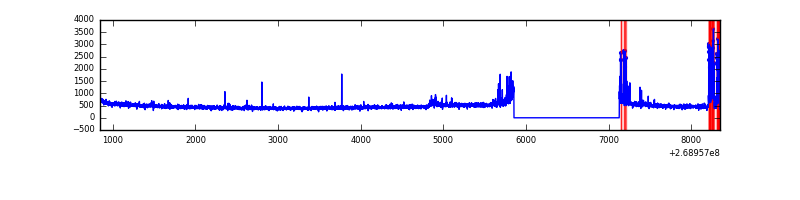 |
Top three noisy pixels from each quadrant. If the there are fewer than three noisy pixels in the level2.evt file, extra rows are filled as -1
| Pixel properties | Quadrant properties | ||||||
|---|---|---|---|---|---|---|---|
| Quadrant | DetID | PixID | Counts | Sigma | Mean | Median | Sigma |
| A | 12 | 189 | 37890 | 236.36 | 785 | 771 | 157.0 |
| A | 1 | 162 | 37391 | 233.19 | 785 | 771 | 157.0 |
| A | 1 | 178 | 17372 | 105.71 | 785 | 771 | 157.0 |
| B | 10 | 16 | 37581 | 246.23 | 790 | 771 | 149.5 |
| B | 3 | 64 | 32086 | 209.48 | 790 | 771 | 149.5 |
| B | 0 | 214 | 19589 | 125.88 | 790 | 771 | 149.5 |
| C | 3 | 233 | 528036 | 3015.32 | 762 | 771 | 174.9 |
| C | 7 | 247 | 7829 | 40.36 | 762 | 771 | 174.9 |
| C | 13 | 61 | 5439 | 26.7 | 762 | 771 | 174.9 |
| D | 13 | 249 | 230368 | 1254.03 | 754 | 730 | 183.1 |
| D | 7 | 223 | 29160 | 155.25 | 754 | 730 | 183.1 |
| D | 2 | 234 | 19135 | 100.51 | 754 | 730 | 183.1 |
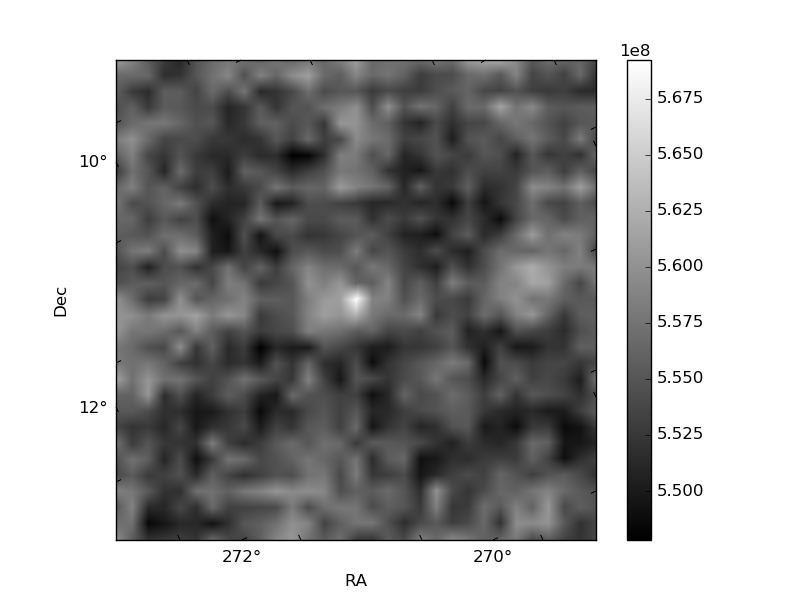
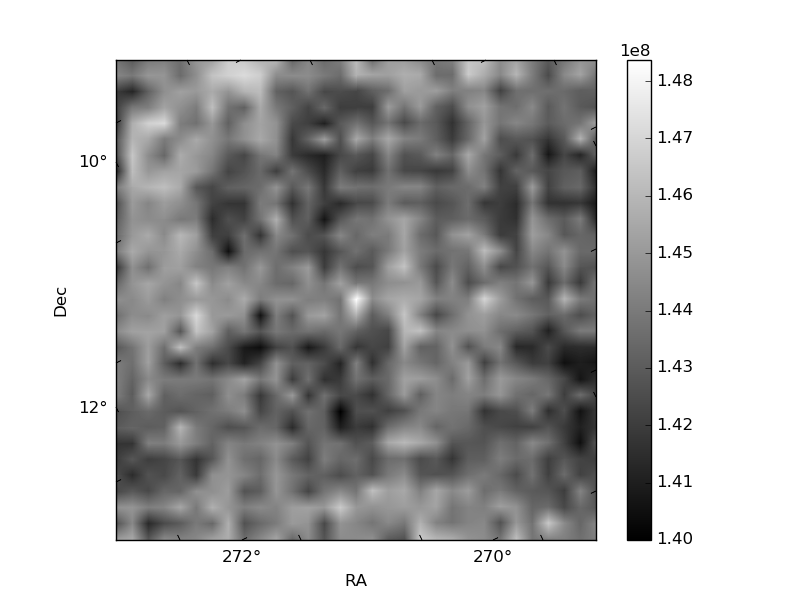
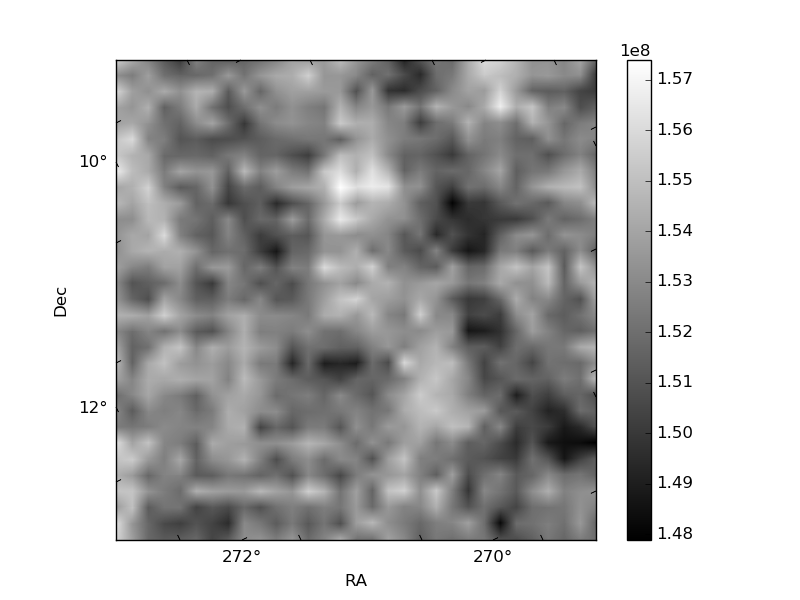
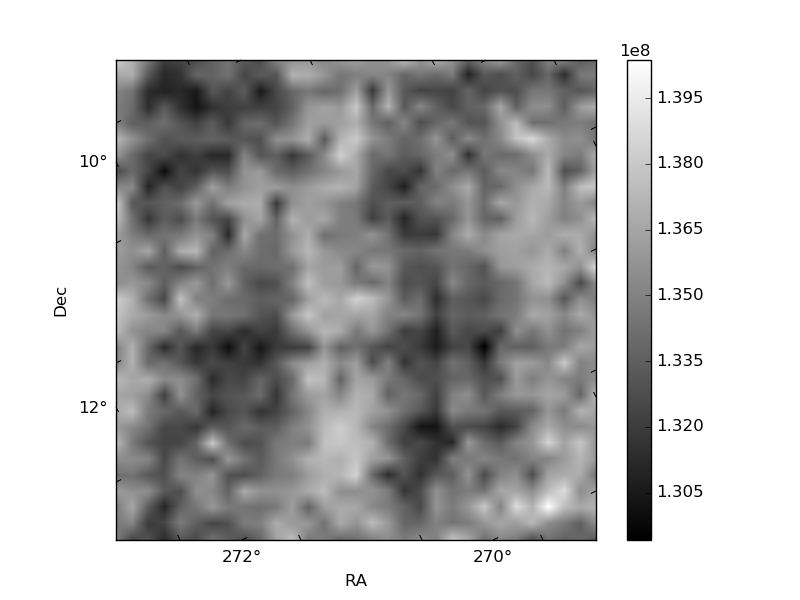
Histogram calculated using DETX and DETY for each event in the final _common_clean file
| Quadrant A | 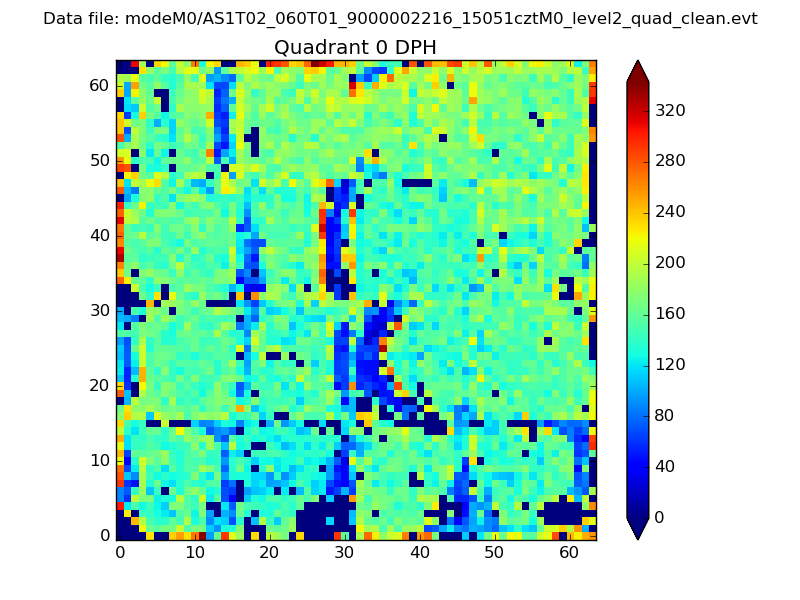 |
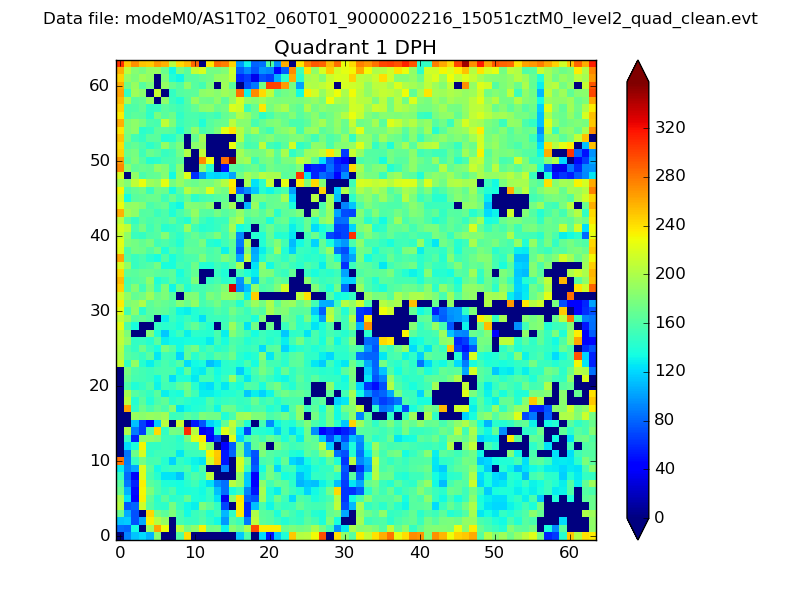 |
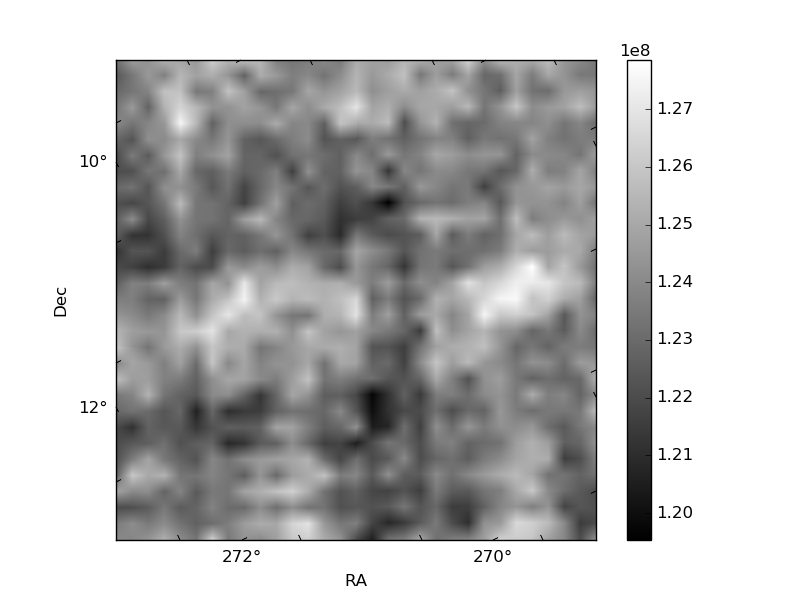
Quadrant B |
|---|---|---|---|
| Quadrant D | 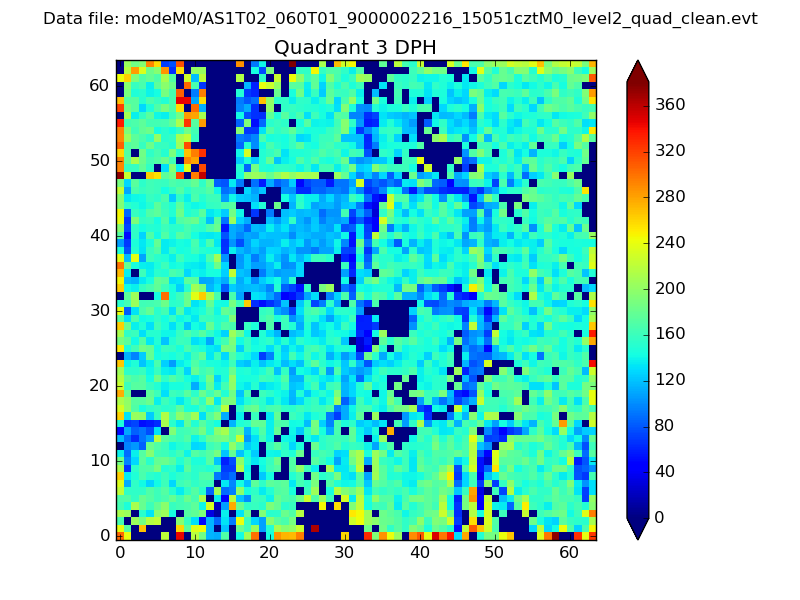 |
 |
Quadrant C |
| Plot type | Count rate plots | Images |
|---|---|---|
| Comparison with Poisson distribution Blue bars denote a histogram of data divided into 1 sec bins. Red curve is a Poisson curve with rate = median count rate of data. |
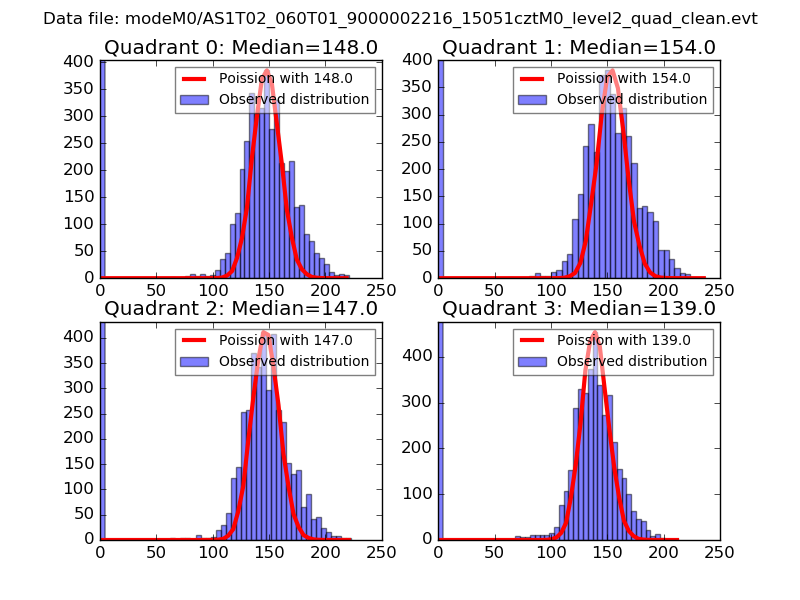 |
 |
| Quadrant-wise count rates Data is divided into 100 sec bins |
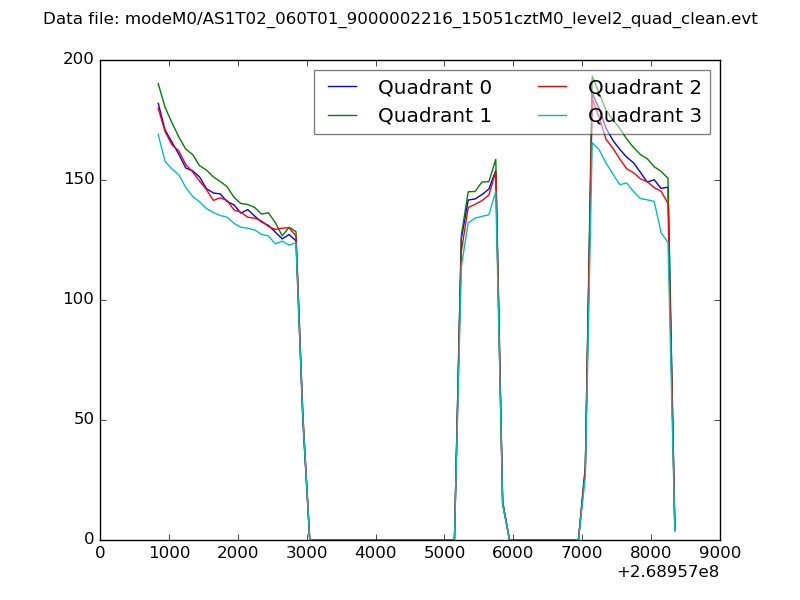 |
|
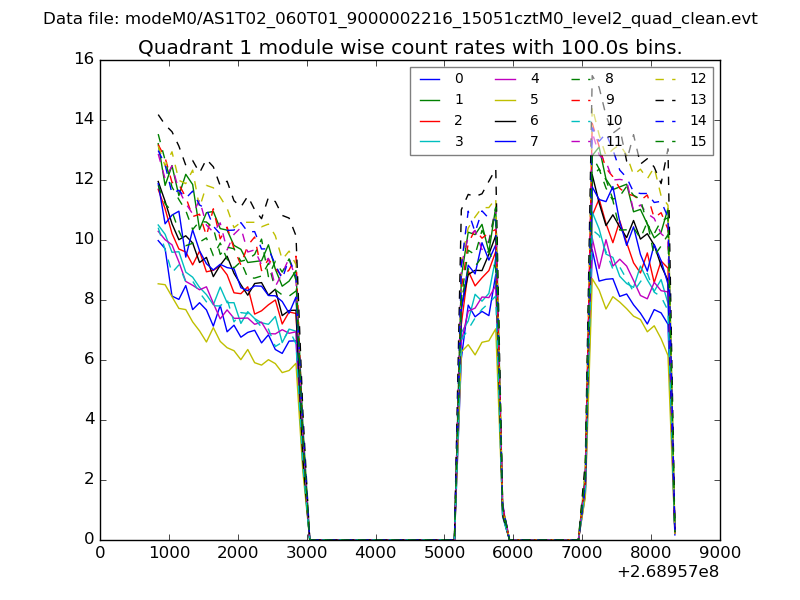
| Module-wise count rates for Quadrant A Data is divided into 100 sec bins |
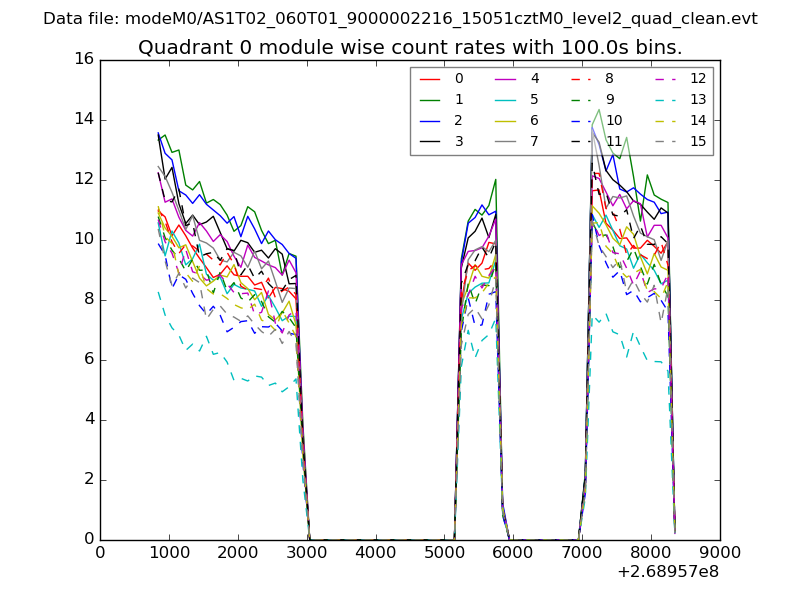 |
 |
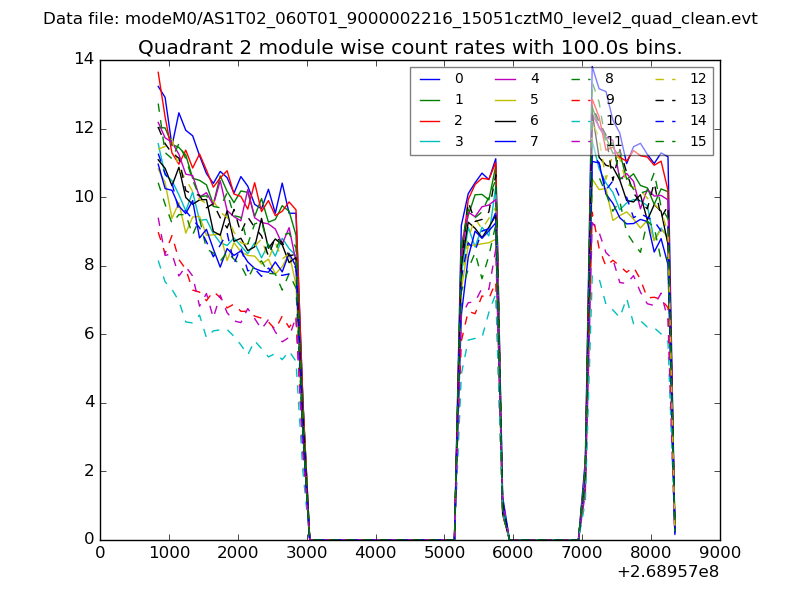
| Module-wise count rates for Quadrant B Data is divided into 100 sec bins |
 |
 |
| Module-wise count rates for Quadrant C Data is divided into 100 sec bins |
 |
 |
| Module-wise count rates for Quadrant D Data is divided into 100 sec bins |
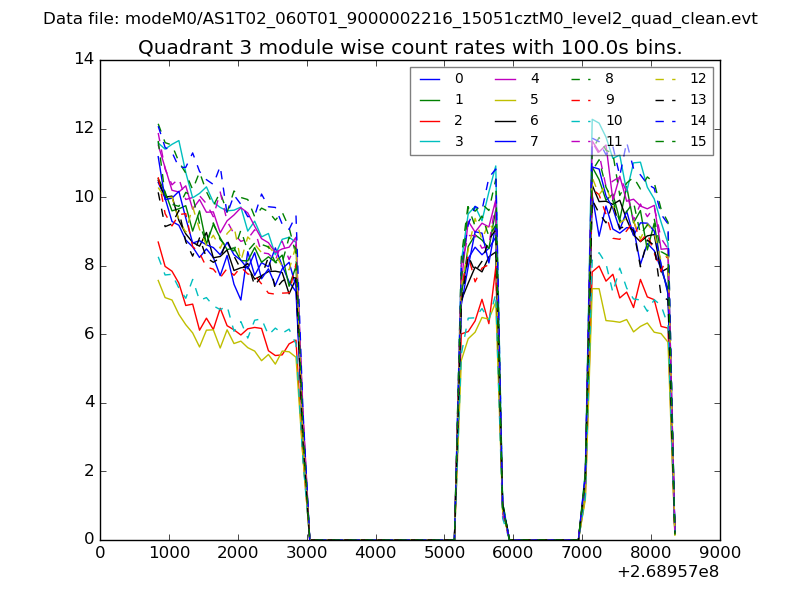 |
 |
| Parameter | Plot |
|---|---|
| CZT HV Monitor | 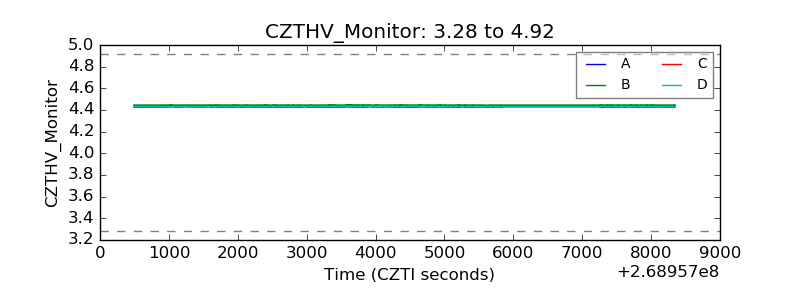 |
| D_VDD | 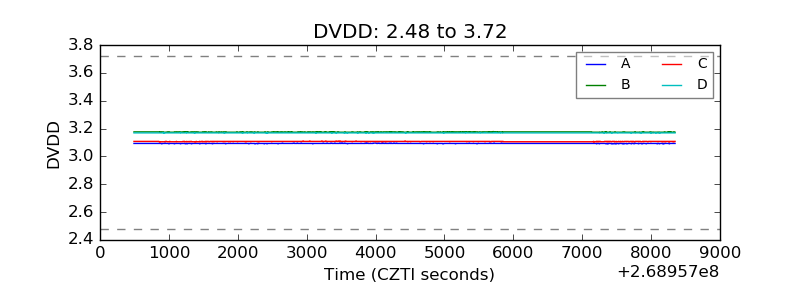 |
| Temperature 1 | 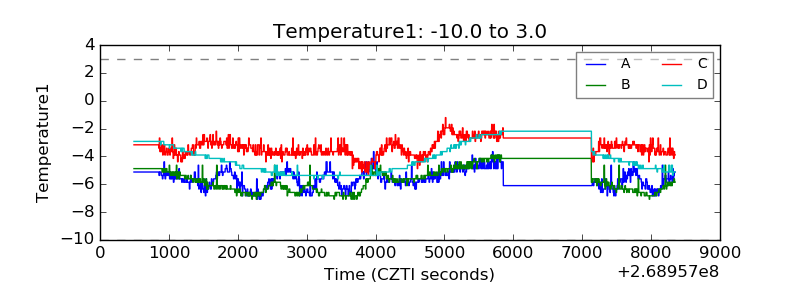 |
| Veto HV Monitor | 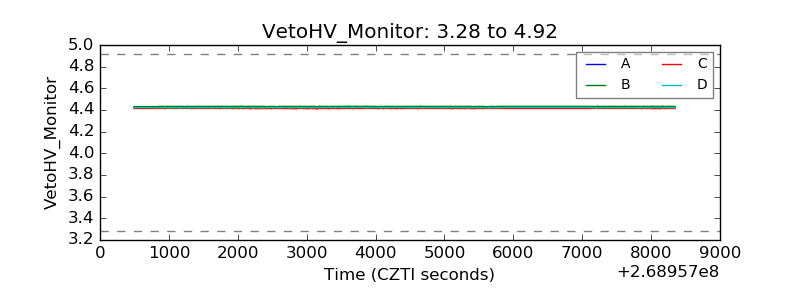 |
| Veto LLD | 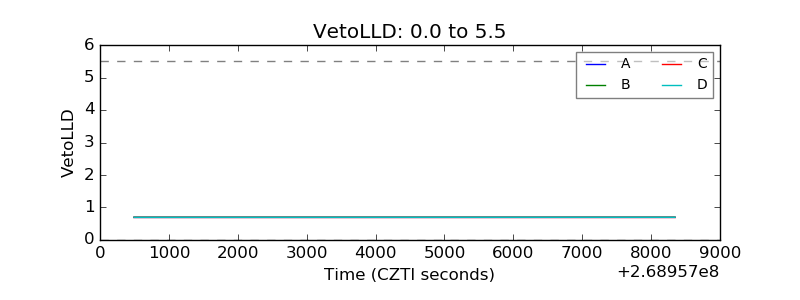 |
| Alpha Counter | 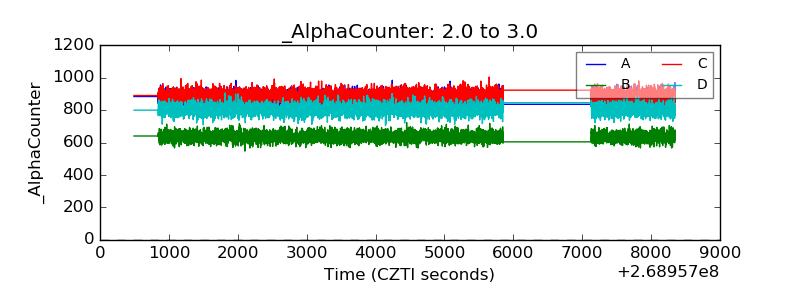 |
| _CPM_Rate | 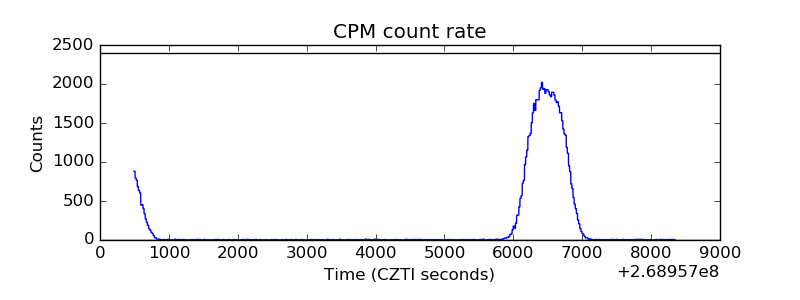 |
| CZT Counter | 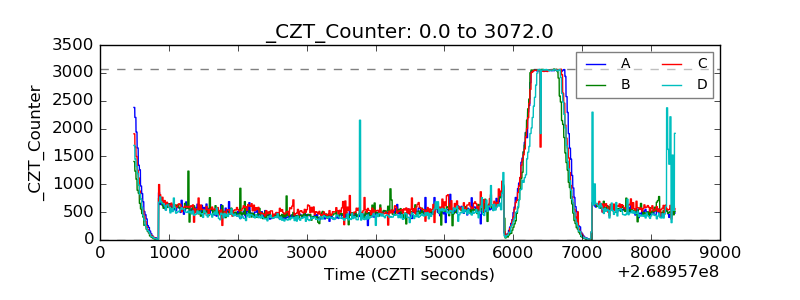 |
| +2.5 Volts monitor |  |
| +5 Volts monitor | 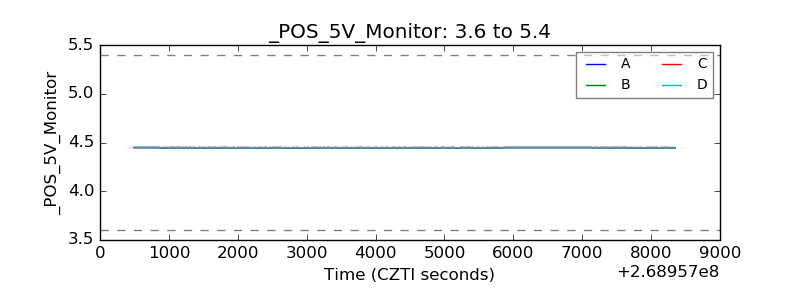 |
| _ROLL_ROT | 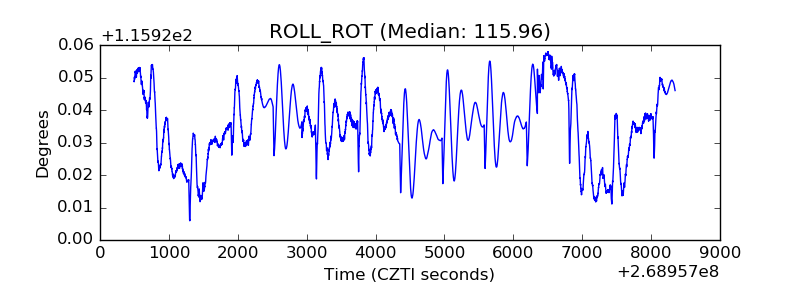 |
| _Roll_DEC | 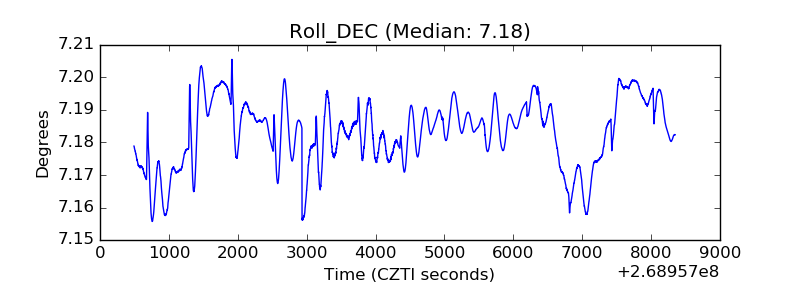 |
| _Roll_RA | 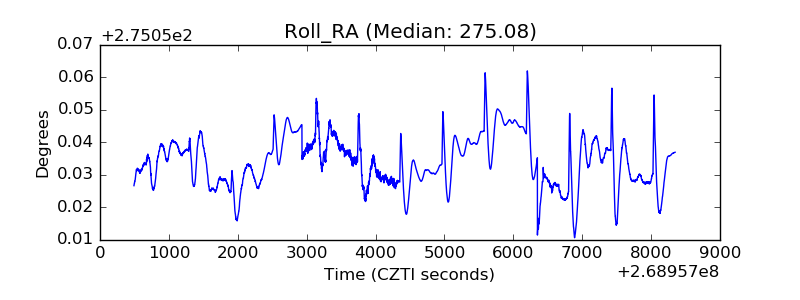 |
| Veto Counter | 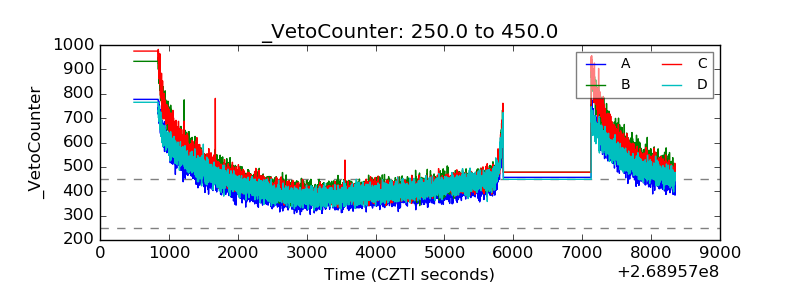 |