| Param | Original file | Final file |
|---|---|---|
| Filename | modeM0/AS1T02_060T01_9000002216_15056cztM0_level2.evt | modeM0/AS1T02_060T01_9000002216_15056cztM0_level2_quad_clean.evt |
| Size (bytes) | 573,373,440 | 84,536,640 |
| Size | 546.8 MB | 80.6 MB |
| Events in quadrant A | 3,751,352 | 516,616 |
| Events in quadrant B | 4,221,611 | 527,674 |
| Events in quadrant C | 4,935,051 | 507,101 |
| Events in quadrant D | 3,950,913 | 489,202 |
| Mode M0 | |||
|---|---|---|---|
| Quadrant | BADHDUFLAG | Total packets | Discarded packets |
| A | 0 | 15759 | 3 |
| B | 0 | 17216 | 2 |
| C | 0 | 19375 | 2 |
| D | 0 | 16710 | 2 |
| Mode M9 | |||
|---|---|---|---|
| Quadrant | BADHDUFLAG | Total packets | Discarded packets |
| A | 0 | 17 | 0 |
| B | 0 | 17 | 0 |
| C | 0 | 17 | 0 |
| D | 0 | 17 | 0 |
| Mode SS | |||
|---|---|---|---|
| Quadrant | BADHDUFLAG | Total packets | Discarded packets |
| A | 0 | 152 | 0 |
| B | 0 | 152 | 0 |
| C | 0 | 152 | 0 |
| D | 0 | 152 | 0 |
| Quadrant | Total seconds | Saturated seconds | Saturation percentage |
|---|---|---|---|
| A | 7464 | 215 | 2.880493% |
| B | 7464 | 282 | 3.778135% |
| C | 7464 | 227 | 3.041265% |
| D | 7464 | 163 | 2.183816% |
Noise dominated data is calculated using 1-second bins in cleaned event files. If a bin has >2000 counts, and if more than 50% of those come from <1% of pixels, then it is considered to be noise-dominated and hence unusable.
| Quadrant | # 1 sec bins | Bins with >0 counts | Bins with >2000 counts | High rate bins dominated by noise | Noise dominated (total time) | Noise dominated (detector-on time) | Marked lightcurve |
|---|---|---|---|---|---|---|---|
| A | 9155 | 7466 | 0 | 0 | 0.00% | 0.00% | 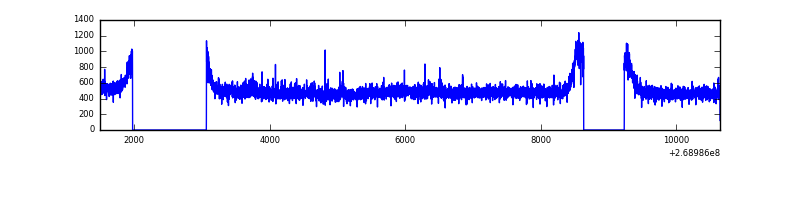 |
| B | 9155 | 7466 | 19 | 19 | 0.21% | 0.25% | 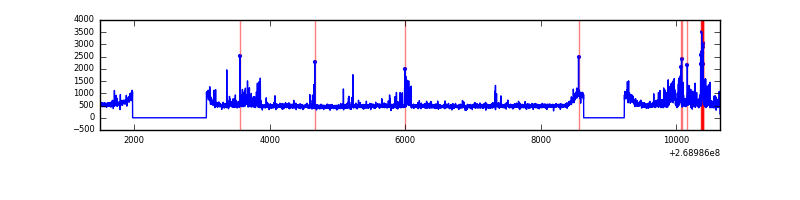 |
| C | 9155 | 7466 | 19 | 19 | 0.21% | 0.25% | 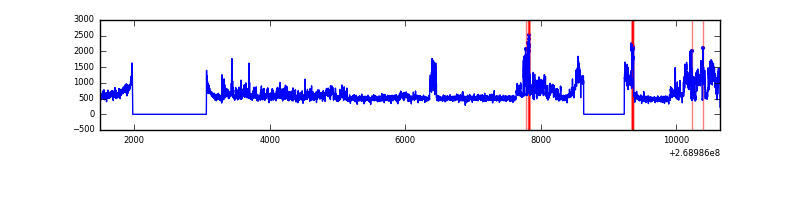 |
| D | 9155 | 7465 | 17 | 17 | 0.19% | 0.23% | 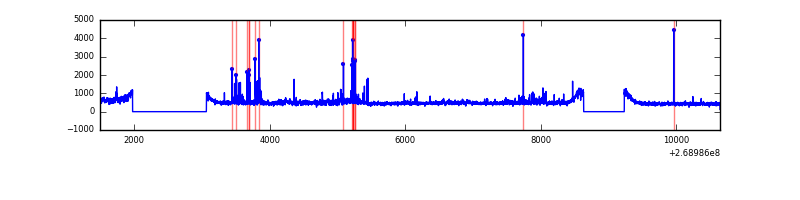 |
Top three noisy pixels from each quadrant. If the there are fewer than three noisy pixels in the level2.evt file, extra rows are filled as -1
| Pixel properties | Quadrant properties | ||||||
|---|---|---|---|---|---|---|---|
| Quadrant | DetID | PixID | Counts | Sigma | Mean | Median | Sigma |
| A | 1 | 162 | 38687 | 195.07 | 953 | 932 | 193.5 |
| A | 1 | 178 | 15131 | 73.36 | 953 | 932 | 193.5 |
| A | 1 | 161 | 13191 | 63.34 | 953 | 932 | 193.5 |
| B | 10 | 245 | 377313 | 2023.42 | 950 | 926 | 186.0 |
| B | 10 | 16 | 87713 | 466.56 | 950 | 926 | 186.0 |
| B | 12 | 111 | 23110 | 119.26 | 950 | 926 | 186.0 |
| C | 3 | 233 | 1350759 | 6234.51 | 919 | 925 | 216.5 |
| C | 13 | 61 | 6463 | 25.58 | 919 | 925 | 216.5 |
| C | 3 | 232 | 2871 | 8.99 | 919 | 925 | 216.5 |
| D | 7 | 223 | 261711 | 1159.72 | 921 | 895 | 224.9 |
| D | 13 | 249 | 133277 | 588.64 | 921 | 895 | 224.9 |
| D | 2 | 136 | 53031 | 231.82 | 921 | 895 | 224.9 |
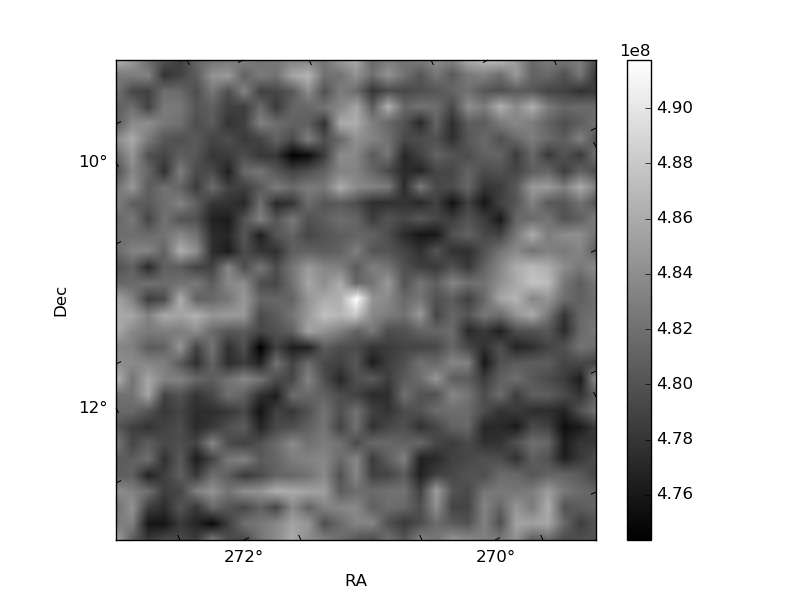
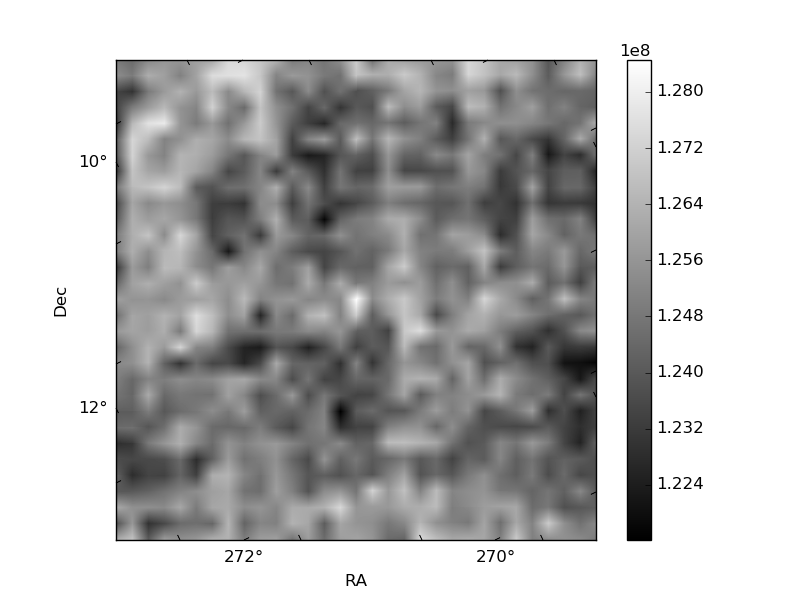
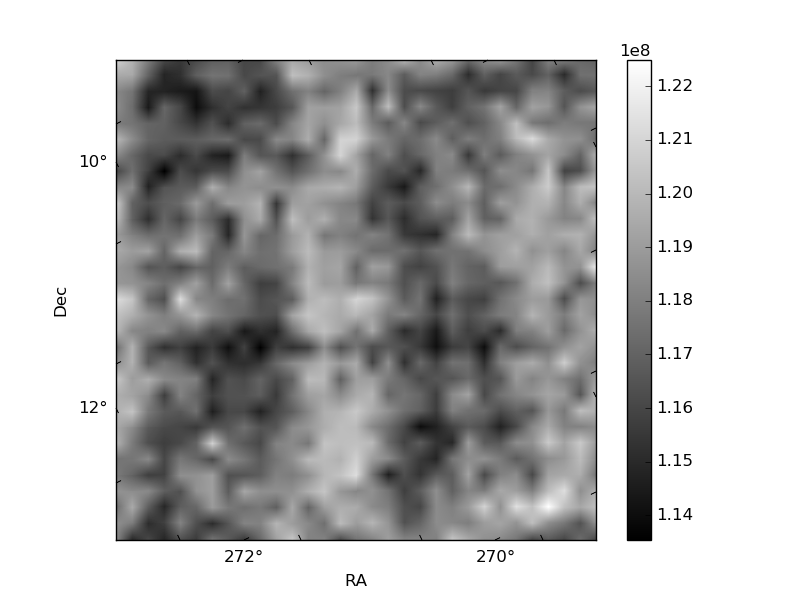
Histogram calculated using DETX and DETY for each event in the final _common_clean file
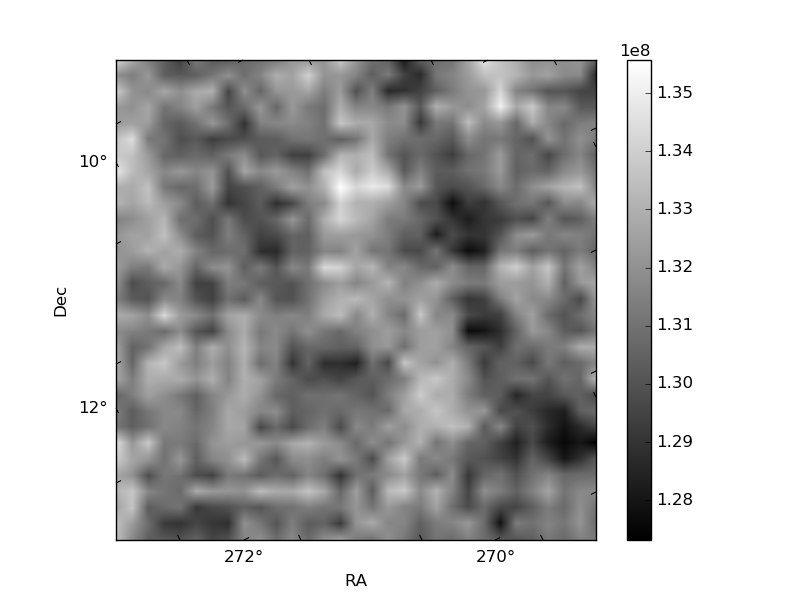
| Quadrant A | 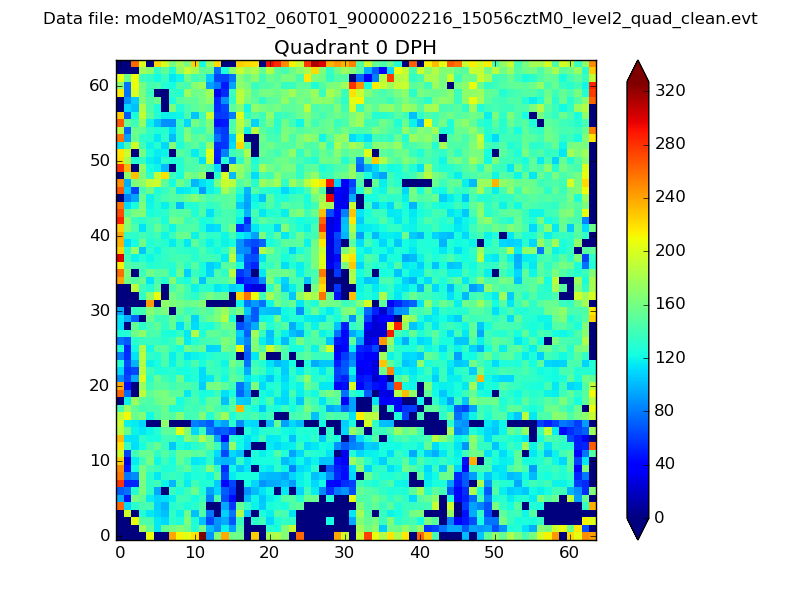 |
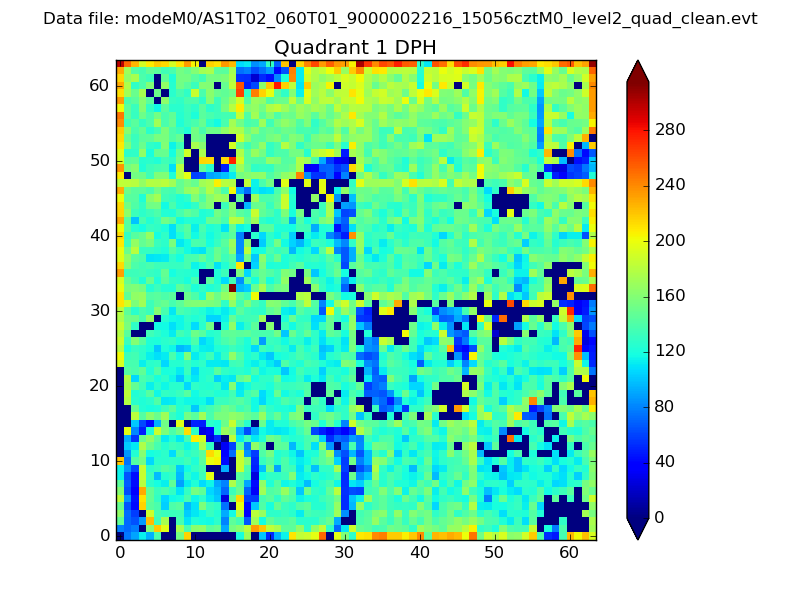 |
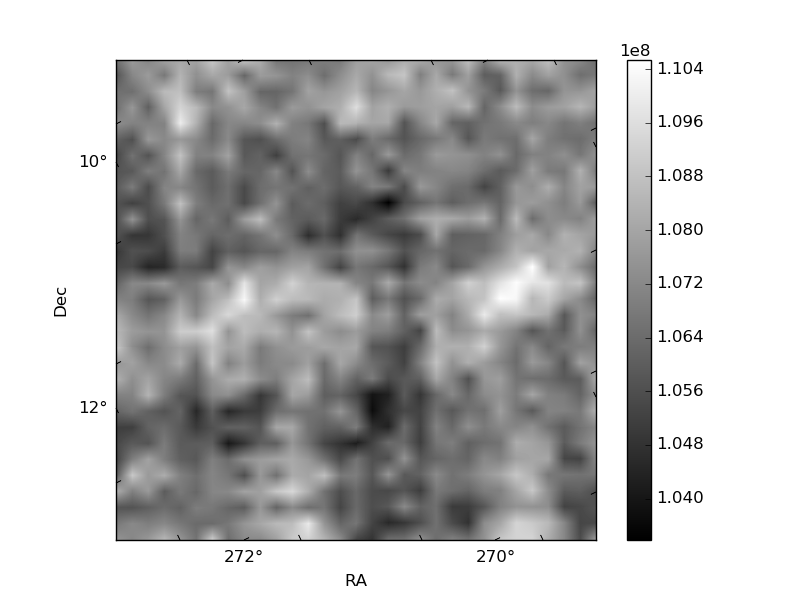
Quadrant B |
|---|---|---|---|
| Quadrant D | 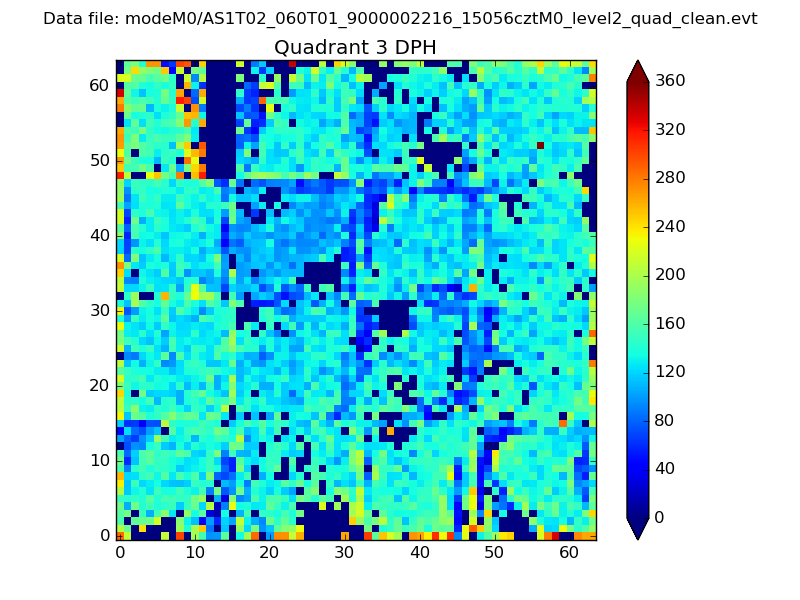 |
 |
Quadrant C |
| Plot type | Count rate plots | Images |
|---|---|---|
| Comparison with Poisson distribution Blue bars denote a histogram of data divided into 1 sec bins. Red curve is a Poisson curve with rate = median count rate of data. |
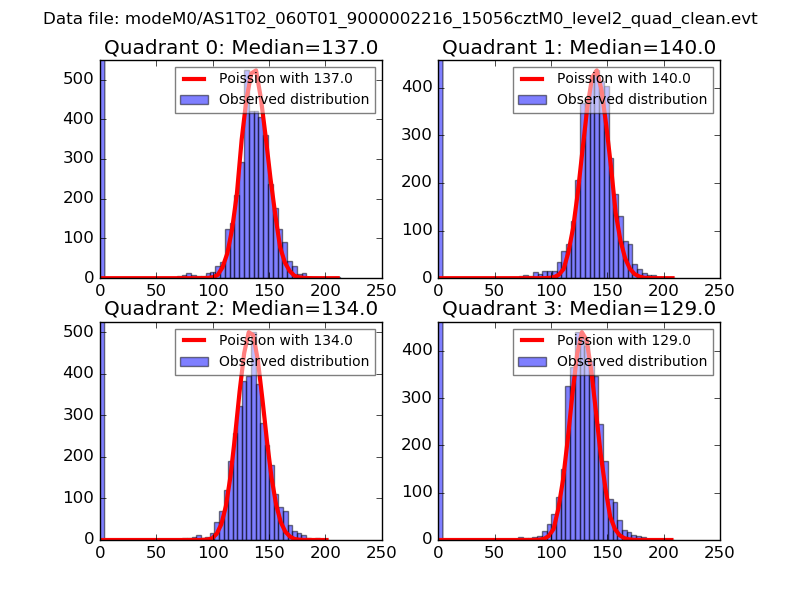 |
 |
| Quadrant-wise count rates Data is divided into 100 sec bins |
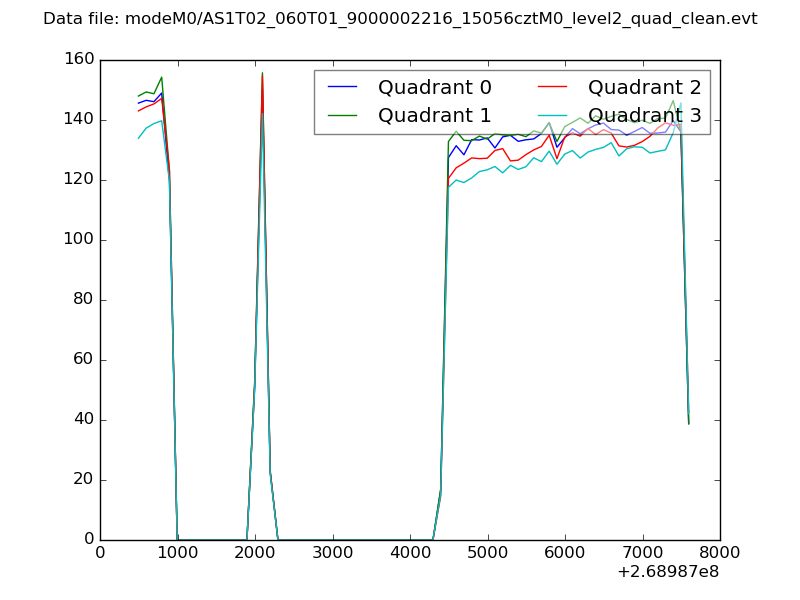 |
|
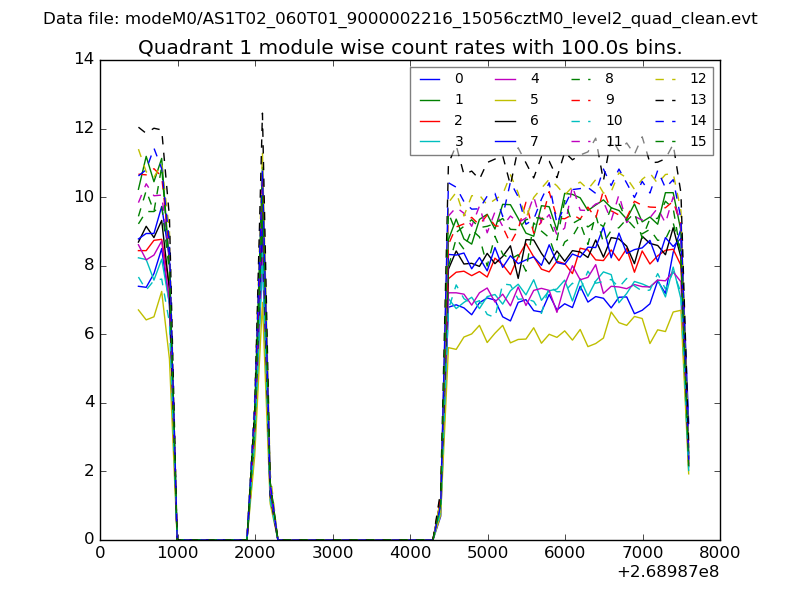
| Module-wise count rates for Quadrant A Data is divided into 100 sec bins |
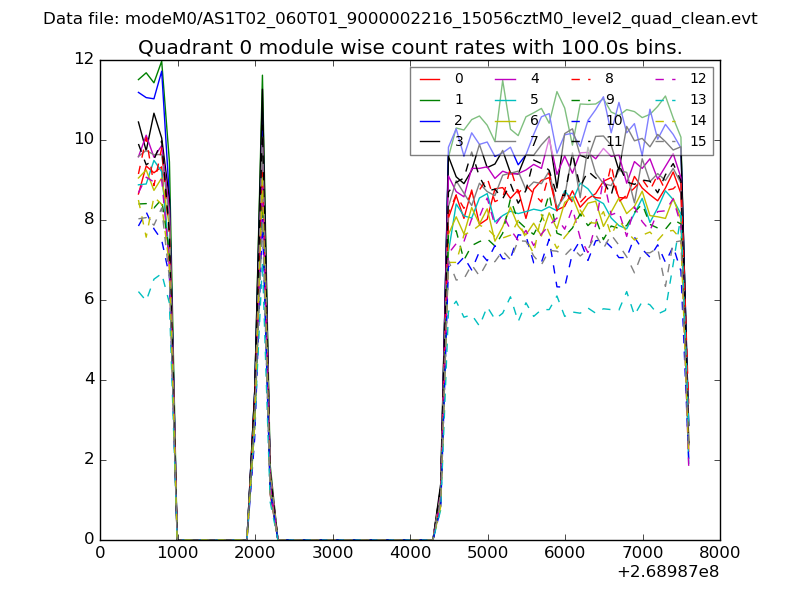 |
 |
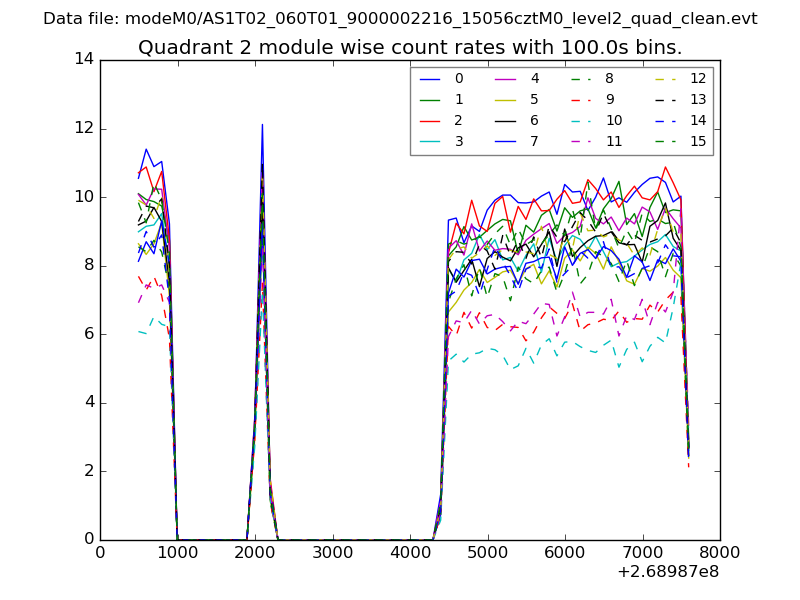
| Module-wise count rates for Quadrant B Data is divided into 100 sec bins |
 |
 |
| Module-wise count rates for Quadrant C Data is divided into 100 sec bins |
 |
 |
| Module-wise count rates for Quadrant D Data is divided into 100 sec bins |
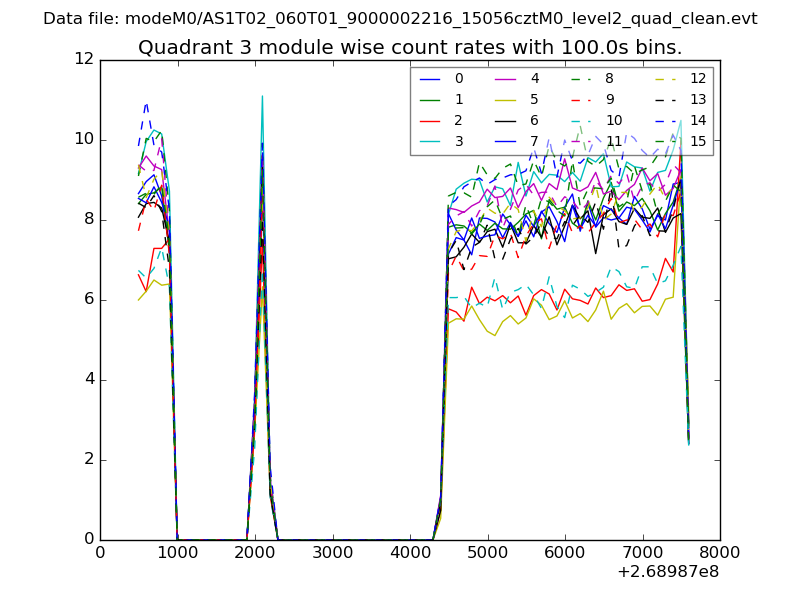 |
 |
| Parameter | Plot |
|---|---|
| CZT HV Monitor | 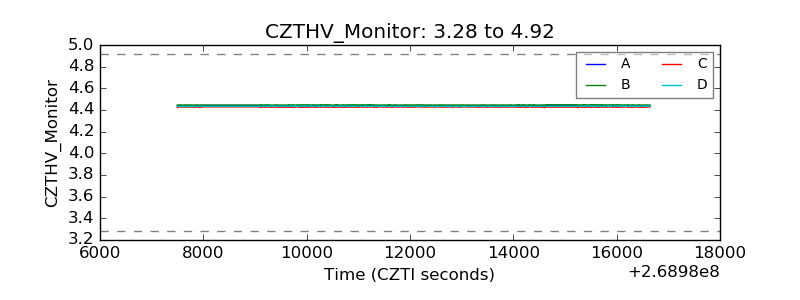 |
| D_VDD | 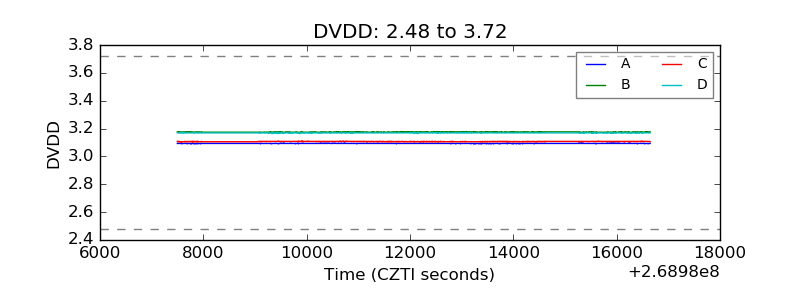 |
| Temperature 1 | 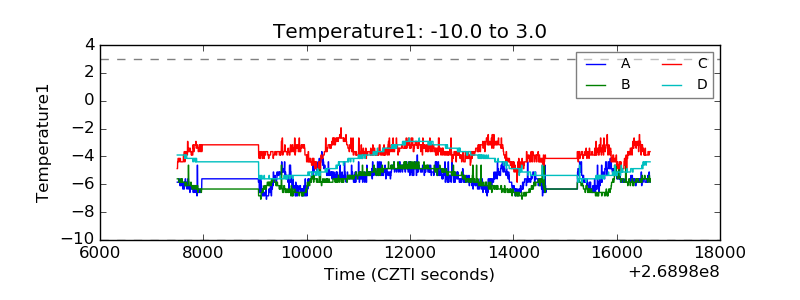 |
| Veto HV Monitor | 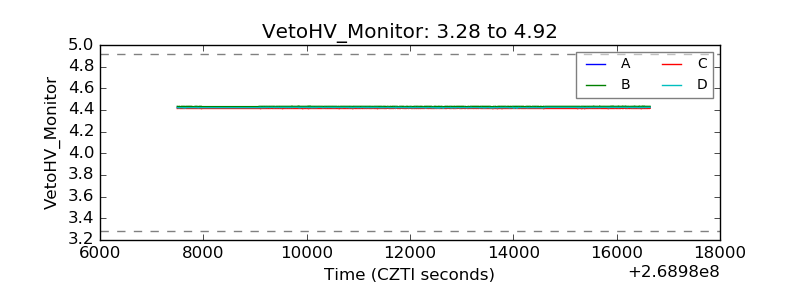 |
| Veto LLD | 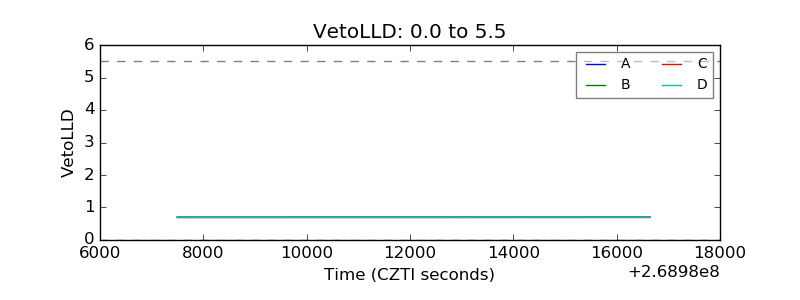 |
| Alpha Counter | 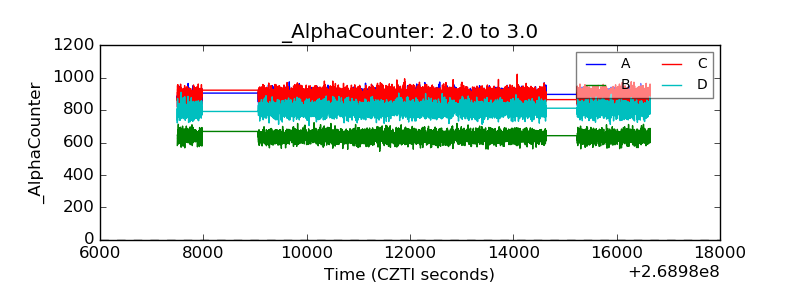 |
| _CPM_Rate | 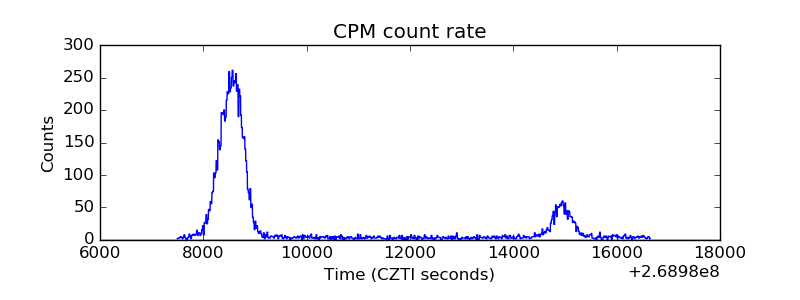 |
| CZT Counter | 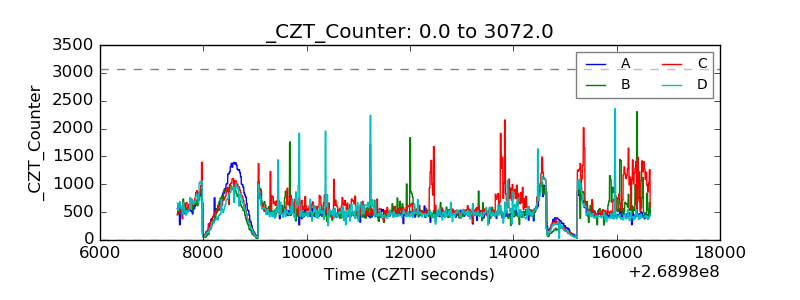 |
| +2.5 Volts monitor |  |
| +5 Volts monitor |  |
| _ROLL_ROT | 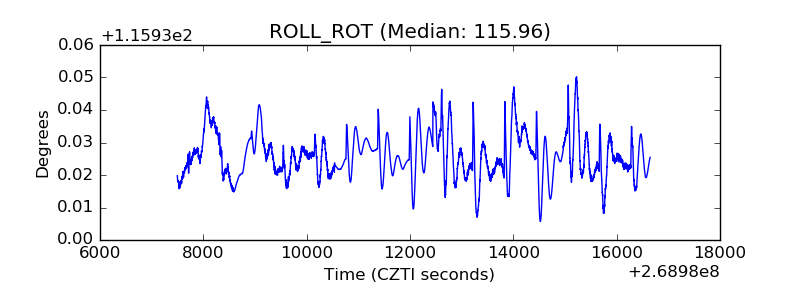 |
| _Roll_DEC | 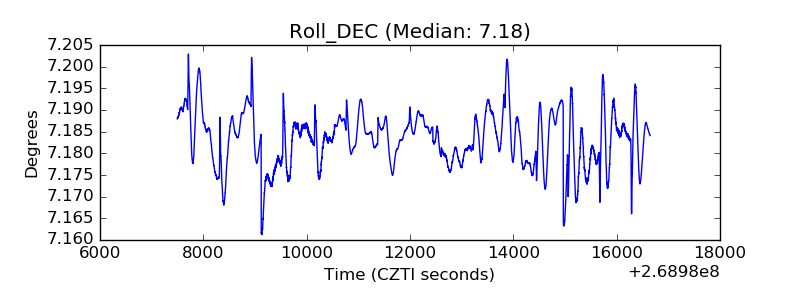 |
| _Roll_RA | 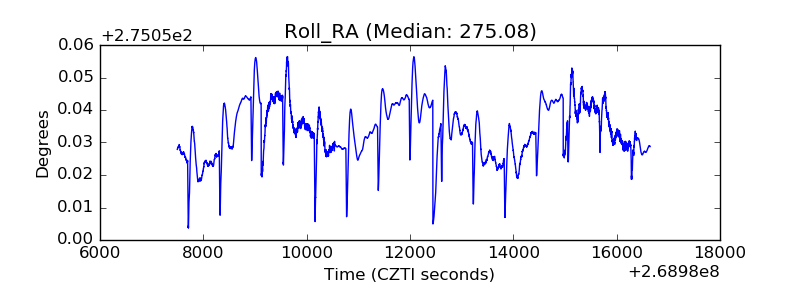 |
| Veto Counter | 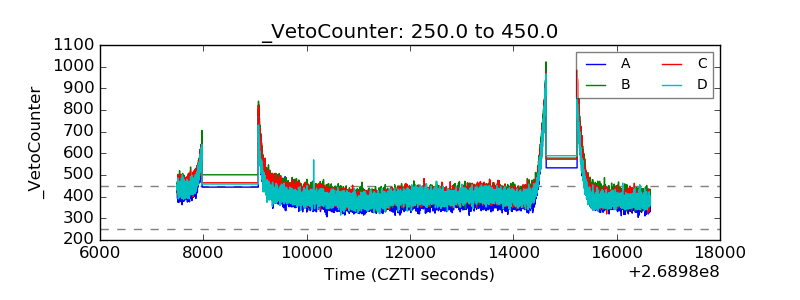 |