| Param | Original file | Final file |
|---|---|---|
| Filename | modeM0/AS1T02_060T01_9000002216_15057cztM0_level2.evt | modeM0/AS1T02_060T01_9000002216_15057cztM0_level2_quad_clean.evt |
| Size (bytes) | 567,696,960 | 77,256,000 |
| Size | 541.4 MB | 73.7 MB |
| Events in quadrant A | 3,689,624 | 464,431 |
| Events in quadrant B | 4,433,886 | 469,709 |
| Events in quadrant C | 5,116,521 | 452,060 |
| Events in quadrant D | 3,454,794 | 441,869 |
| Mode M0 | |||
|---|---|---|---|
| Quadrant | BADHDUFLAG | Total packets | Discarded packets |
| A | 0 | 15516 | 4 |
| B | 0 | 17758 | 3 |
| C | 0 | 19720 | 3 |
| D | 0 | 15490 | 3 |
| Mode M9 | |||
|---|---|---|---|
| Quadrant | BADHDUFLAG | Total packets | Discarded packets |
| A | 0 | 3 | 0 |
| B | 0 | 3 | 0 |
| C | 0 | 3 | 0 |
| D | 0 | 4 | 0 |
| Mode SS | |||
|---|---|---|---|
| Quadrant | BADHDUFLAG | Total packets | Discarded packets |
| A | 0 | 152 | 0 |
| B | 0 | 152 | 0 |
| C | 0 | 152 | 0 |
| D | 0 | 152 | 0 |
| Quadrant | Total seconds | Saturated seconds | Saturation percentage |
|---|---|---|---|
| A | 7340 | 226 | 3.079019% |
| B | 7340 | 312 | 4.250681% |
| C | 7340 | 232 | 3.160763% |
| D | 7340 | 181 | 2.465940% |
Noise dominated data is calculated using 1-second bins in cleaned event files. If a bin has >2000 counts, and if more than 50% of those come from <1% of pixels, then it is considered to be noise-dominated and hence unusable.
| Quadrant | # 1 sec bins | Bins with >0 counts | Bins with >2000 counts | High rate bins dominated by noise | Noise dominated (total time) | Noise dominated (detector-on time) | Marked lightcurve |
|---|---|---|---|---|---|---|---|
| A | 7621 | 7341 | 0 | 0 | 0.00% | 0.00% | 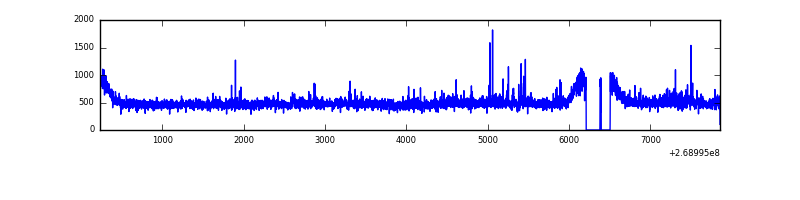 |
| B | 7621 | 7341 | 37 | 37 | 0.49% | 0.50% | 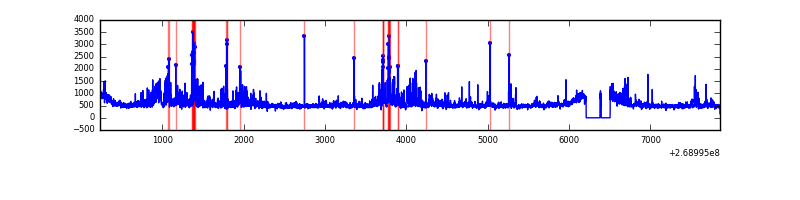 |
| C | 7621 | 7342 | 17 | 17 | 0.22% | 0.23% | 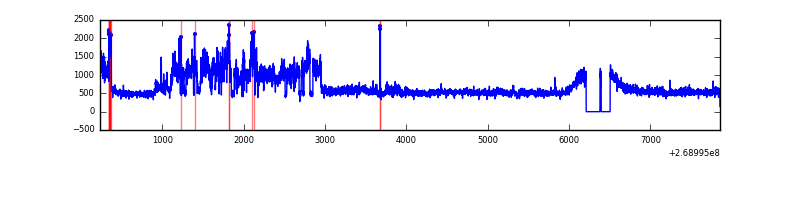 |
| D | 7621 | 7341 | 9 | 9 | 0.12% | 0.12% | 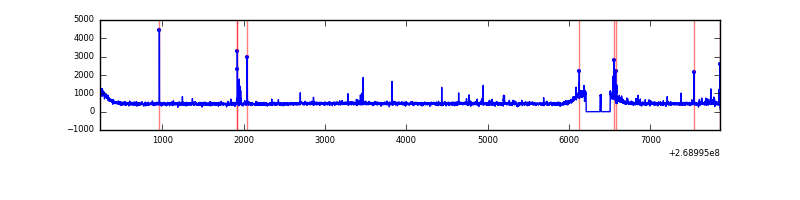 |
Top three noisy pixels from each quadrant. If the there are fewer than three noisy pixels in the level2.evt file, extra rows are filled as -1
| Pixel properties | Quadrant properties | ||||||
|---|---|---|---|---|---|---|---|
| Quadrant | DetID | PixID | Counts | Sigma | Mean | Median | Sigma |
| A | 1 | 162 | 67072 | 355.17 | 915 | 893 | 186.3 |
| A | 12 | 189 | 38975 | 204.38 | 915 | 893 | 186.3 |
| A | 1 | 178 | 27013 | 140.18 | 915 | 893 | 186.3 |
| B | 10 | 245 | 734424 | 4141.22 | 906 | 883 | 177.1 |
| B | 10 | 16 | 99195 | 555.02 | 906 | 883 | 177.1 |
| B | 4 | 173 | 40551 | 223.95 | 906 | 883 | 177.1 |
| C | 3 | 233 | 1681252 | 8116.25 | 880 | 882 | 207.0 |
| C | 13 | 61 | 6259 | 25.97 | 880 | 882 | 207.0 |
| C | 3 | 232 | 4142 | 15.75 | 880 | 882 | 207.0 |
| D | 13 | 249 | 49518 | 224.92 | 884 | 857 | 216.3 |
| D | 13 | 104 | 32759 | 147.46 | 884 | 857 | 216.3 |
| D | 2 | 234 | 23731 | 105.73 | 884 | 857 | 216.3 |
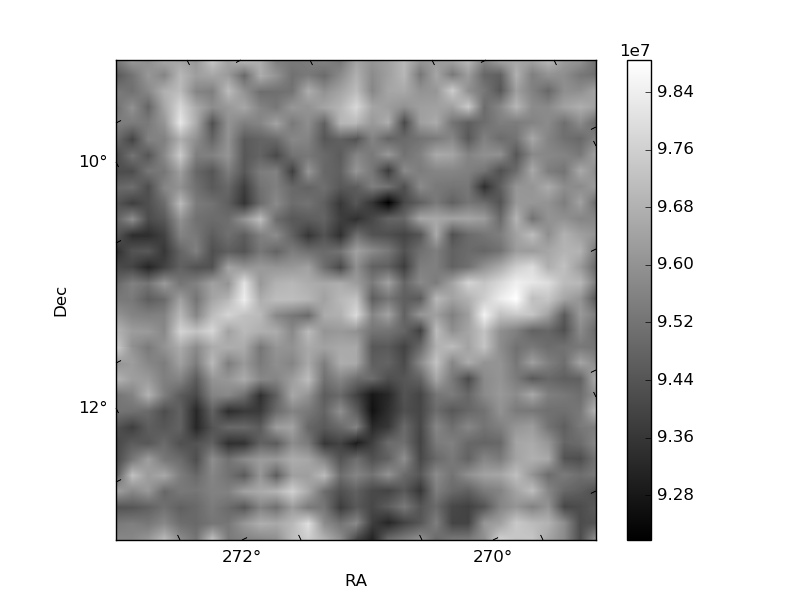
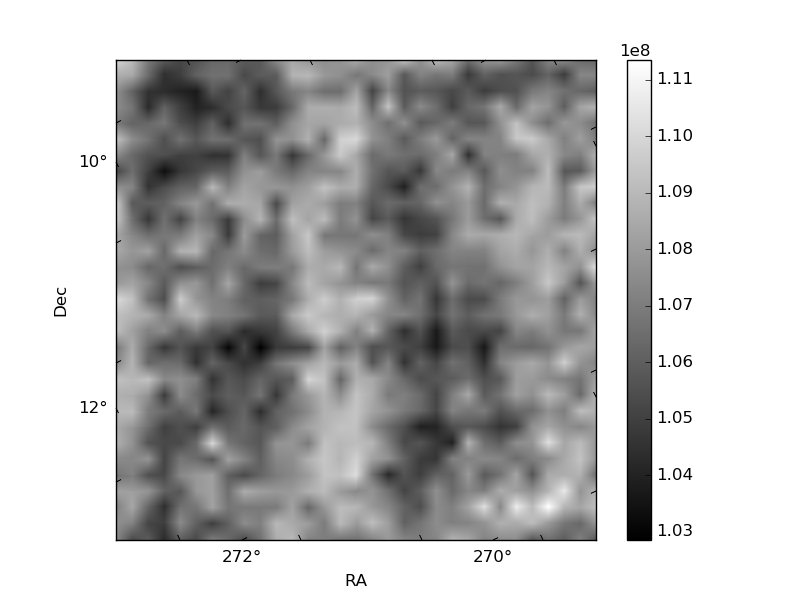
Histogram calculated using DETX and DETY for each event in the final _common_clean file
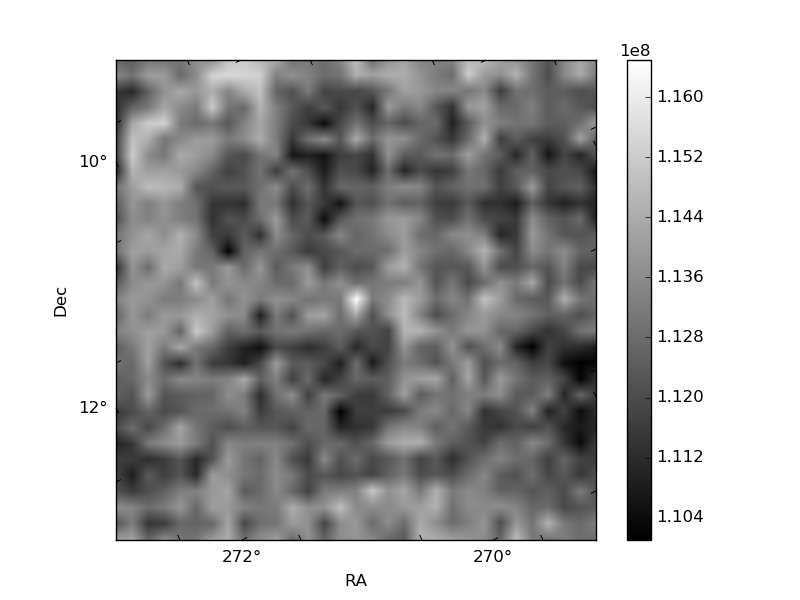
| Quadrant A | 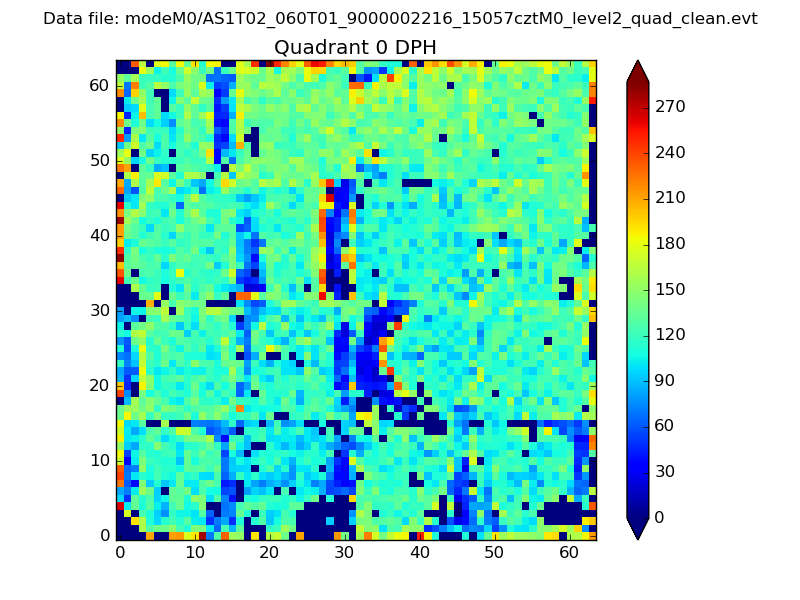 |
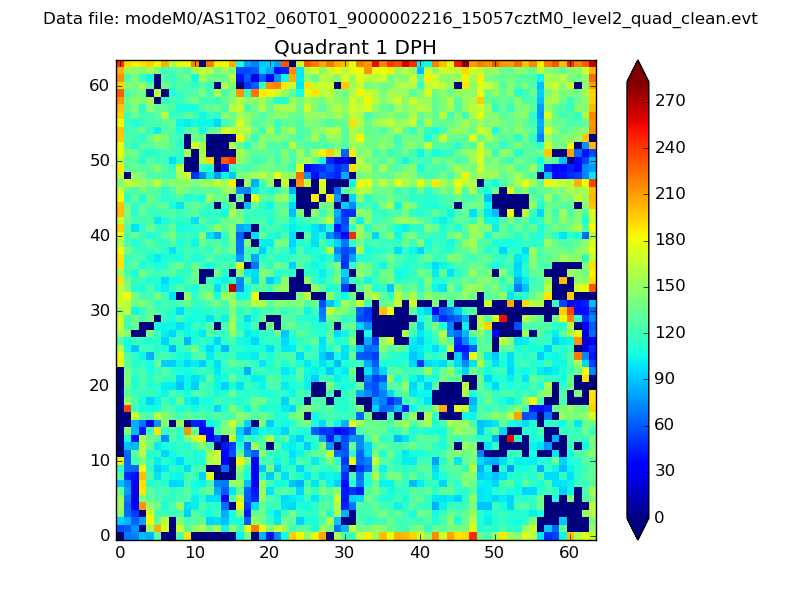 |
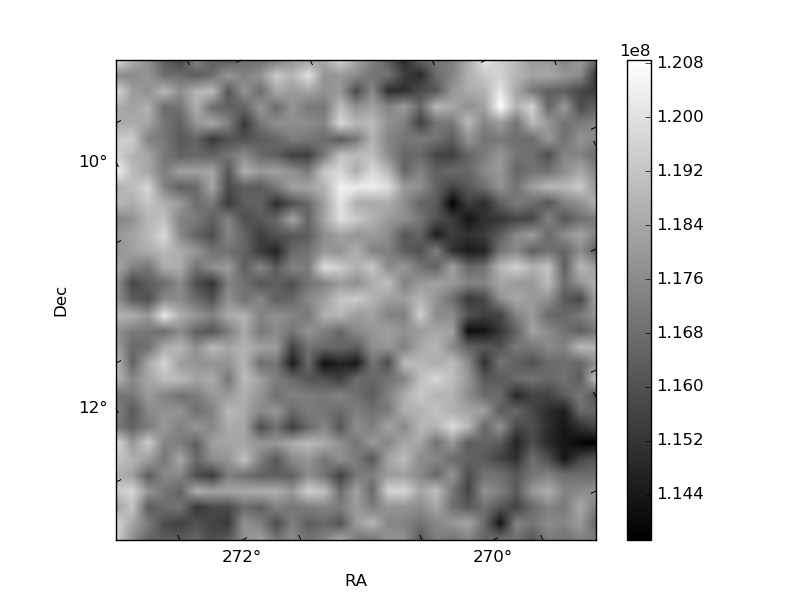
Quadrant B |
|---|---|---|---|
| Quadrant D |  |
 |
Quadrant C |
| Plot type | Count rate plots | Images |
|---|---|---|
| Comparison with Poisson distribution Blue bars denote a histogram of data divided into 1 sec bins. Red curve is a Poisson curve with rate = median count rate of data. |
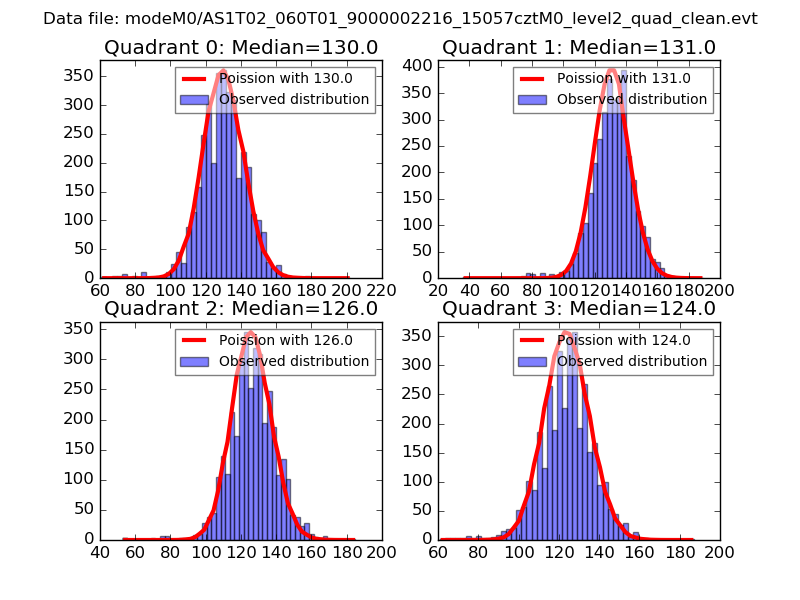 |
 |
| Quadrant-wise count rates Data is divided into 100 sec bins |
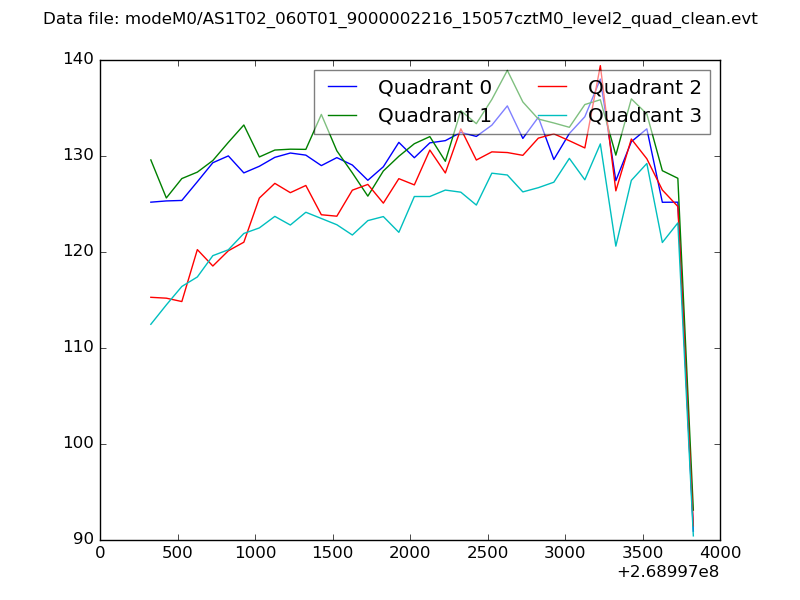 |
|
| Module-wise count rates for Quadrant A Data is divided into 100 sec bins |
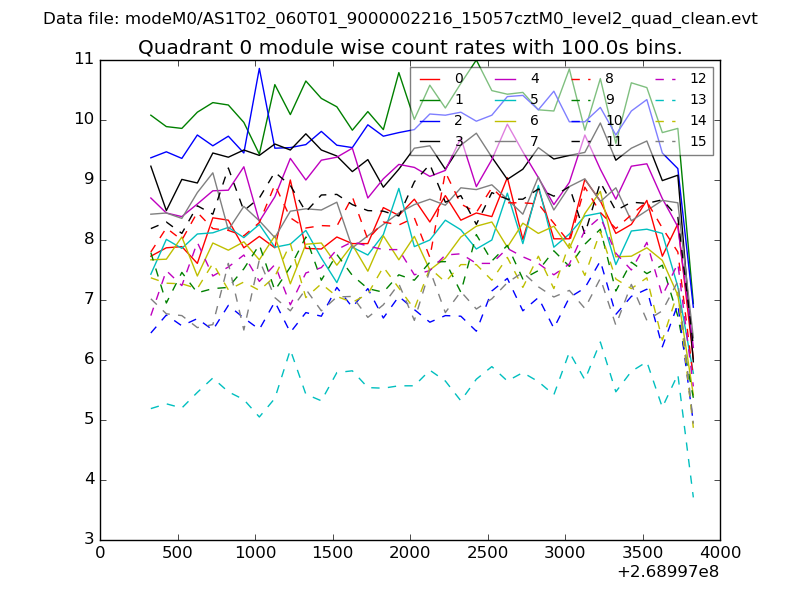 |
 |
| Module-wise count rates for Quadrant B Data is divided into 100 sec bins |
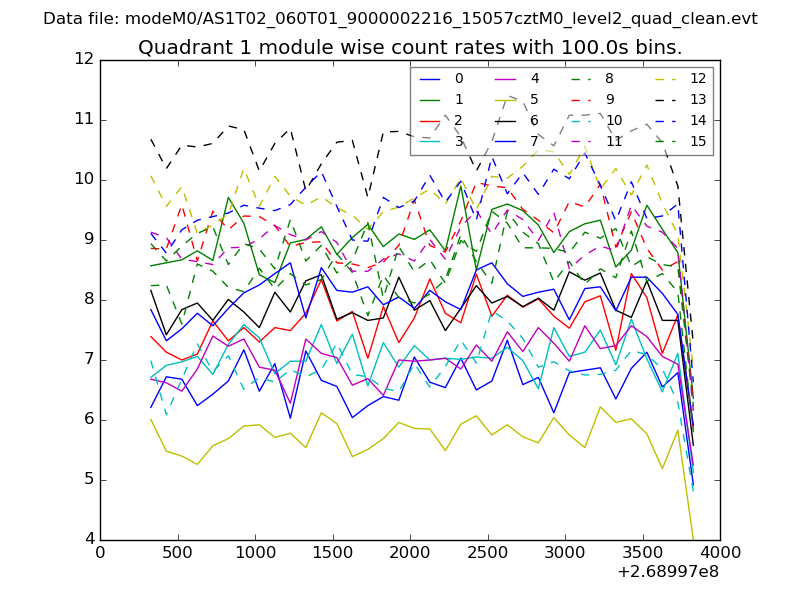 |
 |
| Module-wise count rates for Quadrant C Data is divided into 100 sec bins |
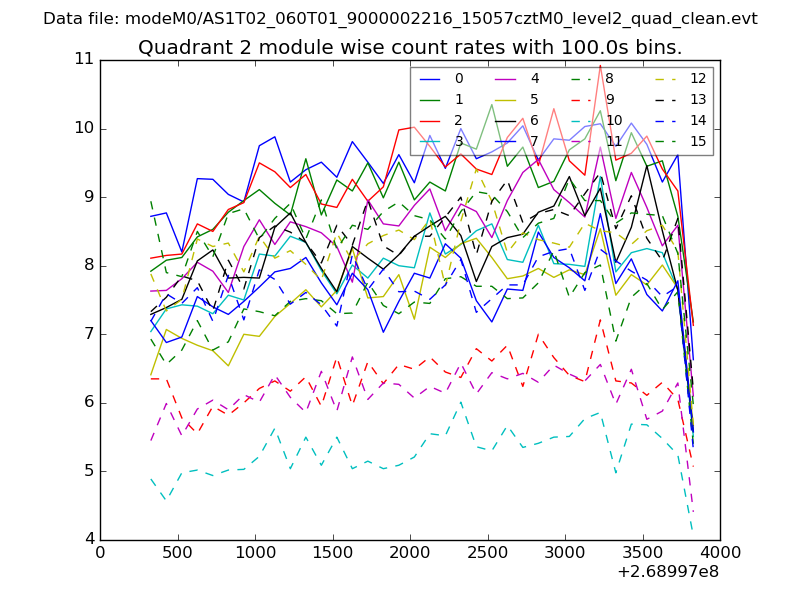 |
 |
| Module-wise count rates for Quadrant D Data is divided into 100 sec bins |
 |
 |
| Parameter | Plot |
|---|---|
| CZT HV Monitor | 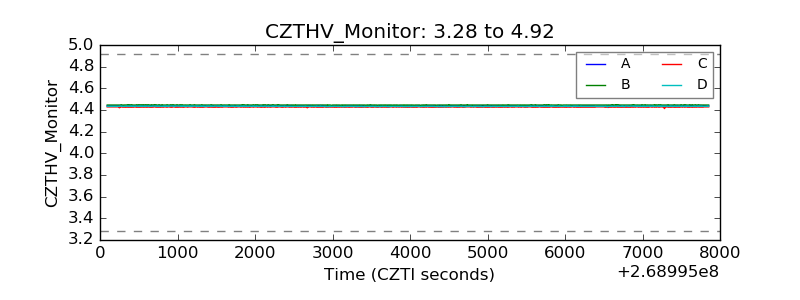 |
| D_VDD | 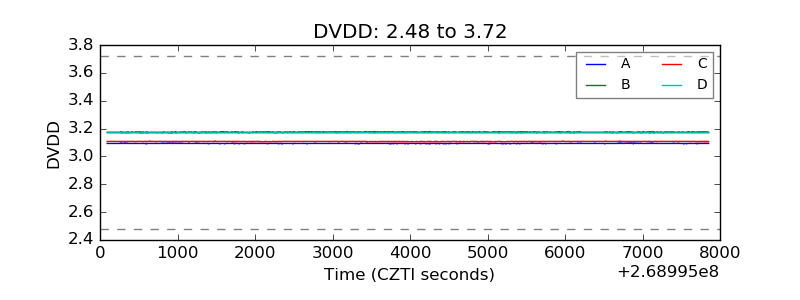 |
| Temperature 1 | 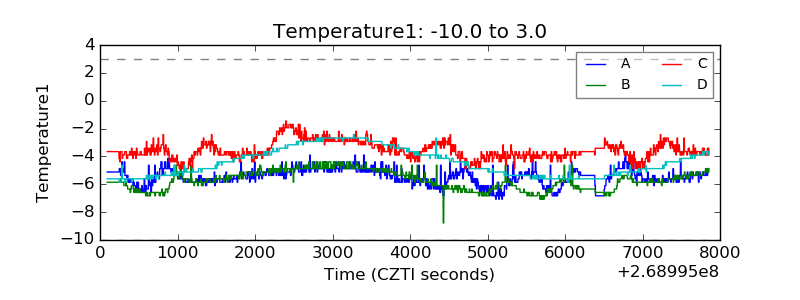 |
| Veto HV Monitor | 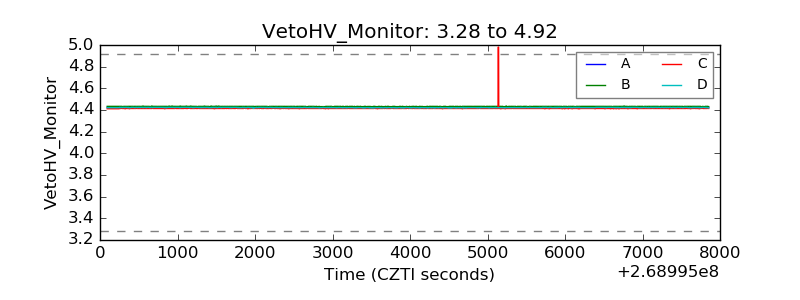 |
| Veto LLD | 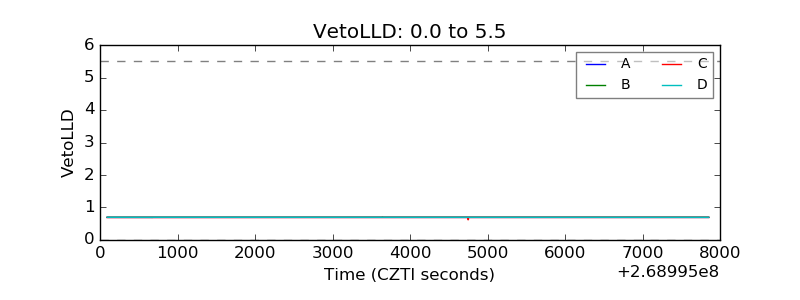 |
| Alpha Counter | 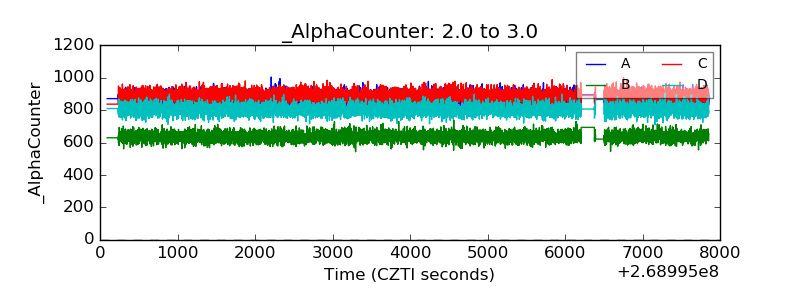 |
| _CPM_Rate | 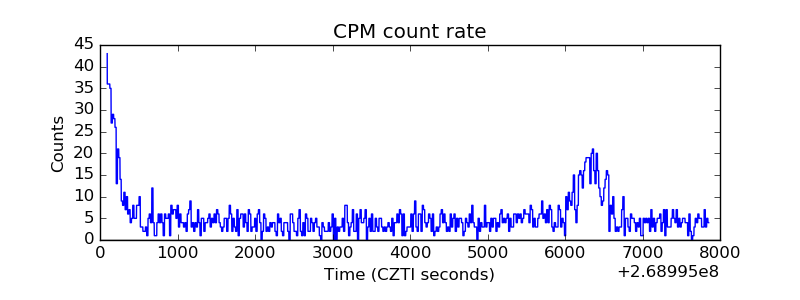 |
| CZT Counter |  |
| +2.5 Volts monitor |  |
| +5 Volts monitor | 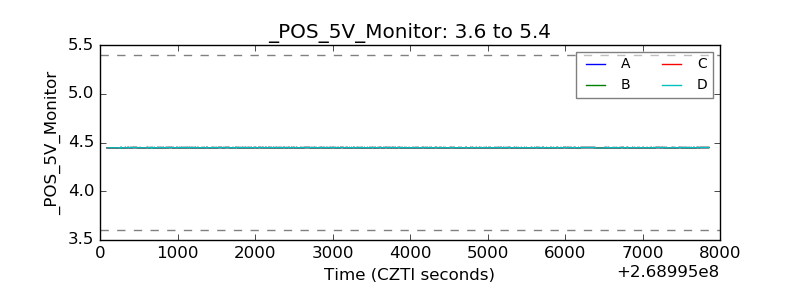 |
| _ROLL_ROT | 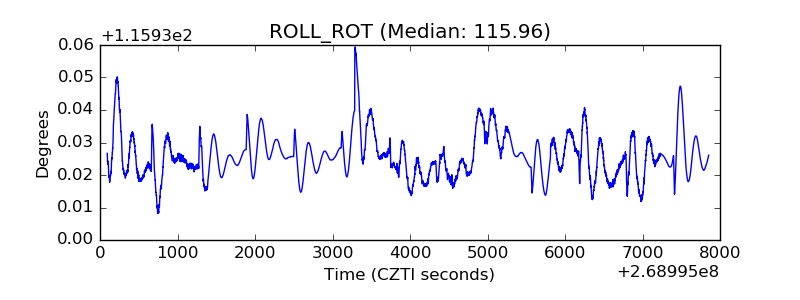 |
| _Roll_DEC | 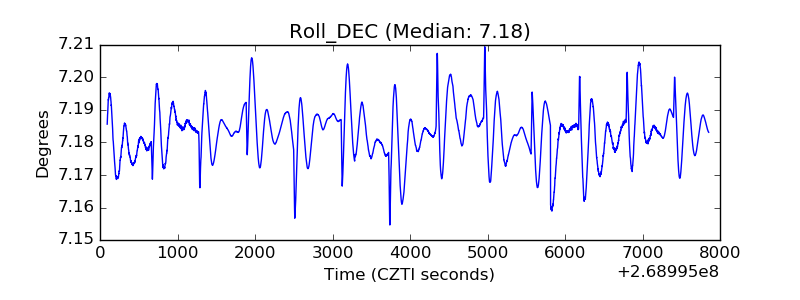 |
| _Roll_RA | 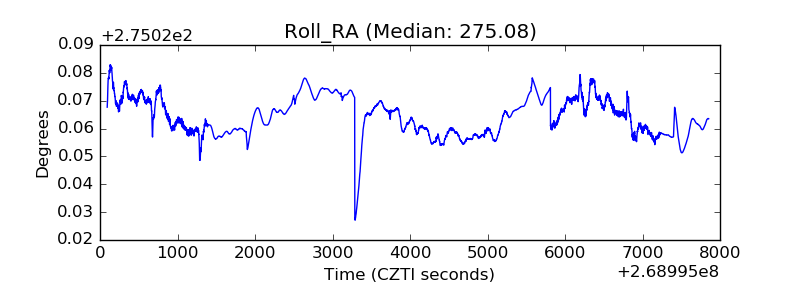 |
| Veto Counter | 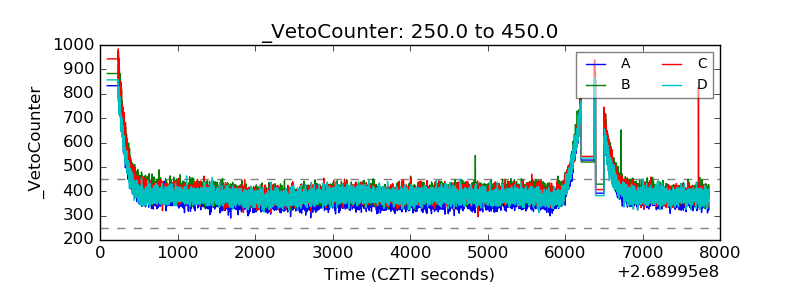 |