| Param | Original file | Final file |
|---|---|---|
| Filename | modeM0/AS1T02_060T01_9000002216_15058cztM0_level2.evt | modeM0/AS1T02_060T01_9000002216_15058cztM0_level2_quad_clean.evt |
| Size (bytes) | 604,751,040 | 88,606,080 |
| Size | 576.7 MB | 84.5 MB |
| Events in quadrant A | 4,211,532 | 537,306 |
| Events in quadrant B | 5,048,387 | 537,062 |
| Events in quadrant C | 4,472,720 | 527,190 |
| Events in quadrant D | 4,022,071 | 507,933 |
| Mode M0 | |||
|---|---|---|---|
| Quadrant | BADHDUFLAG | Total packets | Discarded packets |
| A | 0 | 17563 | 4 |
| B | 0 | 20236 | 3 |
| C | 0 | 18075 | 3 |
| D | 0 | 17626 | 3 |
| Mode M9 | |||
|---|---|---|---|
| Quadrant | BADHDUFLAG | Total packets | Discarded packets |
| A | 0 | 5 | 0 |
| B | 0 | 5 | 0 |
| C | 0 | 5 | 0 |
| D | 0 | 5 | 0 |
| Mode SS | |||
|---|---|---|---|
| Quadrant | BADHDUFLAG | Total packets | Discarded packets |
| A | 0 | 174 | 0 |
| B | 0 | 174 | 0 |
| C | 0 | 174 | 0 |
| D | 0 | 174 | 0 |
| Quadrant | Total seconds | Saturated seconds | Saturation percentage |
|---|---|---|---|
| A | 8253 | 299 | 3.622925% |
| B | 8253 | 467 | 5.658548% |
| C | 8253 | 237 | 2.871683% |
| D | 8253 | 243 | 2.944384% |
Noise dominated data is calculated using 1-second bins in cleaned event files. If a bin has >2000 counts, and if more than 50% of those come from <1% of pixels, then it is considered to be noise-dominated and hence unusable.
| Quadrant | # 1 sec bins | Bins with >0 counts | Bins with >2000 counts | High rate bins dominated by noise | Noise dominated (total time) | Noise dominated (detector-on time) | Marked lightcurve |
|---|---|---|---|---|---|---|---|
| A | 8764 | 8254 | 1 | 1 | 0.01% | 0.01% | 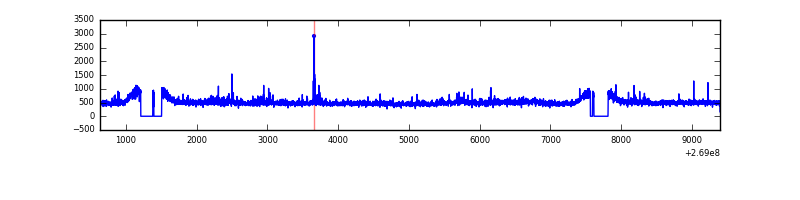 |
| B | 8764 | 8254 | 109 | 109 | 1.24% | 1.32% | 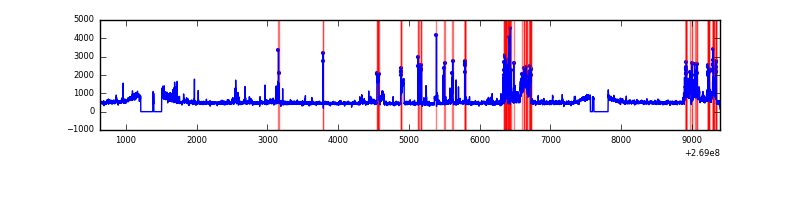 |
| C | 8764 | 8255 | 0 | 0 | 0.00% | 0.00% | 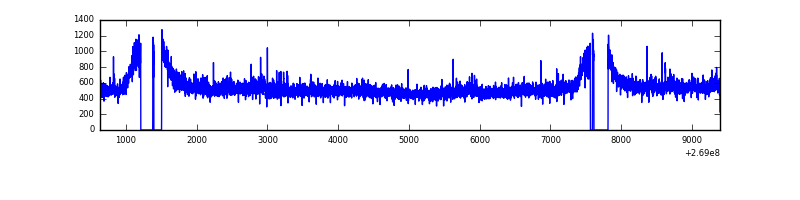 |
| D | 8764 | 8254 | 25 | 25 | 0.29% | 0.30% | 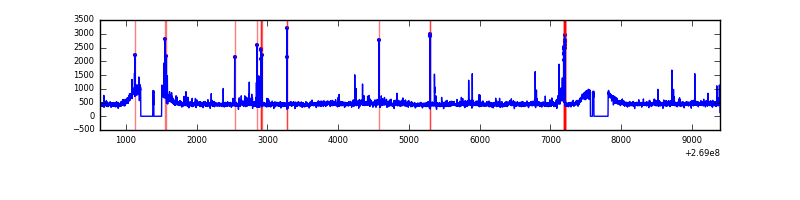 |
Top three noisy pixels from each quadrant. If the there are fewer than three noisy pixels in the level2.evt file, extra rows are filled as -1
| Pixel properties | Quadrant properties | ||||||
|---|---|---|---|---|---|---|---|
| Quadrant | DetID | PixID | Counts | Sigma | Mean | Median | Sigma |
| A | 1 | 162 | 103013 | 484.09 | 1030 | 1007 | 210.7 |
| A | 1 | 178 | 40273 | 186.35 | 1030 | 1007 | 210.7 |
| A | 15 | 239 | 39378 | 182.1 | 1030 | 1007 | 210.7 |
| B | 3 | 64 | 497798 | 2503.49 | 1019 | 992 | 198.4 |
| B | 10 | 245 | 412990 | 2076.13 | 1019 | 992 | 198.4 |
| B | 10 | 16 | 76525 | 380.62 | 1019 | 992 | 198.4 |
| C | 3 | 233 | 582948 | 2479.51 | 997 | 1000 | 234.7 |
| C | 13 | 61 | 7154 | 26.22 | 997 | 1000 | 234.7 |
| C | 8 | 222 | 3135 | 9.1 | 997 | 1000 | 234.7 |
| D | 13 | 249 | 76318 | 304.24 | 998 | 966 | 247.7 |
| D | 13 | 104 | 75111 | 299.36 | 998 | 966 | 247.7 |
| D | 2 | 152 | 56988 | 226.19 | 998 | 966 | 247.7 |
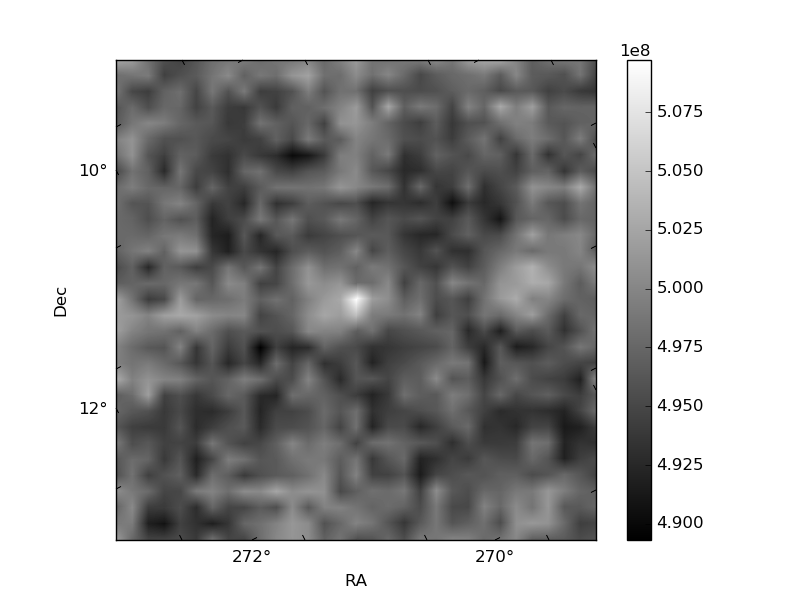
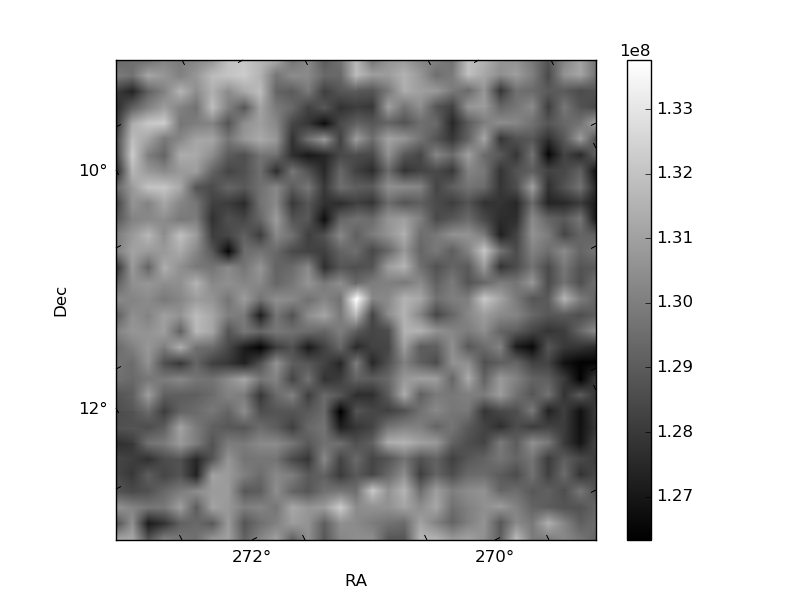
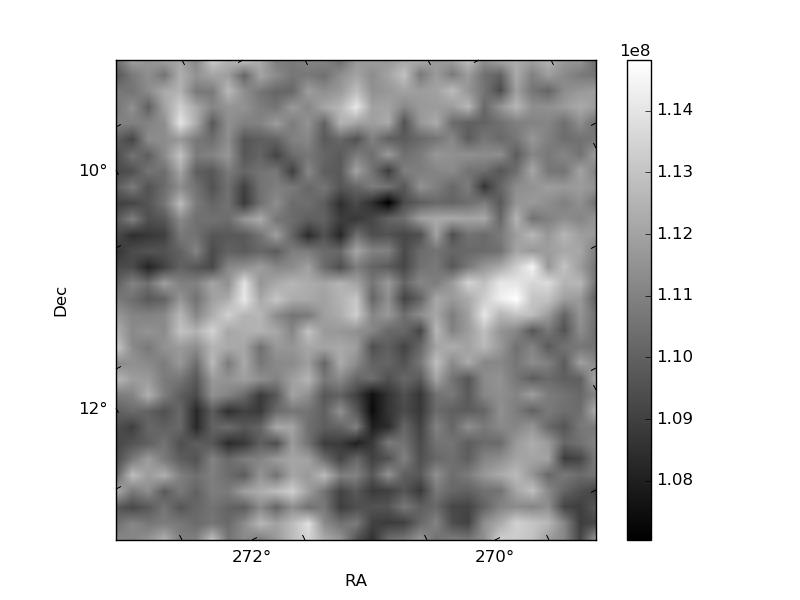
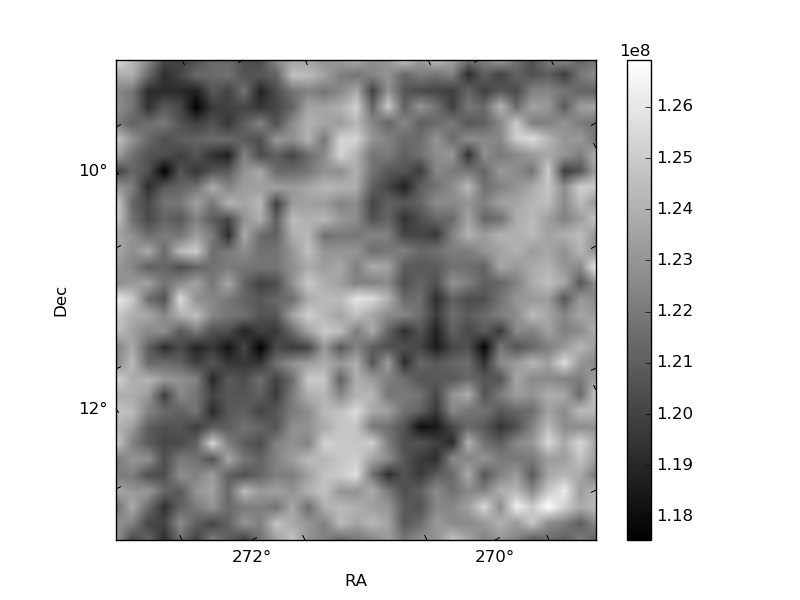
Histogram calculated using DETX and DETY for each event in the final _common_clean file
| Quadrant A | 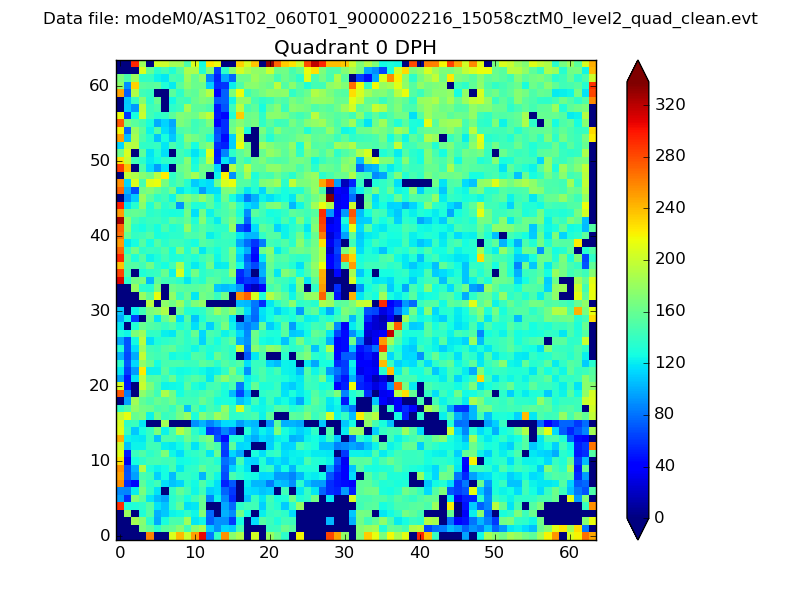 |
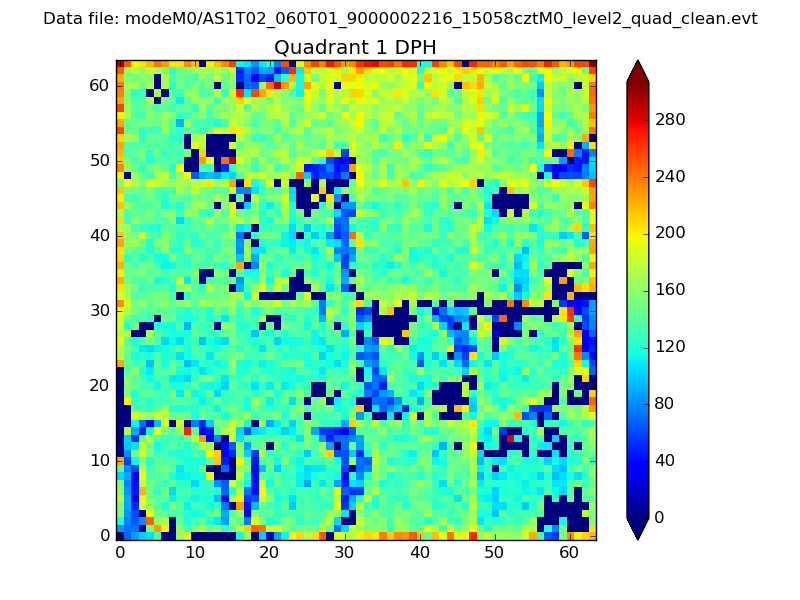 |
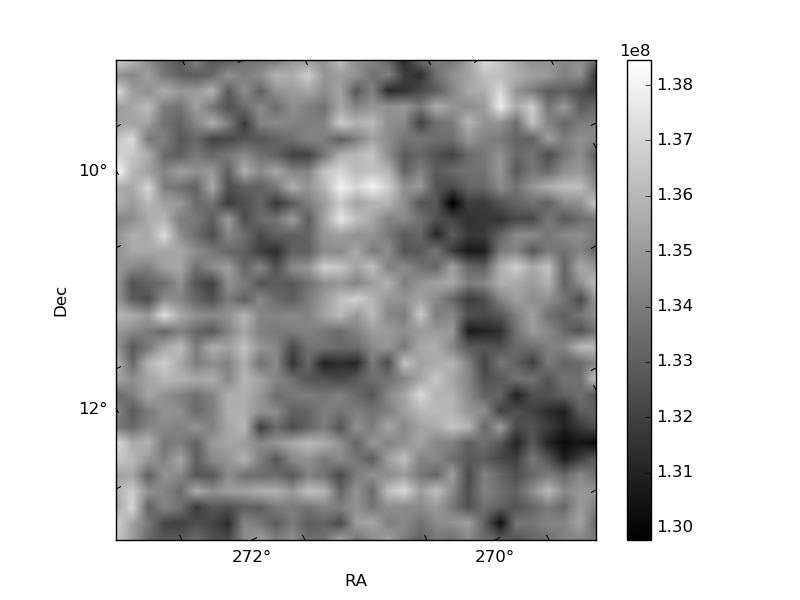
Quadrant B |
|---|---|---|---|
| Quadrant D | 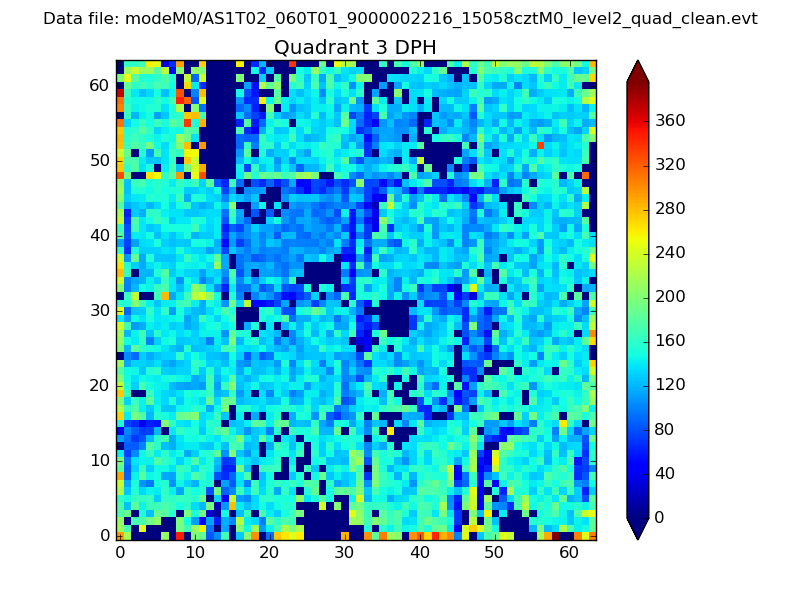 |
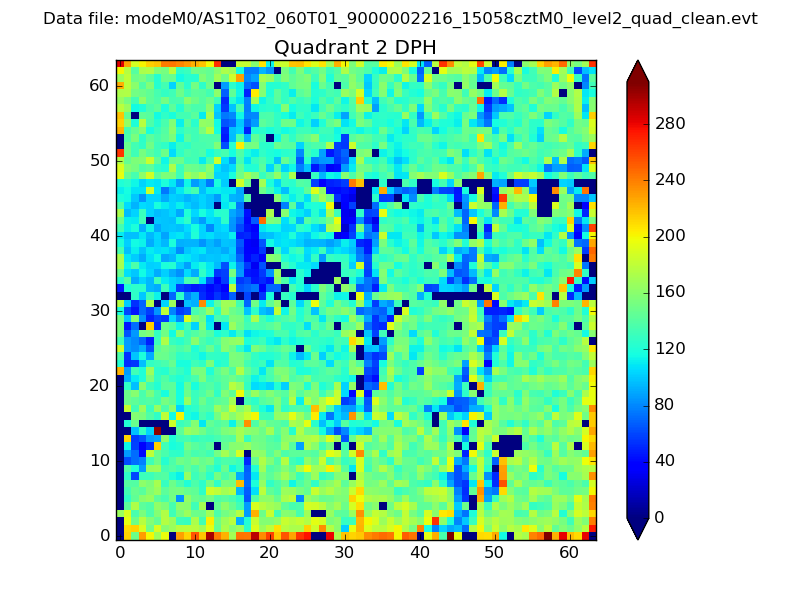 |
Quadrant C |
| Plot type | Count rate plots | Images |
|---|---|---|
| Comparison with Poisson distribution Blue bars denote a histogram of data divided into 1 sec bins. Red curve is a Poisson curve with rate = median count rate of data. |
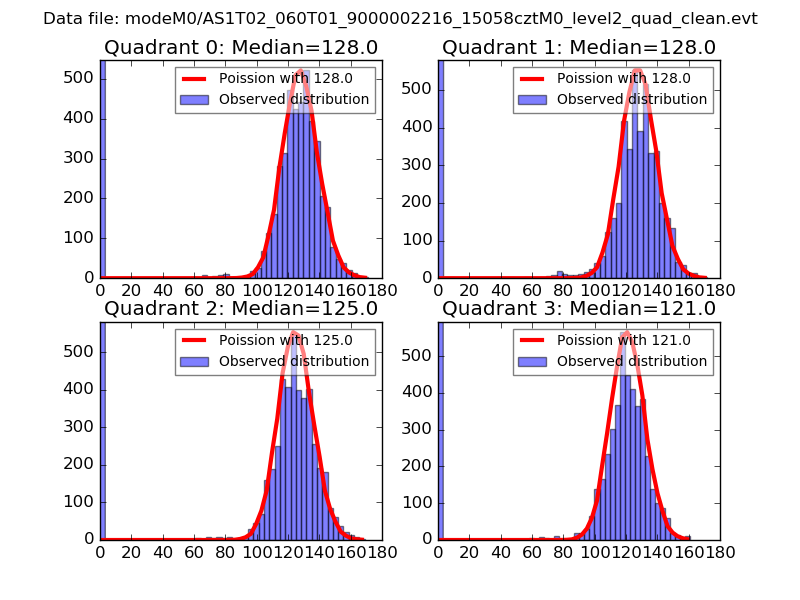 |
 |
| Quadrant-wise count rates Data is divided into 100 sec bins |
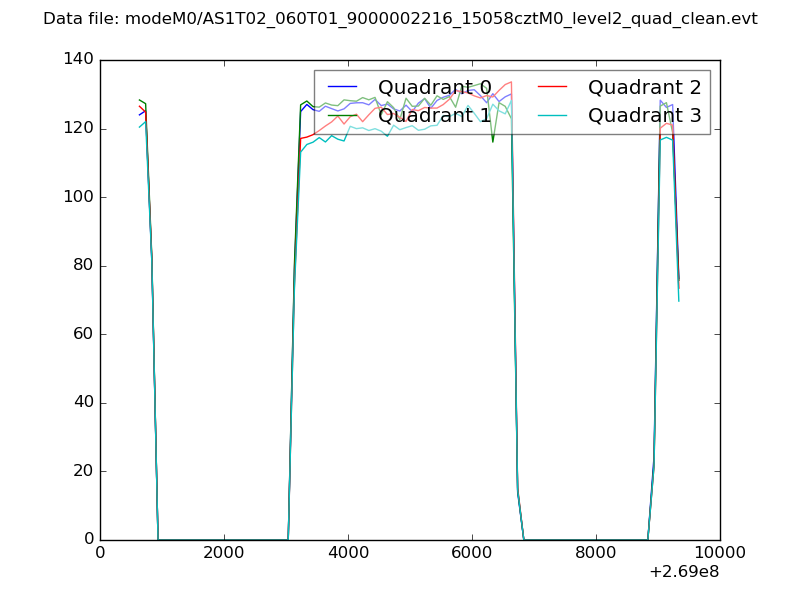 |
|
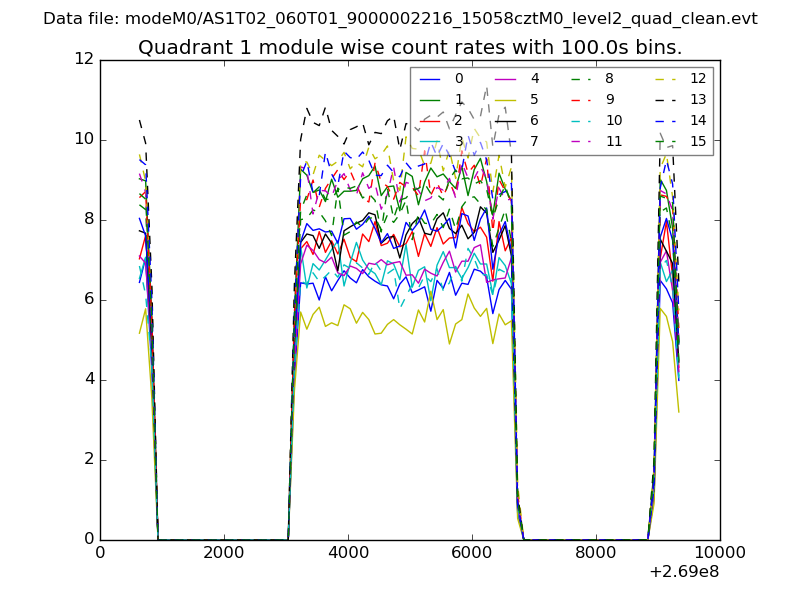
| Module-wise count rates for Quadrant A Data is divided into 100 sec bins |
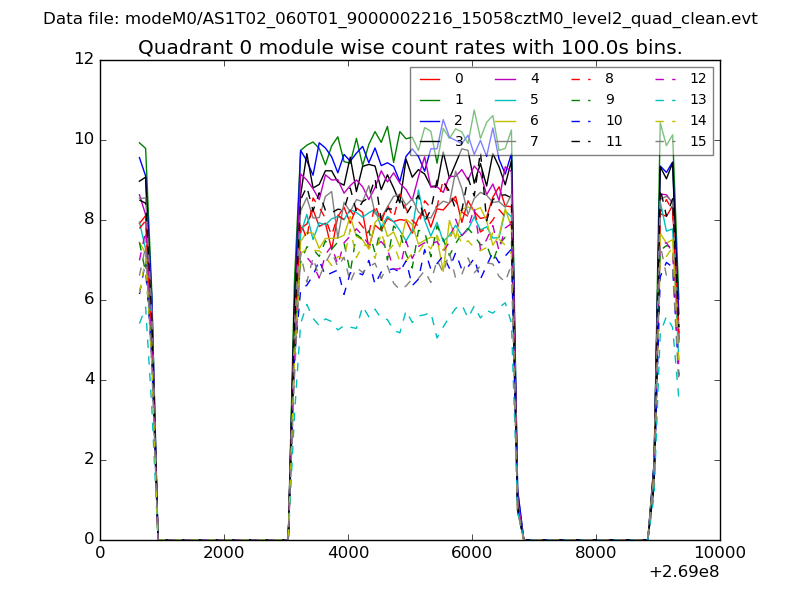 |
 |
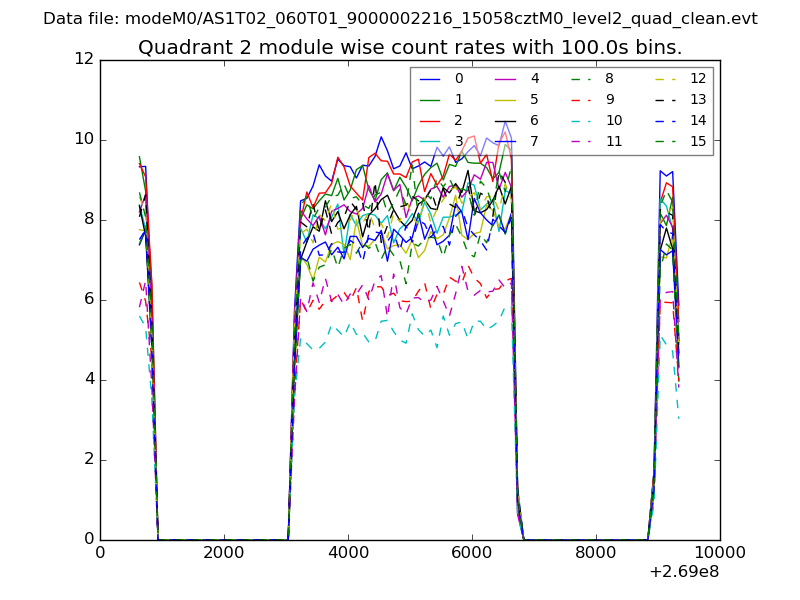
| Module-wise count rates for Quadrant B Data is divided into 100 sec bins |
 |
 |
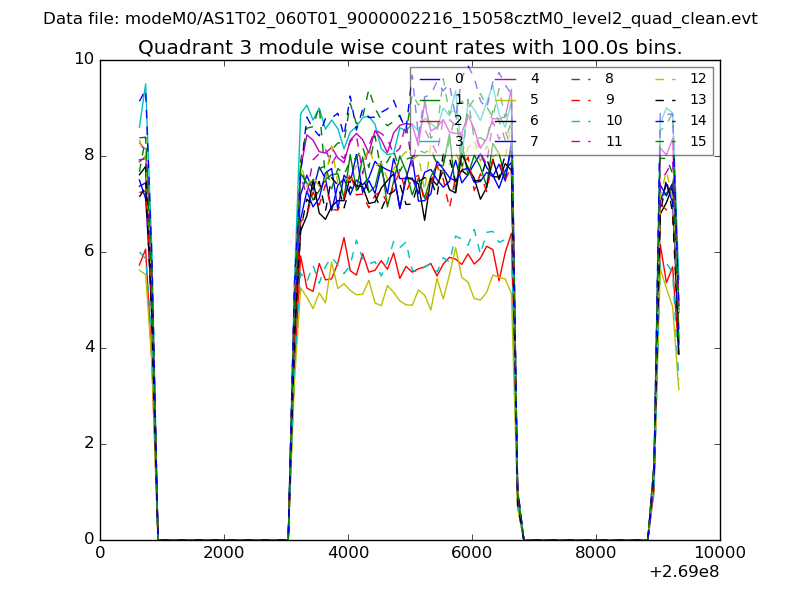
| Module-wise count rates for Quadrant C Data is divided into 100 sec bins |
 |
 |
| Module-wise count rates for Quadrant D Data is divided into 100 sec bins |
 |
 |
| Parameter | Plot |
|---|---|
| CZT HV Monitor | 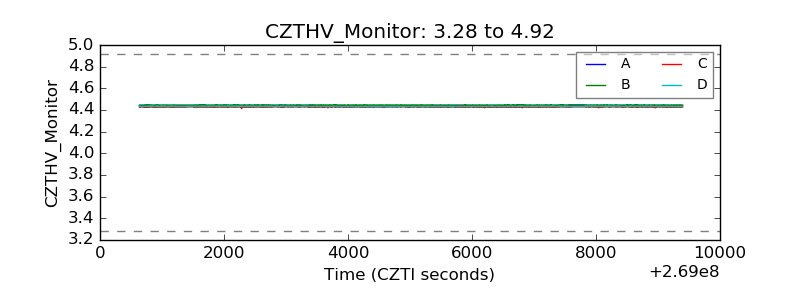 |
| D_VDD |  |
| Temperature 1 | 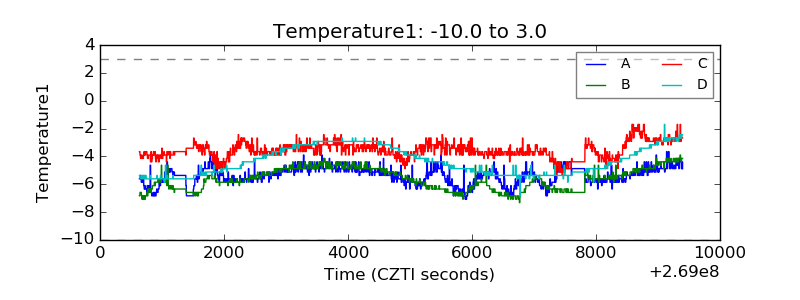 |
| Veto HV Monitor | 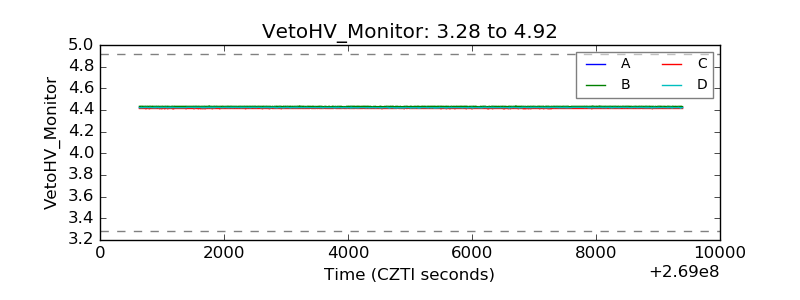 |
| Veto LLD | 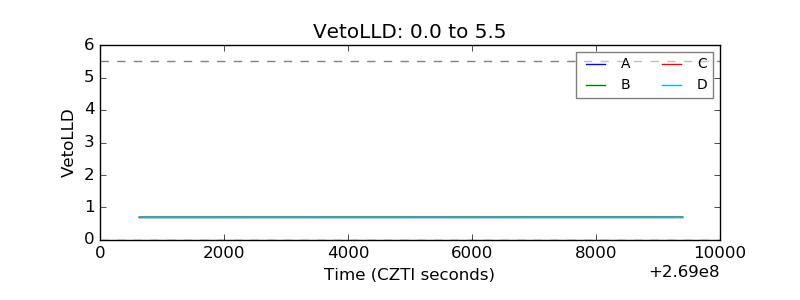 |
| Alpha Counter | 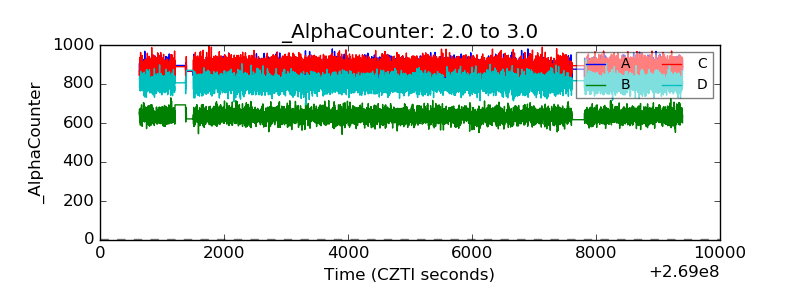 |
| _CPM_Rate | 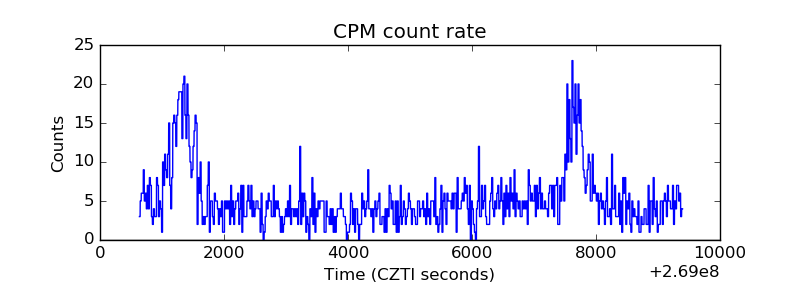 |
| CZT Counter | 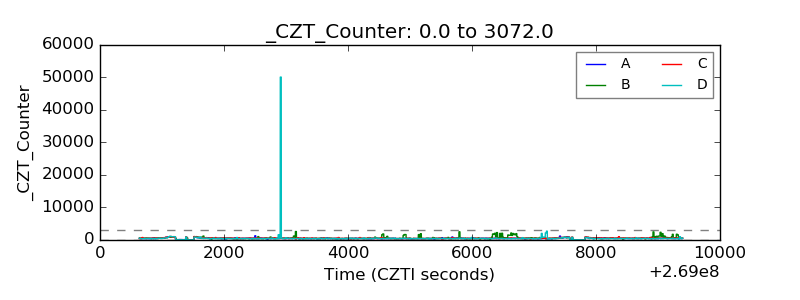 |
| +2.5 Volts monitor |  |
| +5 Volts monitor |  |
| _ROLL_ROT | 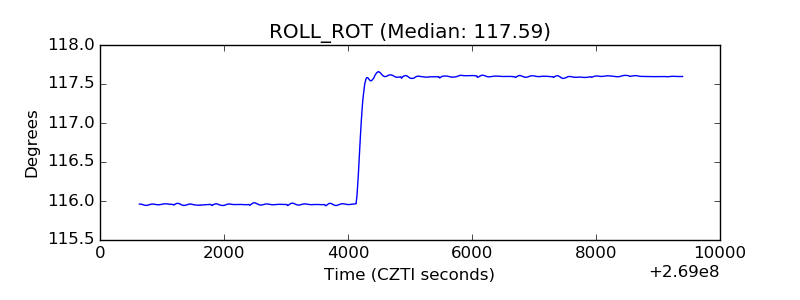 |
| _Roll_DEC | 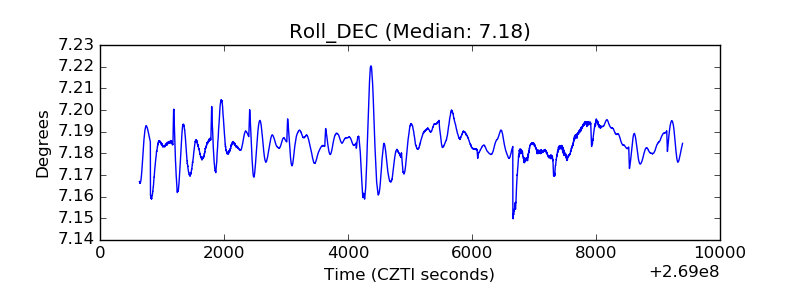 |
| _Roll_RA | 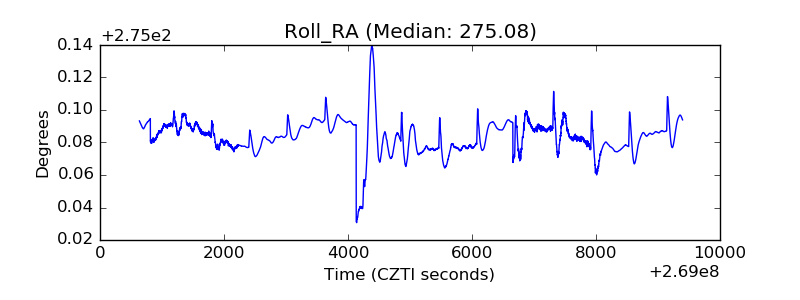 |
| Veto Counter | 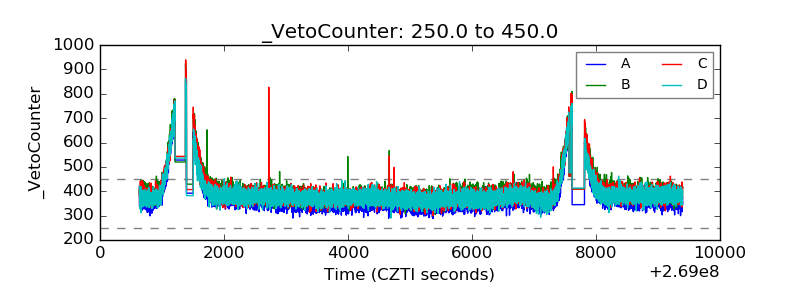 |