| Param | Original file | Final file |
|---|---|---|
| Filename | modeM0/AS1T02_060T01_9000002216_15061cztM0_level2.evt | modeM0/AS1T02_060T01_9000002216_15061cztM0_level2_quad_clean.evt |
| Size (bytes) | 835,496,640 | 171,144,000 |
| Size | 796.8 MB | 163.2 MB |
| Events in quadrant A | 6,109,242 | 1,103,270 |
| Events in quadrant B | 6,292,308 | 1,116,400 |
| Events in quadrant C | 6,500,242 | 1,081,406 |
| Events in quadrant D | 5,581,286 | 1,045,151 |
| Mode M0 | |||
|---|---|---|---|
| Quadrant | BADHDUFLAG | Total packets | Discarded packets |
| A | 0 | 25785 | 3 |
| B | 0 | 26526 | 2 |
| C | 0 | 26576 | 2 |
| D | 0 | 25024 | 2 |
| Mode M9 | |||
|---|---|---|---|
| Quadrant | BADHDUFLAG | Total packets | Discarded packets |
| A | 0 | 13 | 0 |
| B | 0 | 13 | 0 |
| C | 0 | 13 | 0 |
| D | 0 | 13 | 0 |
| Mode SS | |||
|---|---|---|---|
| Quadrant | BADHDUFLAG | Total packets | Discarded packets |
| A | 0 | 246 | 0 |
| B | 0 | 246 | 0 |
| C | 0 | 246 | 0 |
| D | 0 | 246 | 0 |
| Quadrant | Total seconds | Saturated seconds | Saturation percentage |
|---|---|---|---|
| A | 12110 | 148 | 1.222130% |
| B | 12110 | 302 | 2.493807% |
| C | 12110 | 103 | 0.850537% |
| D | 12110 | 109 | 0.900083% |
Noise dominated data is calculated using 1-second bins in cleaned event files. If a bin has >2000 counts, and if more than 50% of those come from <1% of pixels, then it is considered to be noise-dominated and hence unusable.
| Quadrant | # 1 sec bins | Bins with >0 counts | Bins with >2000 counts | High rate bins dominated by noise | Noise dominated (total time) | Noise dominated (detector-on time) | Marked lightcurve |
|---|---|---|---|---|---|---|---|
| A | 13421 | 12111 | 1 | 1 | 0.01% | 0.01% | 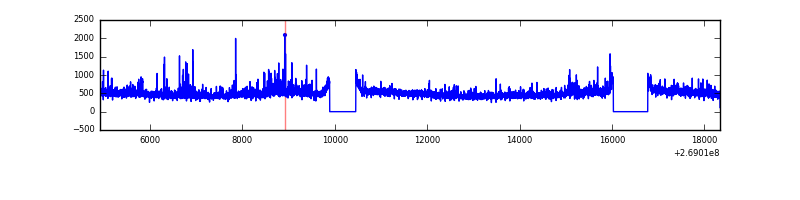 |
| B | 13421 | 12111 | 100 | 100 | 0.75% | 0.83% | 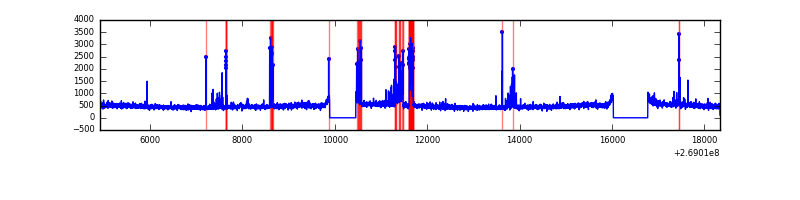 |
| C | 13421 | 12111 | 0 | 0 | 0.00% | 0.00% |  |
| D | 13421 | 12111 | 11 | 11 | 0.08% | 0.09% | 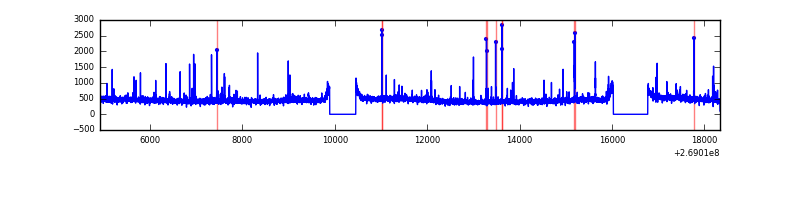 |
Top three noisy pixels from each quadrant. If the there are fewer than three noisy pixels in the level2.evt file, extra rows are filled as -1
| Pixel properties | Quadrant properties | ||||||
|---|---|---|---|---|---|---|---|
| Quadrant | DetID | PixID | Counts | Sigma | Mean | Median | Sigma |
| A | 1 | 162 | 195578 | 662.26 | 1458 | 1427 | 293.2 |
| A | 1 | 178 | 88298 | 296.32 | 1458 | 1427 | 293.2 |
| A | 1 | 161 | 78007 | 261.22 | 1458 | 1427 | 293.2 |
| B | 3 | 64 | 522228 | 1875.03 | 1447 | 1411 | 277.8 |
| B | 4 | 173 | 37190 | 128.81 | 1447 | 1411 | 277.8 |
| B | 10 | 245 | 34875 | 120.48 | 1447 | 1411 | 277.8 |
| C | 3 | 233 | 959439 | 2920.18 | 1418 | 1426 | 328.1 |
| C | 13 | 61 | 10153 | 26.6 | 1418 | 1426 | 328.1 |
| C | 3 | 232 | 7680 | 19.06 | 1418 | 1426 | 328.1 |
| D | 13 | 249 | 131295 | 378.22 | 1420 | 1378 | 343.5 |
| D | 2 | 234 | 41555 | 116.96 | 1420 | 1378 | 343.5 |
| D | 2 | 152 | 32243 | 89.86 | 1420 | 1378 | 343.5 |
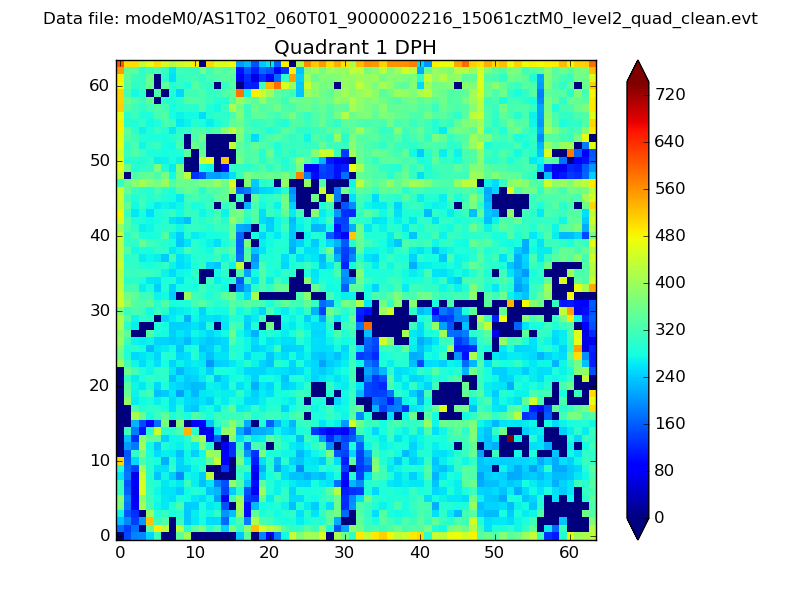
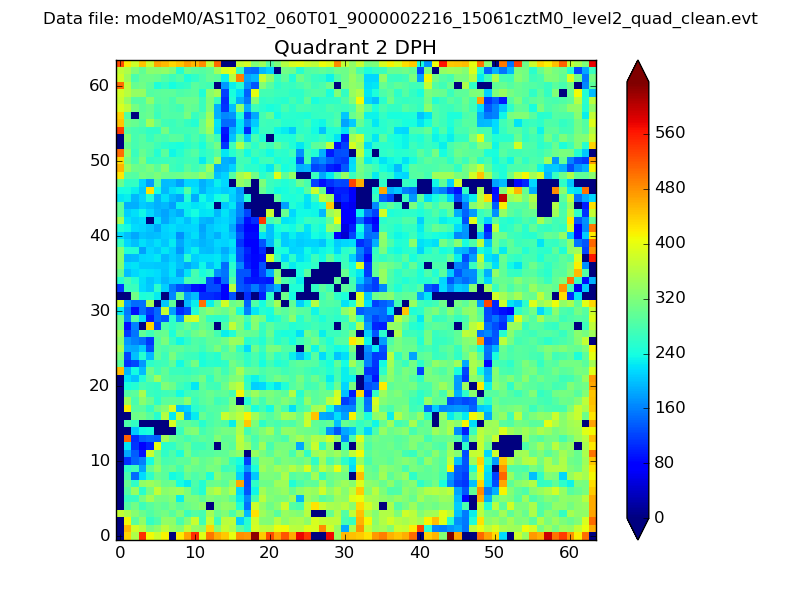
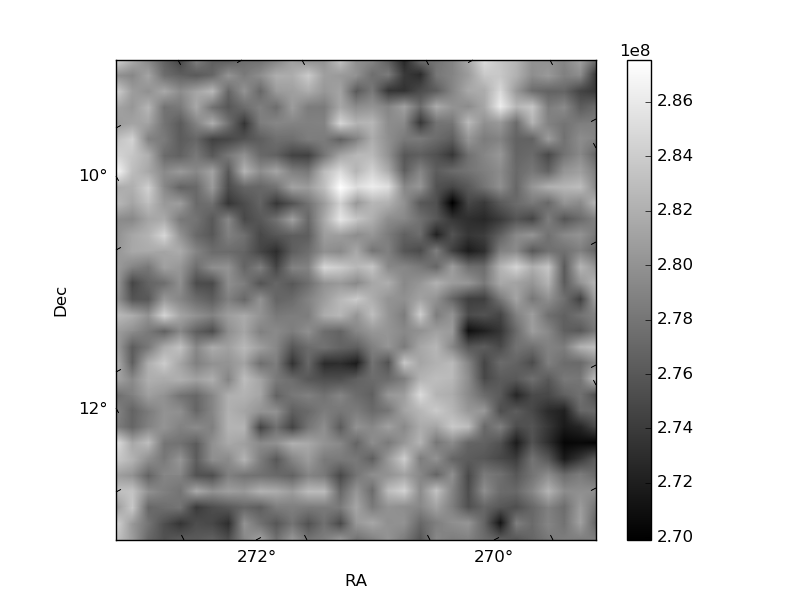
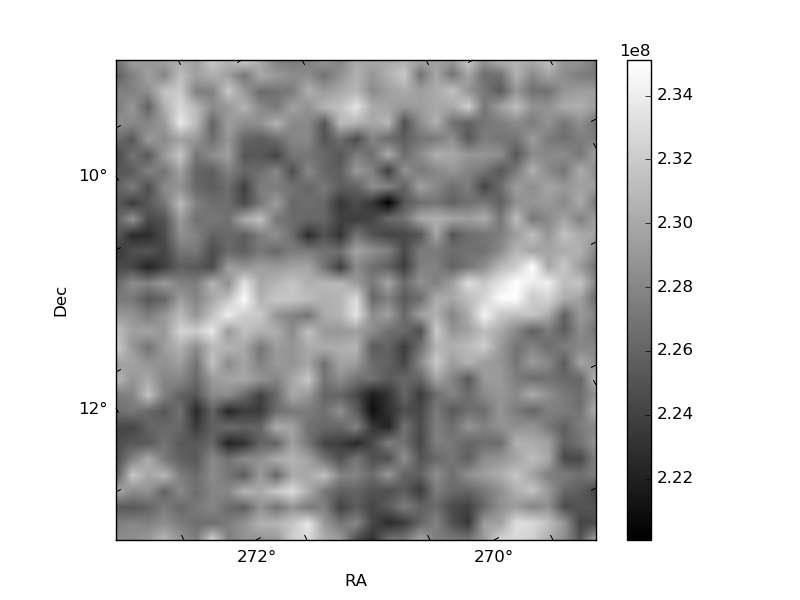
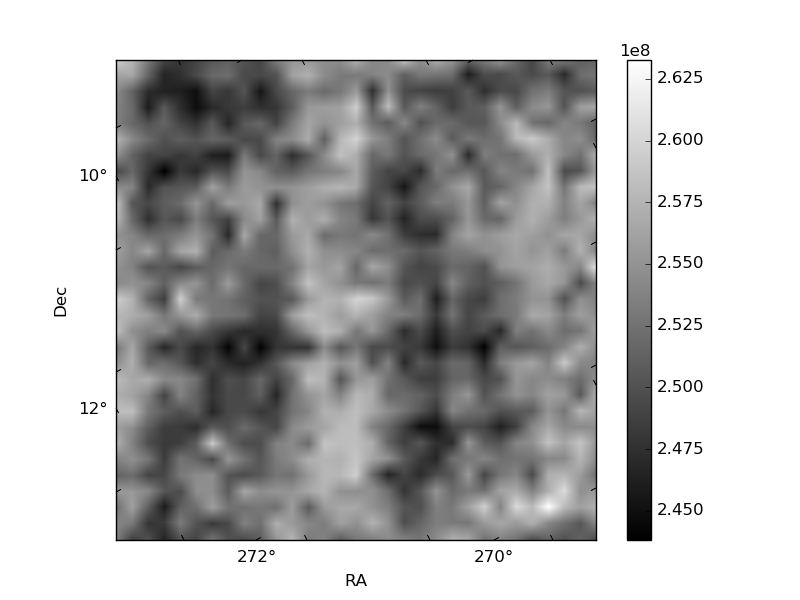
Histogram calculated using DETX and DETY for each event in the final _common_clean file
| Quadrant A | 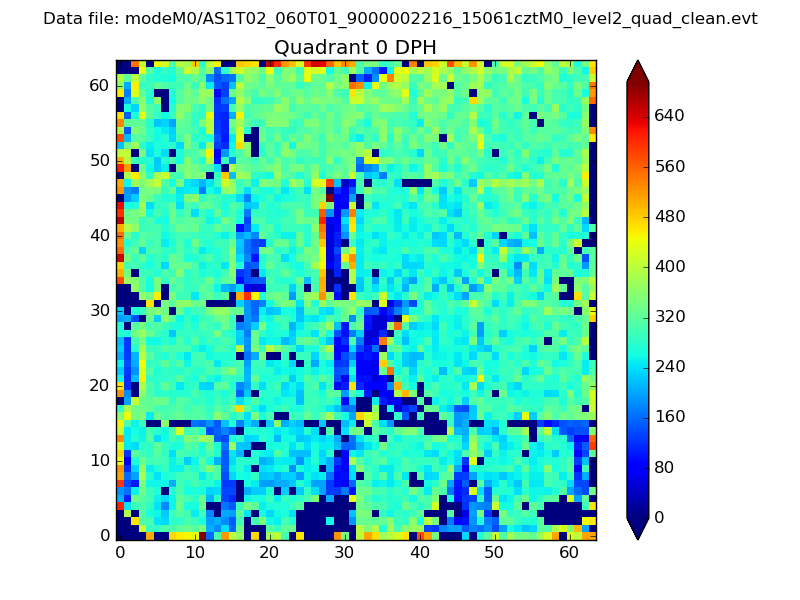 |
 |
Quadrant B |
|---|---|---|---|
| Quadrant D |  |
 |
Quadrant C |
| Plot type | Count rate plots | Images |
|---|---|---|
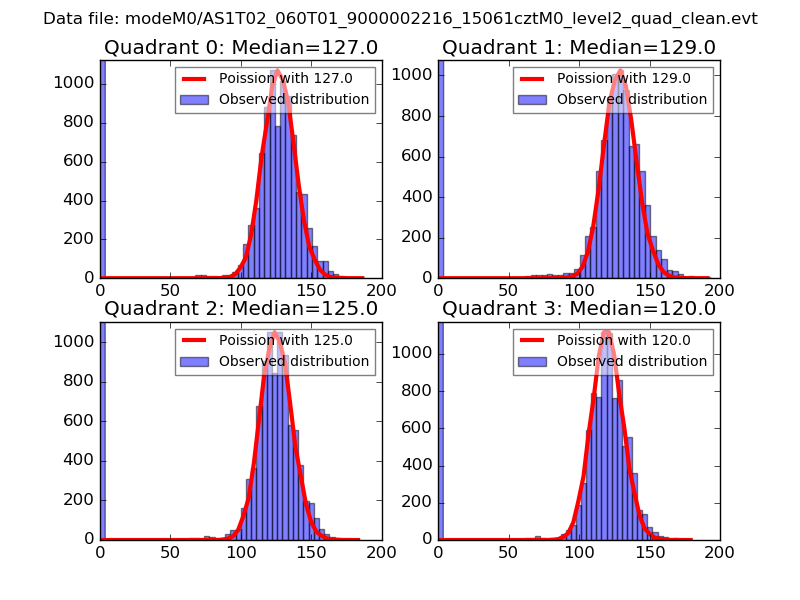
| Comparison with Poisson distribution Blue bars denote a histogram of data divided into 1 sec bins. Red curve is a Poisson curve with rate = median count rate of data. |
 |
 |
| Quadrant-wise count rates Data is divided into 100 sec bins |
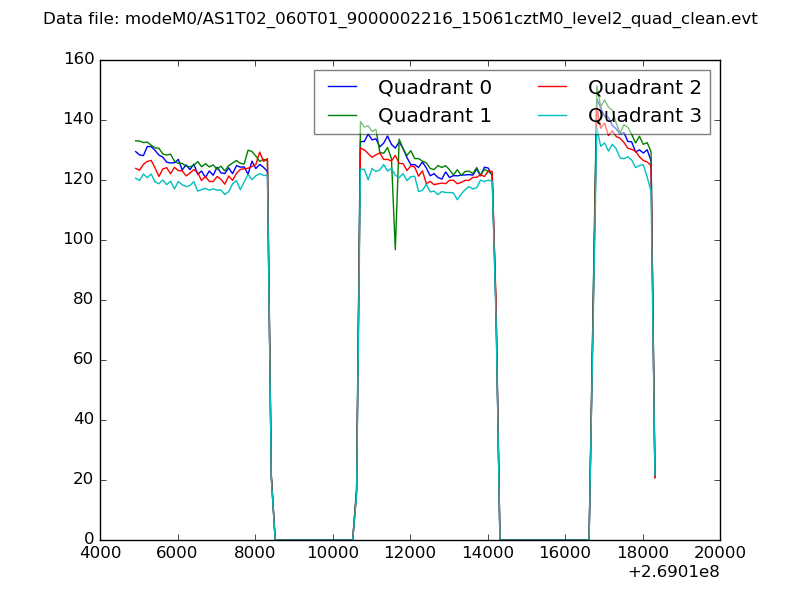 |
|
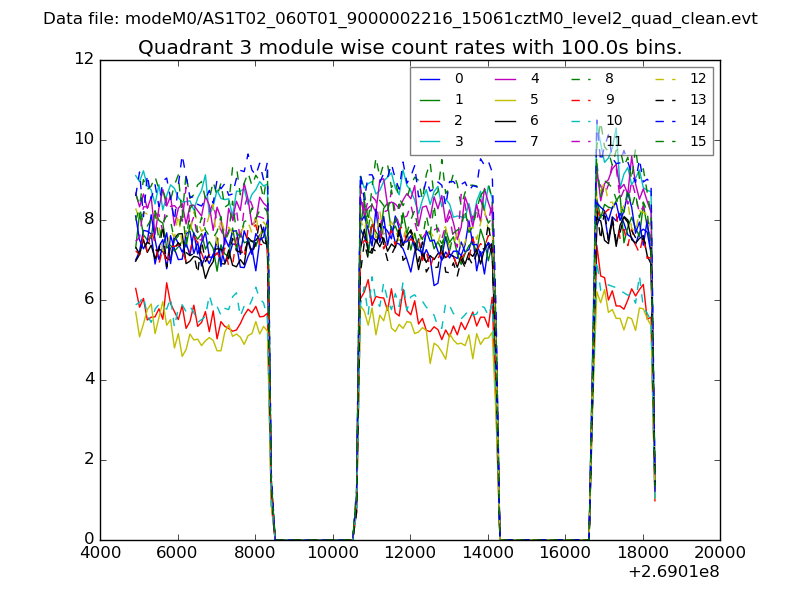
| Module-wise count rates for Quadrant A Data is divided into 100 sec bins |
 |
 |
| Module-wise count rates for Quadrant B Data is divided into 100 sec bins |
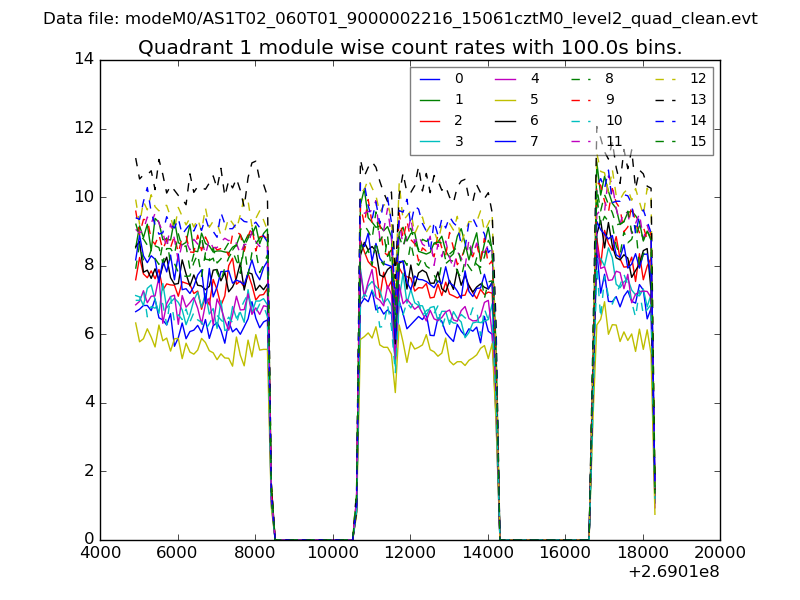 |
 |
| Module-wise count rates for Quadrant C Data is divided into 100 sec bins |
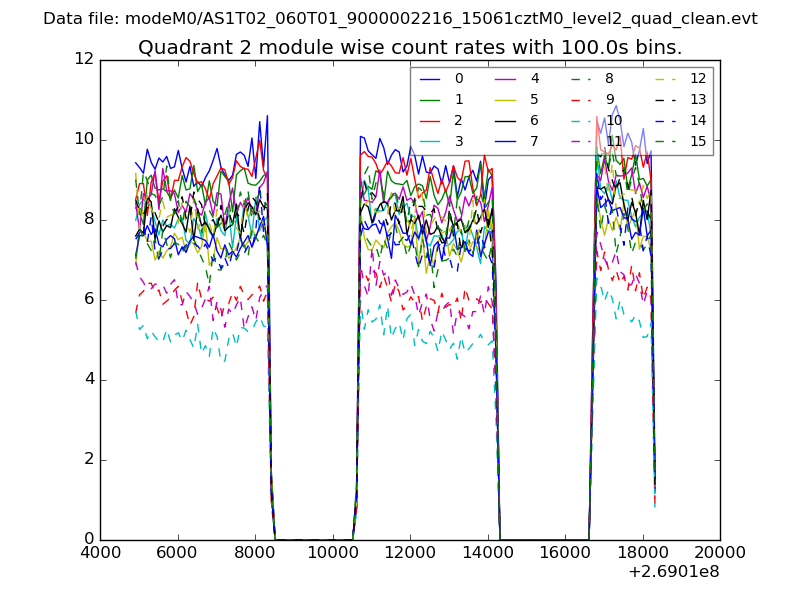 |
 |
| Module-wise count rates for Quadrant D Data is divided into 100 sec bins |
 |
 |
| Parameter | Plot |
|---|---|
| CZT HV Monitor | 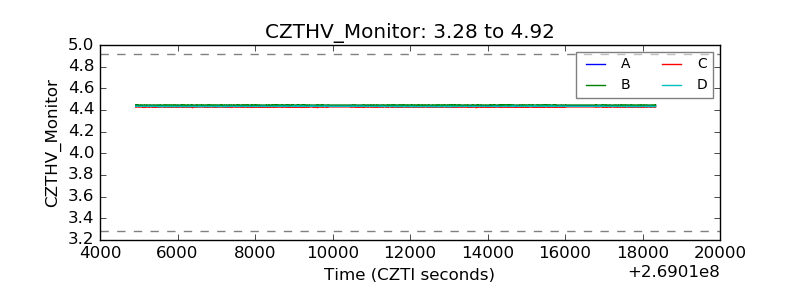 |
| D_VDD | 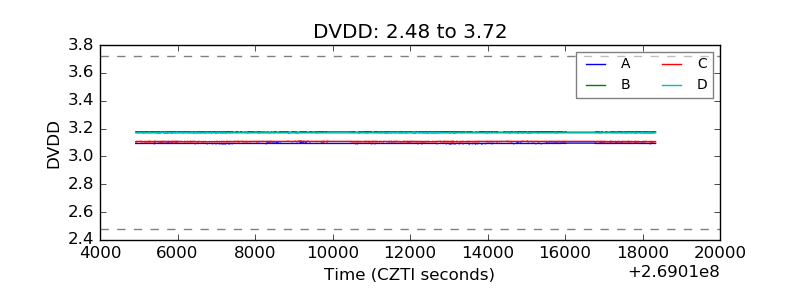 |
| Temperature 1 | 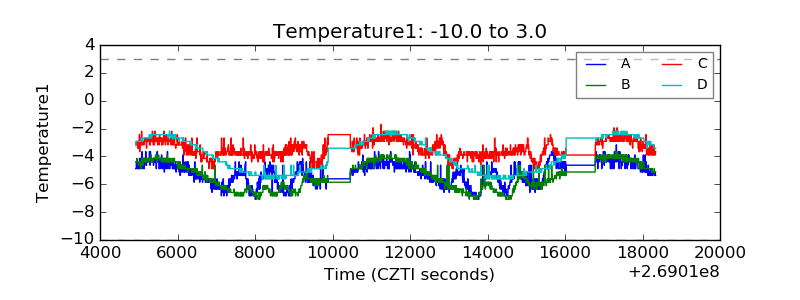 |
| Veto HV Monitor | 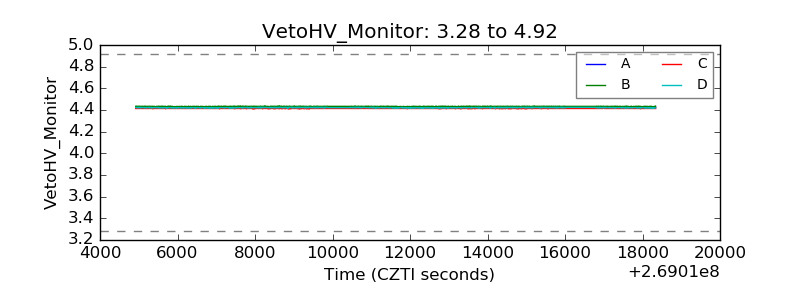 |
| Veto LLD | 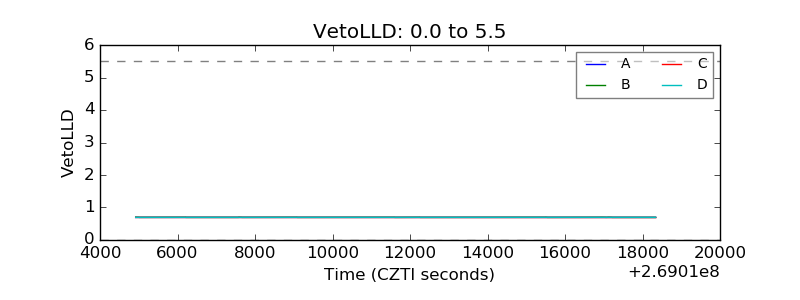 |
| Alpha Counter | 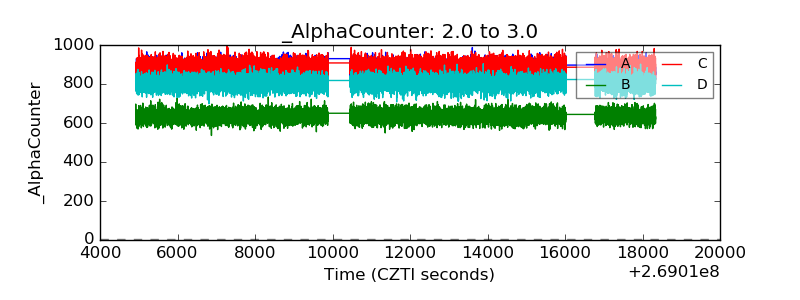 |
| _CPM_Rate | 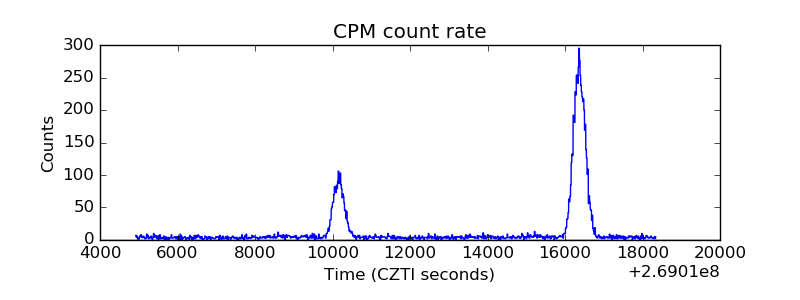 |
| CZT Counter | 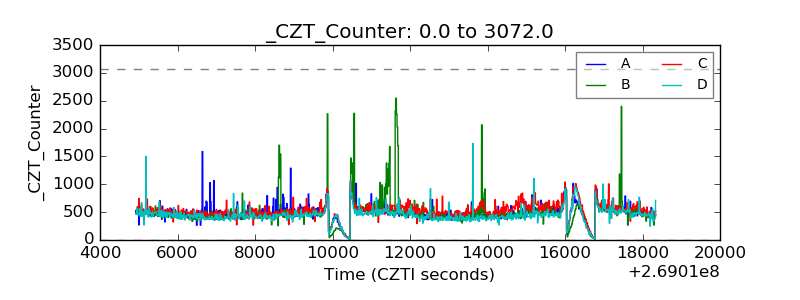 |
| +2.5 Volts monitor |  |
| +5 Volts monitor |  |
| _ROLL_ROT | 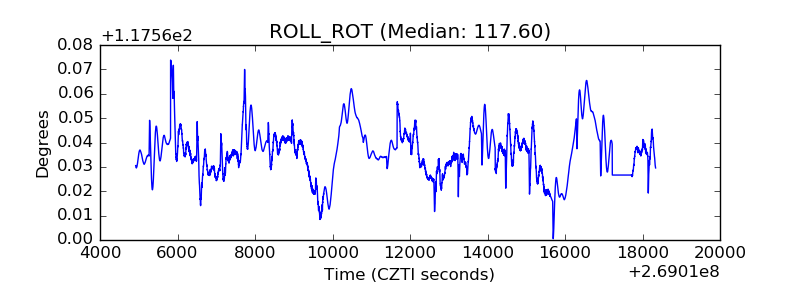 |
| _Roll_DEC | 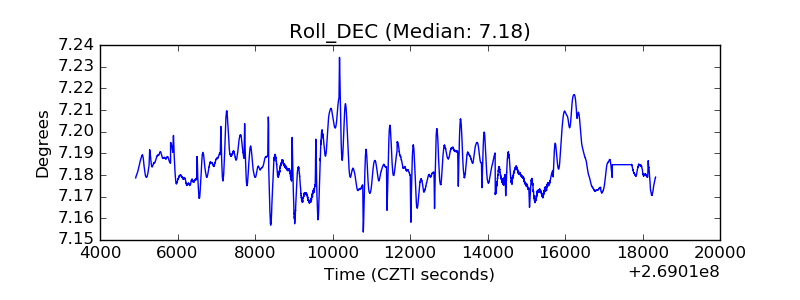 |
| _Roll_RA | 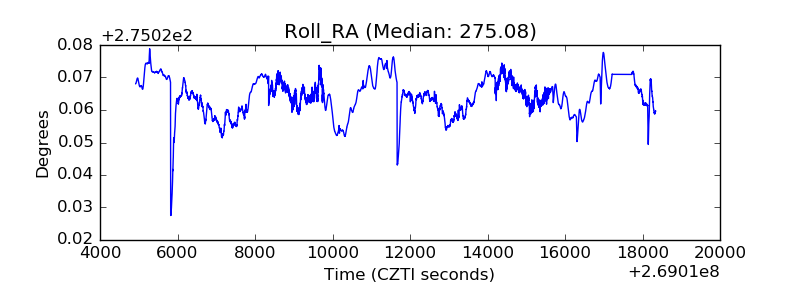 |
| Veto Counter | 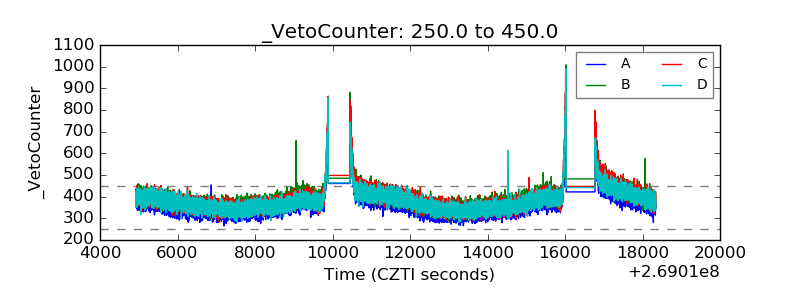 |