| Param | Original file | Final file |
|---|---|---|
| Filename | modeM0/AS1T02_060T01_9000002216_15062cztM0_level2.evt | modeM0/AS1T02_060T01_9000002216_15062cztM0_level2_quad_clean.evt |
| Size (bytes) | 469,480,320 | 97,580,160 |
| Size | 447.7 MB | 93.1 MB |
| Events in quadrant A | 3,456,614 | 627,500 |
| Events in quadrant B | 3,377,022 | 639,761 |
| Events in quadrant C | 3,691,060 | 618,571 |
| Events in quadrant D | 3,232,734 | 596,616 |
| Mode M0 | |||
|---|---|---|---|
| Quadrant | BADHDUFLAG | Total packets | Discarded packets |
| A | 0 | 14619 | 3 |
| B | 0 | 14425 | 2 |
| C | 0 | 15227 | 2 |
| D | 0 | 14324 | 2 |
| Mode M9 | |||
|---|---|---|---|
| Quadrant | BADHDUFLAG | Total packets | Discarded packets |
| A | 0 | 10 | 0 |
| B | 0 | 10 | 0 |
| C | 0 | 10 | 0 |
| D | 0 | 11 | 0 |
| Mode SS | |||
|---|---|---|---|
| Quadrant | BADHDUFLAG | Total packets | Discarded packets |
| A | 0 | 138 | 0 |
| B | 0 | 138 | 0 |
| C | 0 | 138 | 0 |
| D | 0 | 138 | 0 |
| Quadrant | Total seconds | Saturated seconds | Saturation percentage |
|---|---|---|---|
| A | 6781 | 64 | 0.943814% |
| B | 6781 | 87 | 1.282997% |
| C | 6781 | 62 | 0.914319% |
| D | 6781 | 64 | 0.943814% |
Noise dominated data is calculated using 1-second bins in cleaned event files. If a bin has >2000 counts, and if more than 50% of those come from <1% of pixels, then it is considered to be noise-dominated and hence unusable.
| Quadrant | # 1 sec bins | Bins with >0 counts | Bins with >2000 counts | High rate bins dominated by noise | Noise dominated (total time) | Noise dominated (detector-on time) | Marked lightcurve |
|---|---|---|---|---|---|---|---|
| A | 7682 | 6782 | 0 | 0 | 0.00% | 0.00% | 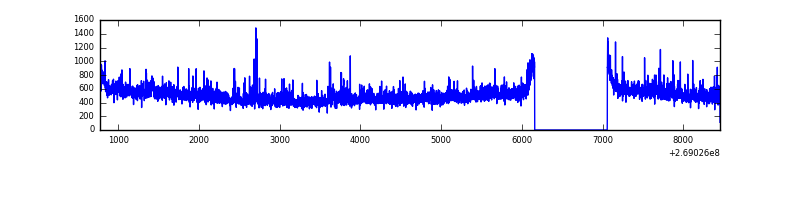 |
| B | 7682 | 6782 | 3 | 3 | 0.04% | 0.04% | 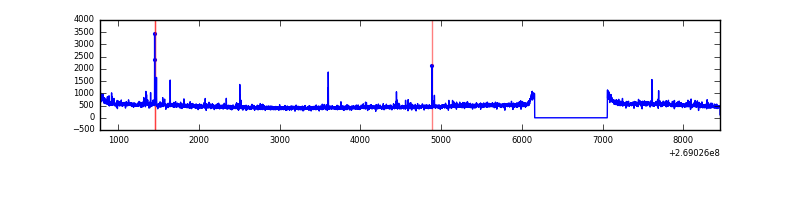 |
| C | 7682 | 6782 | 0 | 0 | 0.00% | 0.00% | 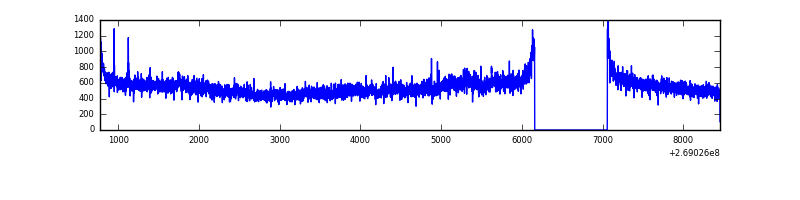 |
| D | 7682 | 6782 | 15 | 15 | 0.20% | 0.22% | 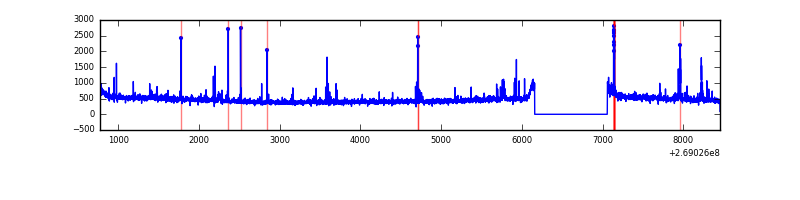 |
Top three noisy pixels from each quadrant. If the there are fewer than three noisy pixels in the level2.evt file, extra rows are filled as -1
| Pixel properties | Quadrant properties | ||||||
|---|---|---|---|---|---|---|---|
| Quadrant | DetID | PixID | Counts | Sigma | Mean | Median | Sigma |
| A | 1 | 162 | 110193 | 648.77 | 832 | 815 | 168.6 |
| A | 1 | 178 | 48760 | 284.38 | 832 | 815 | 168.6 |
| A | 1 | 161 | 43654 | 254.1 | 832 | 815 | 168.6 |
| B | 3 | 64 | 56469 | 344.41 | 831 | 809 | 161.6 |
| B | 4 | 173 | 37561 | 227.41 | 831 | 809 | 161.6 |
| B | 12 | 111 | 19380 | 114.91 | 831 | 809 | 161.6 |
| C | 3 | 233 | 517326 | 2726.34 | 813 | 817 | 189.5 |
| C | 13 | 61 | 5607 | 25.28 | 813 | 817 | 189.5 |
| C | 3 | 232 | 3342 | 13.33 | 813 | 817 | 189.5 |
| D | 13 | 249 | 94825 | 477.34 | 812 | 789 | 197.0 |
| D | 2 | 234 | 22976 | 112.62 | 812 | 789 | 197.0 |
| D | 13 | 104 | 20231 | 98.69 | 812 | 789 | 197.0 |
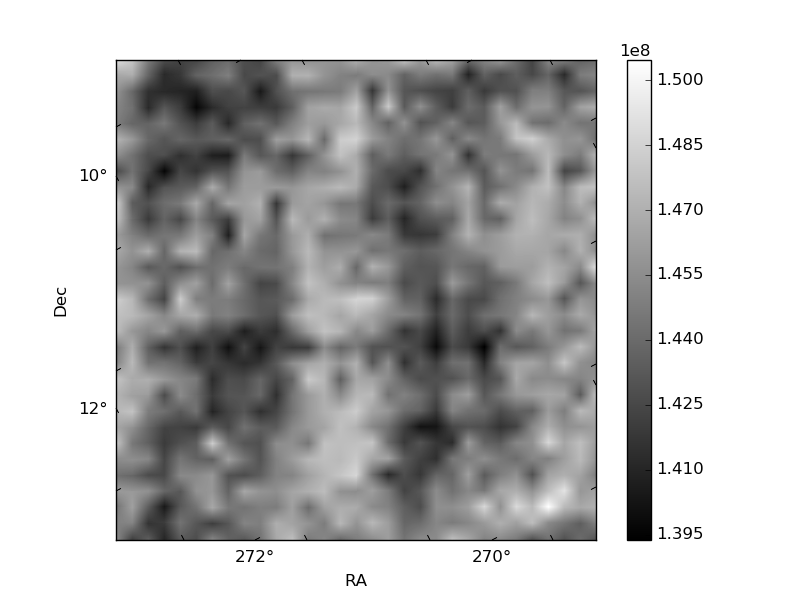
Histogram calculated using DETX and DETY for each event in the final _common_clean file
| Quadrant A | 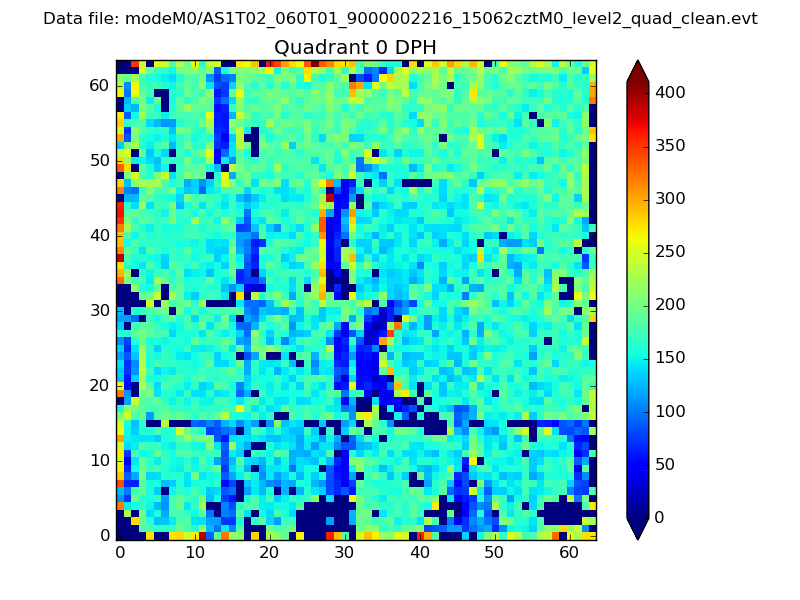 |
 |
Quadrant B |
|---|---|---|---|
| Quadrant D | 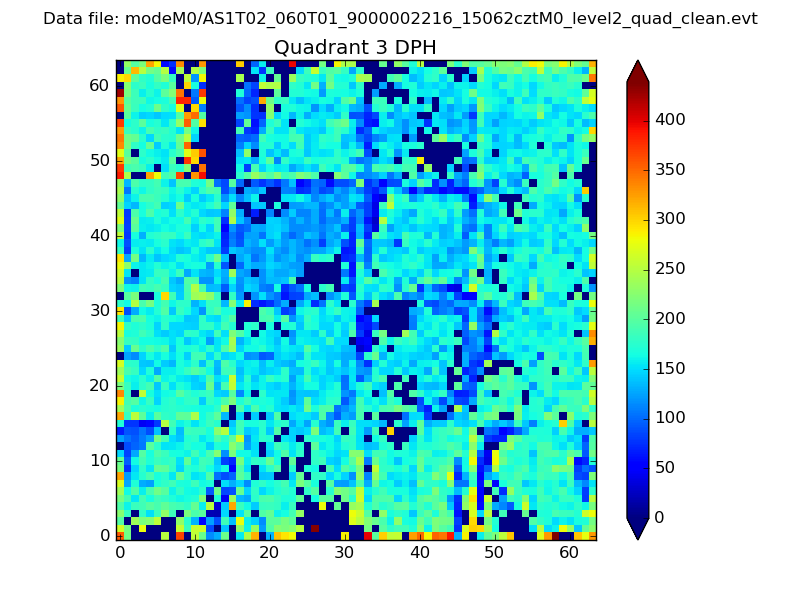 |
 |
Quadrant C |
| Plot type | Count rate plots | Images |
|---|---|---|
| Comparison with Poisson distribution Blue bars denote a histogram of data divided into 1 sec bins. Red curve is a Poisson curve with rate = median count rate of data. |
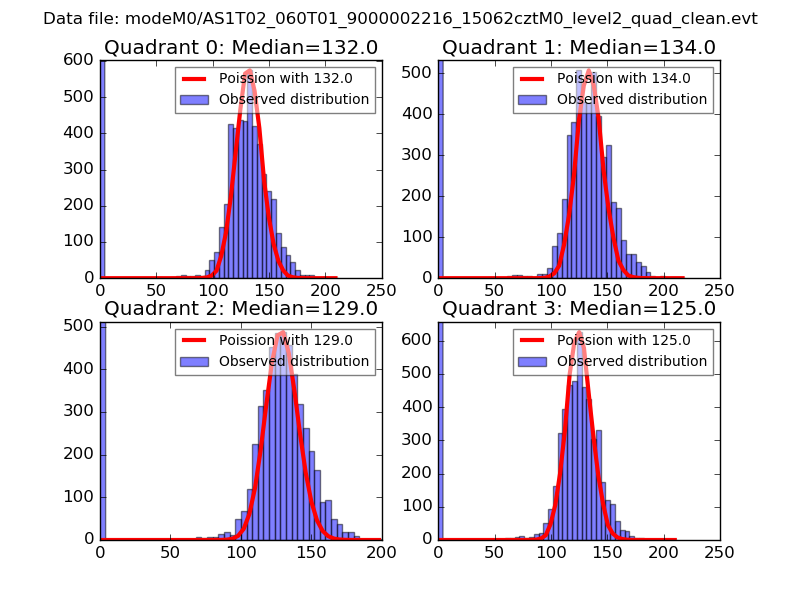 |
 |
| Quadrant-wise count rates Data is divided into 100 sec bins |
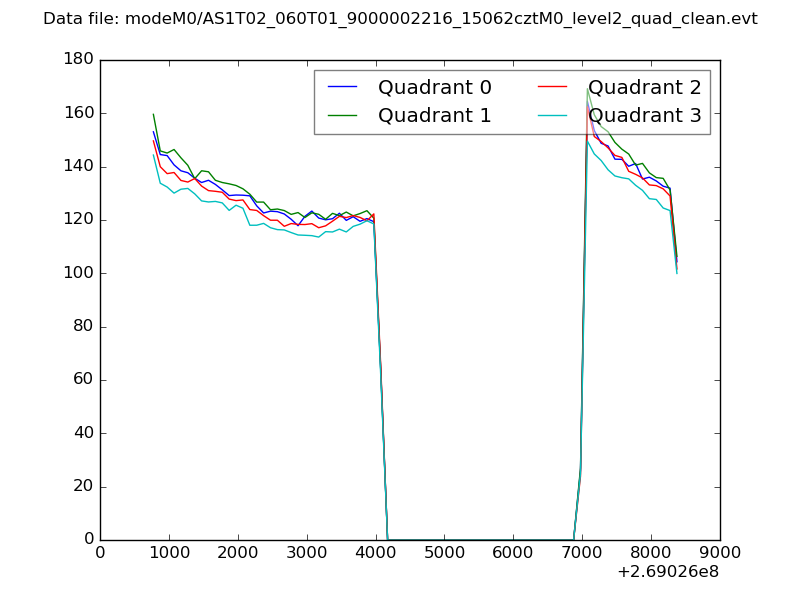 |
|
| Module-wise count rates for Quadrant A Data is divided into 100 sec bins |
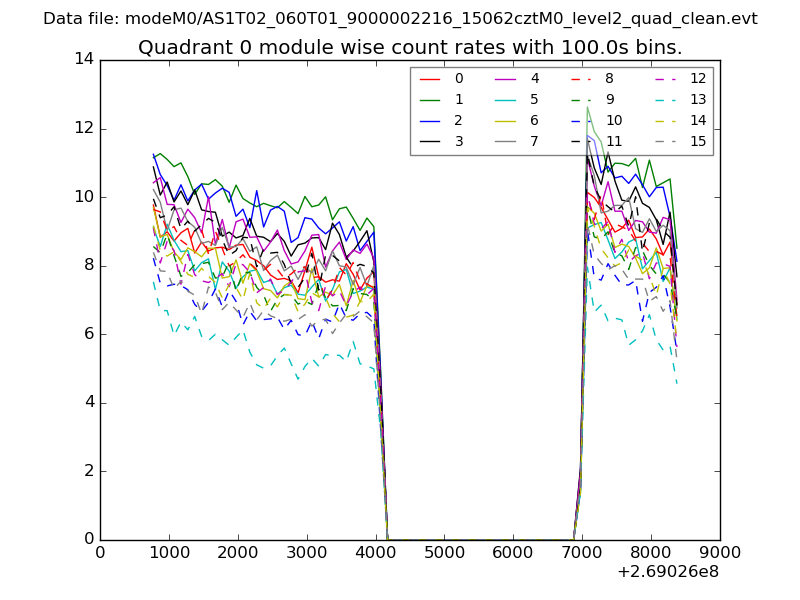 |
 |
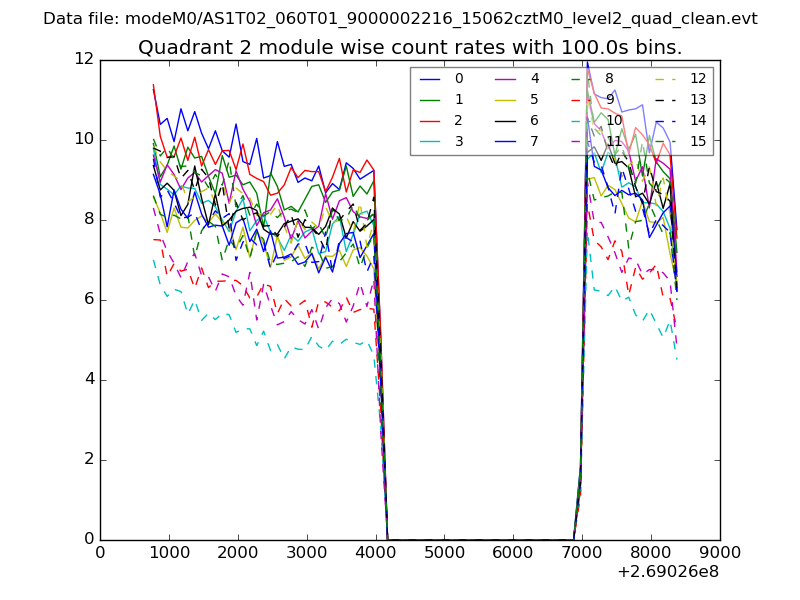
| Module-wise count rates for Quadrant B Data is divided into 100 sec bins |
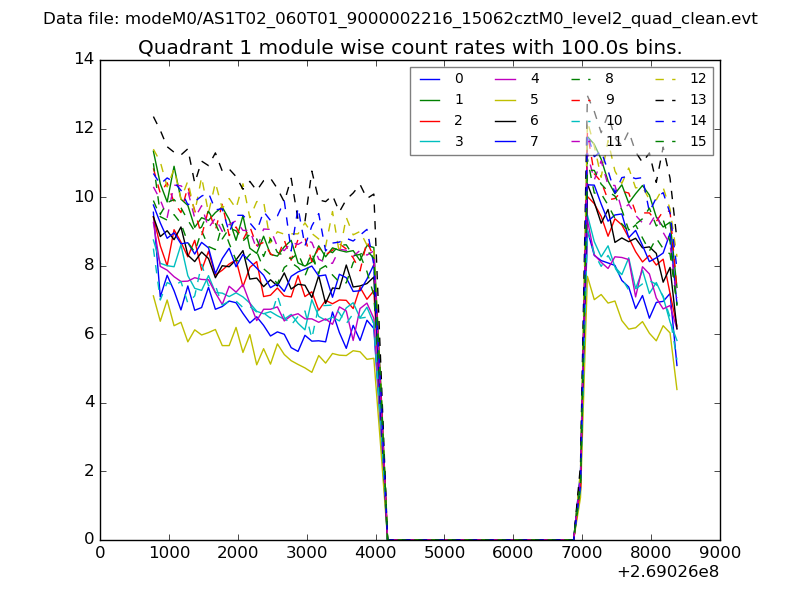 |
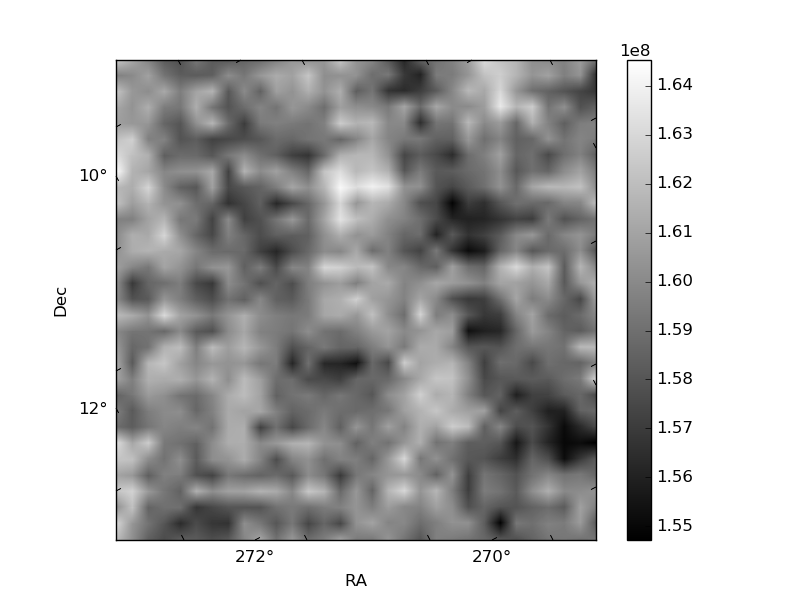 |
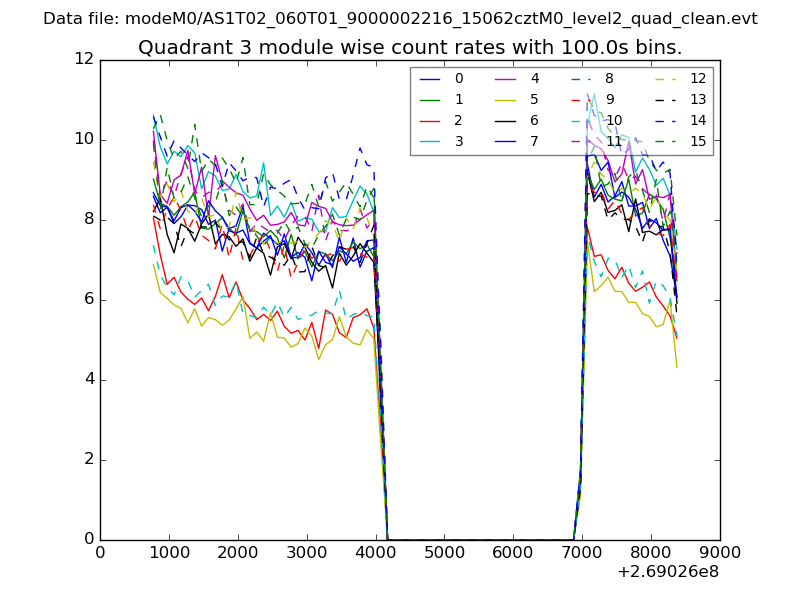
| Module-wise count rates for Quadrant C Data is divided into 100 sec bins |
 |
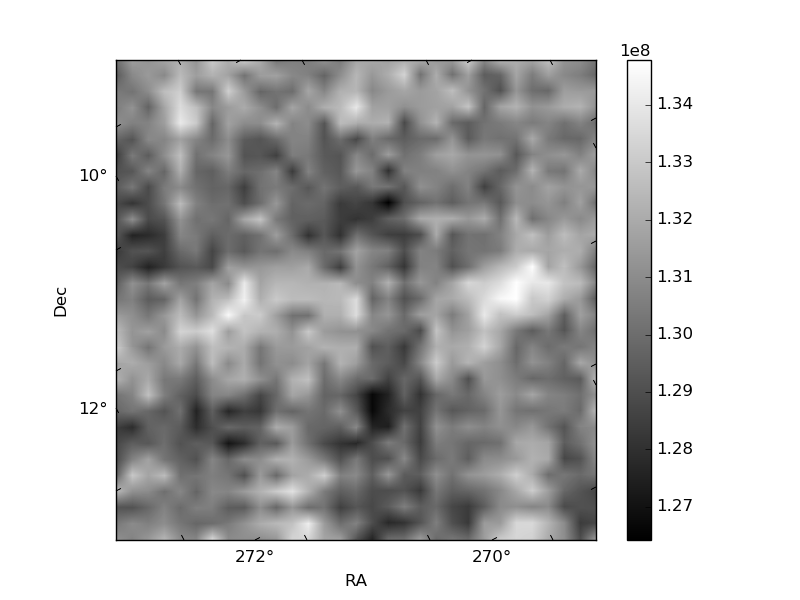 |
| Module-wise count rates for Quadrant D Data is divided into 100 sec bins |
 |
 |
| Parameter | Plot |
|---|---|
| CZT HV Monitor | 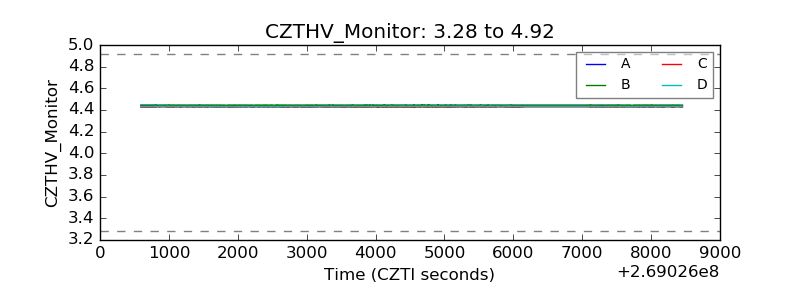 |
| D_VDD | 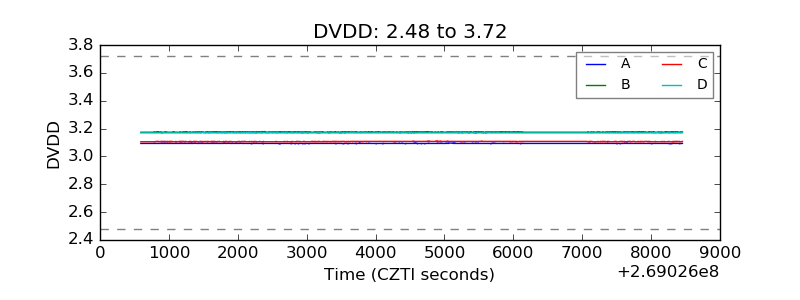 |
| Temperature 1 | 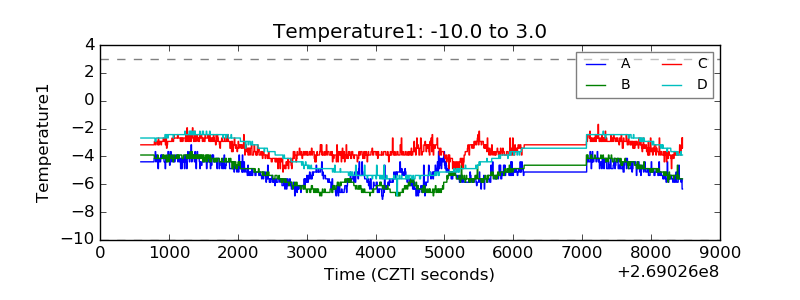 |
| Veto HV Monitor | 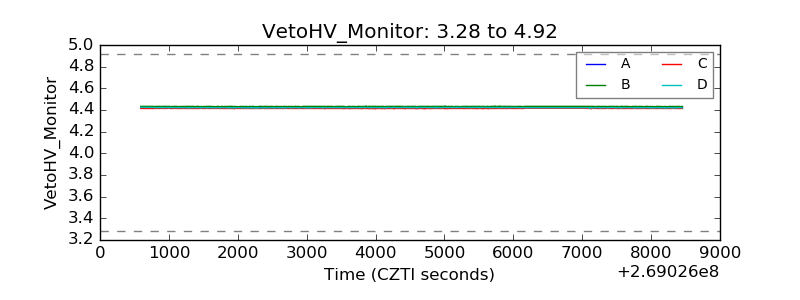 |
| Veto LLD | 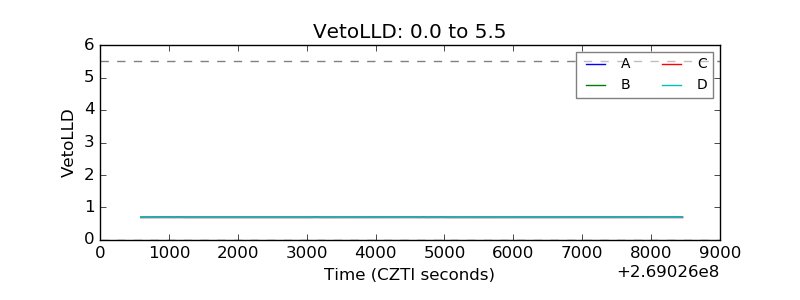 |
| Alpha Counter | 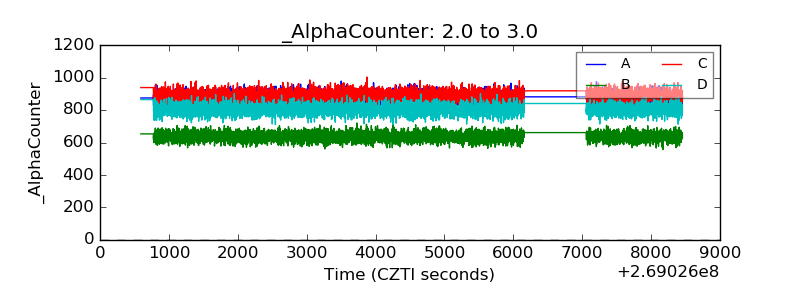 |
| _CPM_Rate | 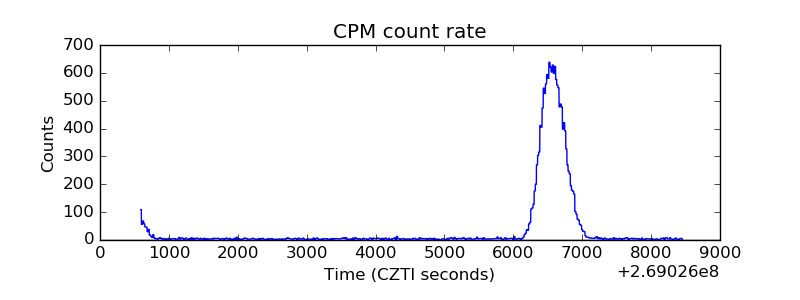 |
| CZT Counter | 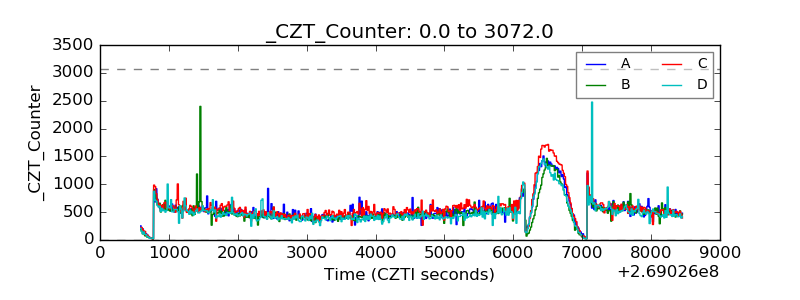 |
| +2.5 Volts monitor |  |
| +5 Volts monitor |  |
| _ROLL_ROT | 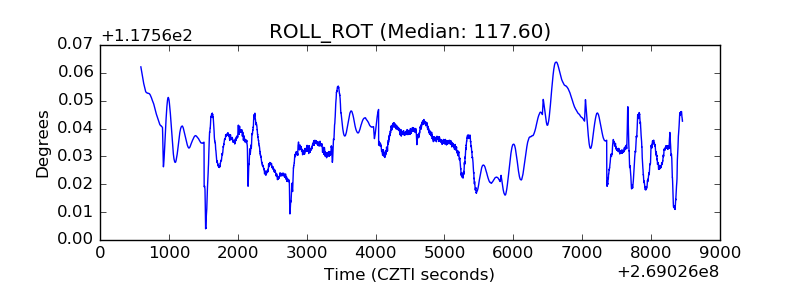 |
| _Roll_DEC | 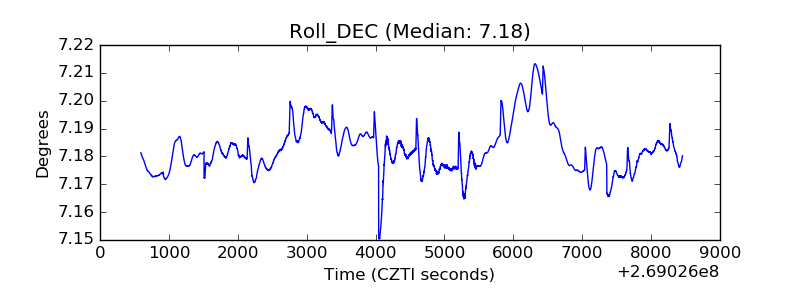 |
| _Roll_RA | 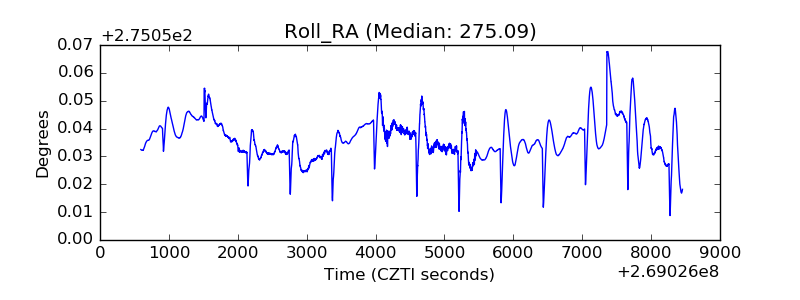 |
| Veto Counter | 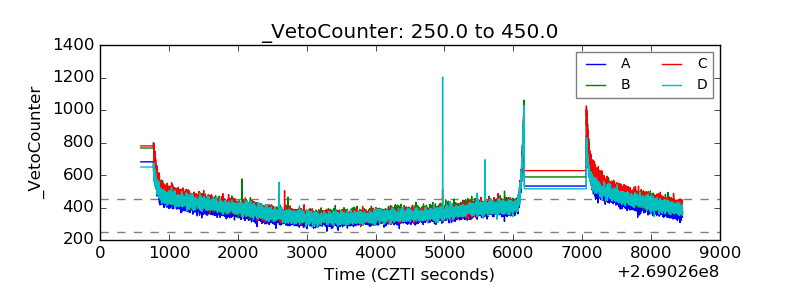 |