| Param | Original file | Final file |
|---|---|---|
| Filename | modeM0/AS1T02_060T01_9000002216_15066cztM0_level2.evt | modeM0/AS1T02_060T01_9000002216_15066cztM0_level2_quad_clean.evt |
| Size (bytes) | 440,147,520 | 92,612,160 |
| Size | 419.8 MB | 88.3 MB |
| Events in quadrant A | 3,181,640 | 599,510 |
| Events in quadrant B | 3,300,685 | 620,657 |
| Events in quadrant C | 3,458,787 | 591,257 |
| Events in quadrant D | 2,967,602 | 560,521 |
| Mode M0 | |||
|---|---|---|---|
| Quadrant | BADHDUFLAG | Total packets | Discarded packets |
| A | 0 | 13258 | 3 |
| B | 0 | 13559 | 2 |
| C | 0 | 13990 | 2 |
| D | 0 | 13000 | 2 |
| Mode M9 | |||
|---|---|---|---|
| Quadrant | BADHDUFLAG | Total packets | Discarded packets |
| A | 0 | 15 | 0 |
| B | 0 | 15 | 0 |
| C | 0 | 15 | 0 |
| D | 0 | 16 | 0 |
| Mode SS | |||
|---|---|---|---|
| Quadrant | BADHDUFLAG | Total packets | Discarded packets |
| A | 0 | 126 | 0 |
| B | 0 | 126 | 0 |
| C | 0 | 126 | 0 |
| D | 0 | 126 | 0 |
| Quadrant | Total seconds | Saturated seconds | Saturation percentage |
|---|---|---|---|
| A | 6200 | 44 | 0.709677% |
| B | 6200 | 48 | 0.774194% |
| C | 6200 | 29 | 0.467742% |
| D | 6200 | 36 | 0.580645% |
Noise dominated data is calculated using 1-second bins in cleaned event files. If a bin has >2000 counts, and if more than 50% of those come from <1% of pixels, then it is considered to be noise-dominated and hence unusable.
| Quadrant | # 1 sec bins | Bins with >0 counts | Bins with >2000 counts | High rate bins dominated by noise | Noise dominated (total time) | Noise dominated (detector-on time) | Marked lightcurve |
|---|---|---|---|---|---|---|---|
| A | 7486 | 6202 | 0 | 0 | 0.00% | 0.00% | 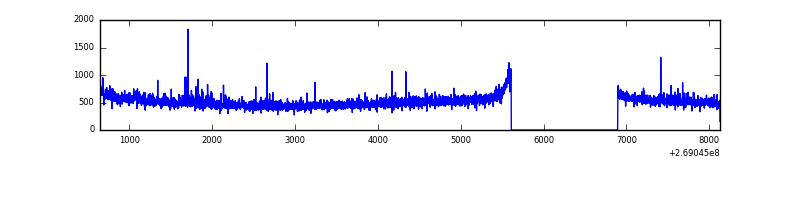 |
| B | 7486 | 6201 | 0 | 0 | 0.00% | 0.00% | 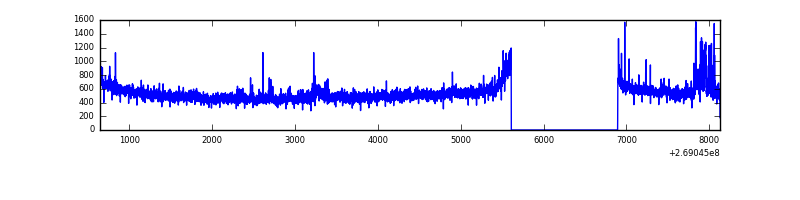 |
| C | 7486 | 6202 | 0 | 0 | 0.00% | 0.00% | 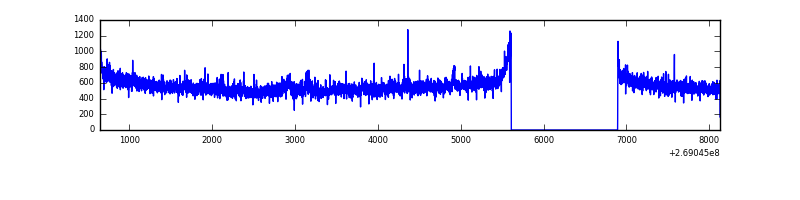 |
| D | 7486 | 6202 | 8 | 8 | 0.11% | 0.13% | 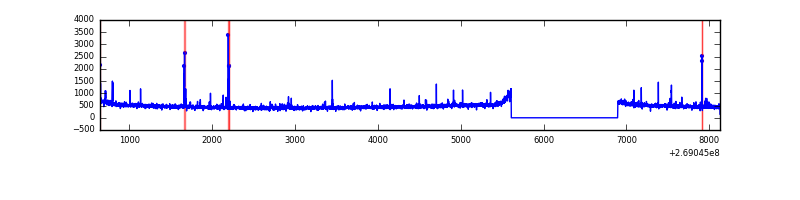 |
Top three noisy pixels from each quadrant. If the there are fewer than three noisy pixels in the level2.evt file, extra rows are filled as -1
| Pixel properties | Quadrant properties | ||||||
|---|---|---|---|---|---|---|---|
| Quadrant | DetID | PixID | Counts | Sigma | Mean | Median | Sigma |
| A | 1 | 162 | 59966 | 374.62 | 792 | 780 | 158.0 |
| A | 1 | 178 | 27623 | 169.9 | 792 | 780 | 158.0 |
| A | 1 | 161 | 23710 | 145.13 | 792 | 780 | 158.0 |
| B | 3 | 64 | 171484 | 1127.48 | 797 | 779 | 151.4 |
| B | 12 | 111 | 17649 | 111.42 | 797 | 779 | 151.4 |
| B | 11 | 111 | 15493 | 97.18 | 797 | 779 | 151.4 |
| C | 3 | 233 | 462238 | 2593.83 | 768 | 774 | 177.9 |
| C | 13 | 61 | 5368 | 25.82 | 768 | 774 | 177.9 |
| C | 3 | 232 | 2937 | 12.16 | 768 | 774 | 177.9 |
| D | 13 | 249 | 75947 | 405.09 | 761 | 741 | 185.7 |
| D | 2 | 234 | 20288 | 105.29 | 761 | 741 | 185.7 |
| D | 13 | 104 | 10005 | 49.9 | 761 | 741 | 185.7 |
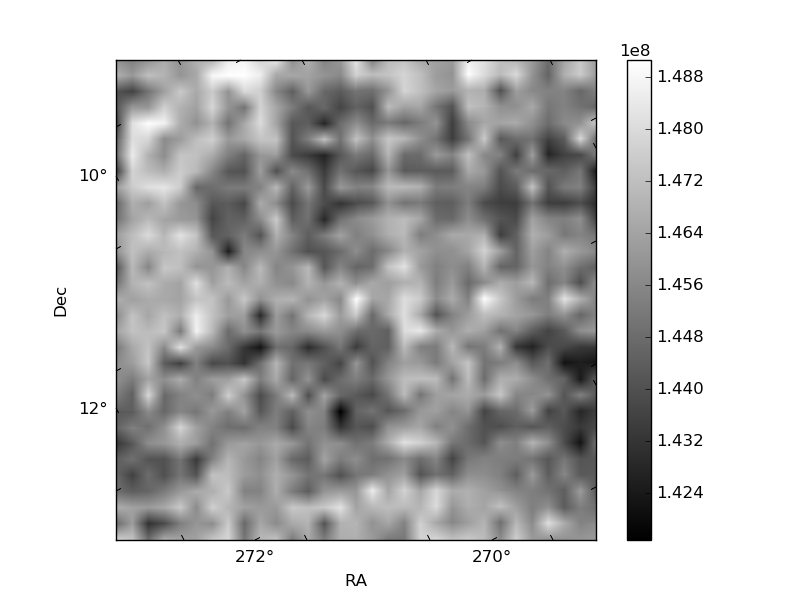
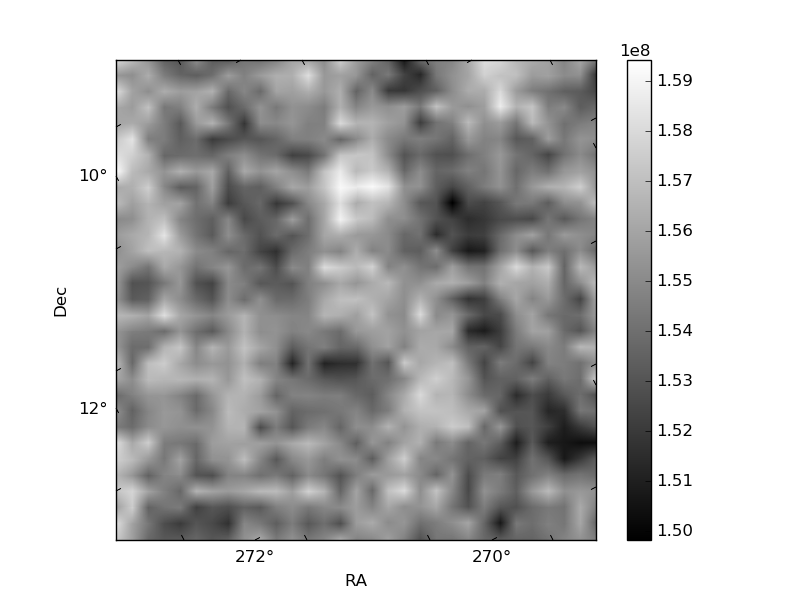
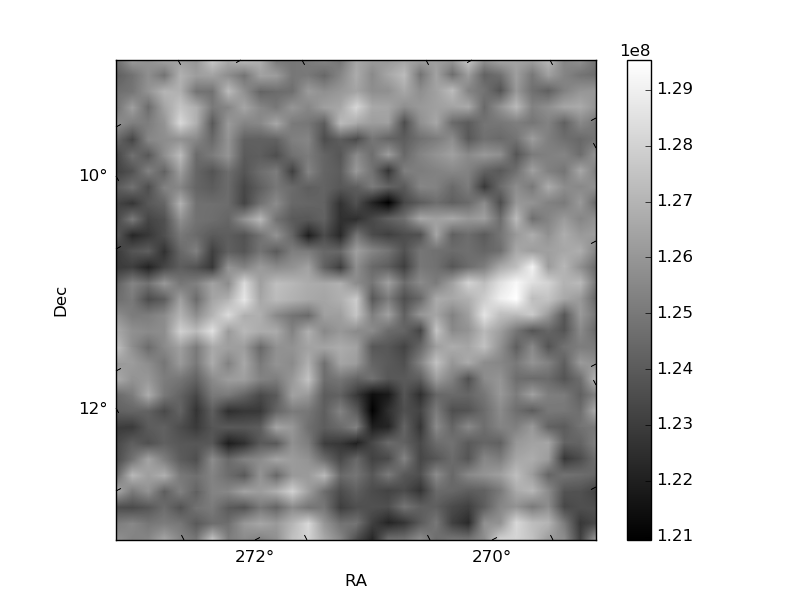
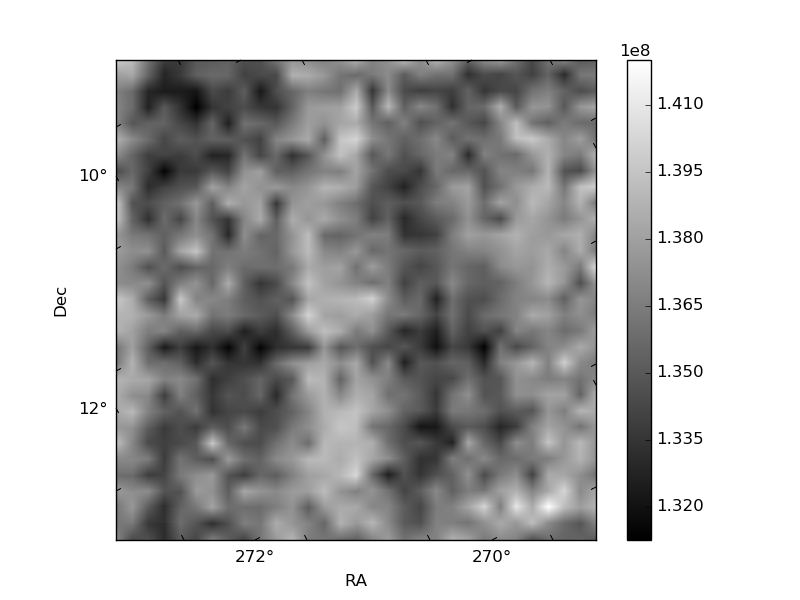
Histogram calculated using DETX and DETY for each event in the final _common_clean file
| Quadrant A | 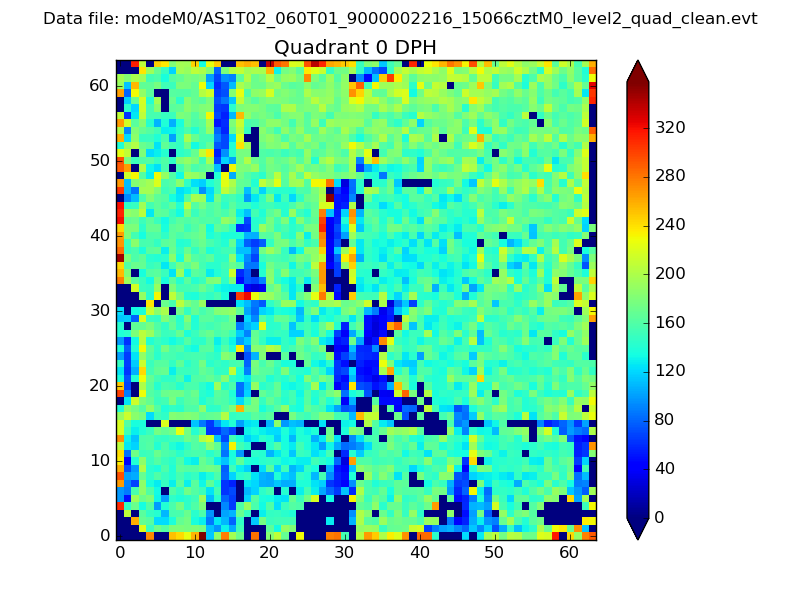 |
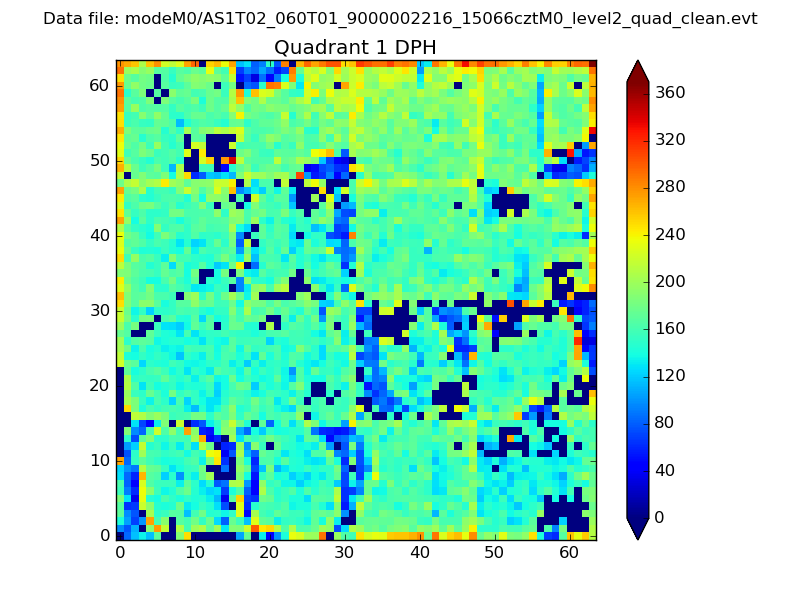 |
Quadrant B |
|---|---|---|---|
| Quadrant D | 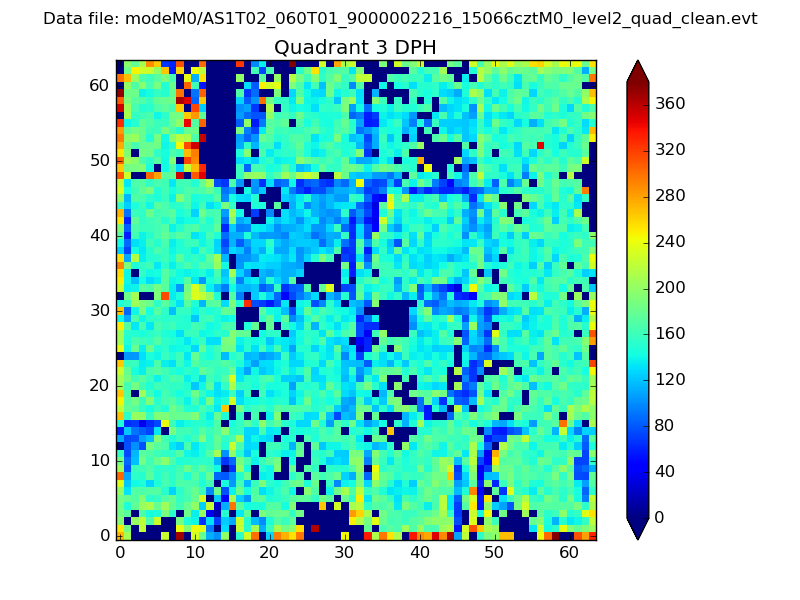 |
 |
Quadrant C |
| Plot type | Count rate plots | Images |
|---|---|---|
| Comparison with Poisson distribution Blue bars denote a histogram of data divided into 1 sec bins. Red curve is a Poisson curve with rate = median count rate of data. |
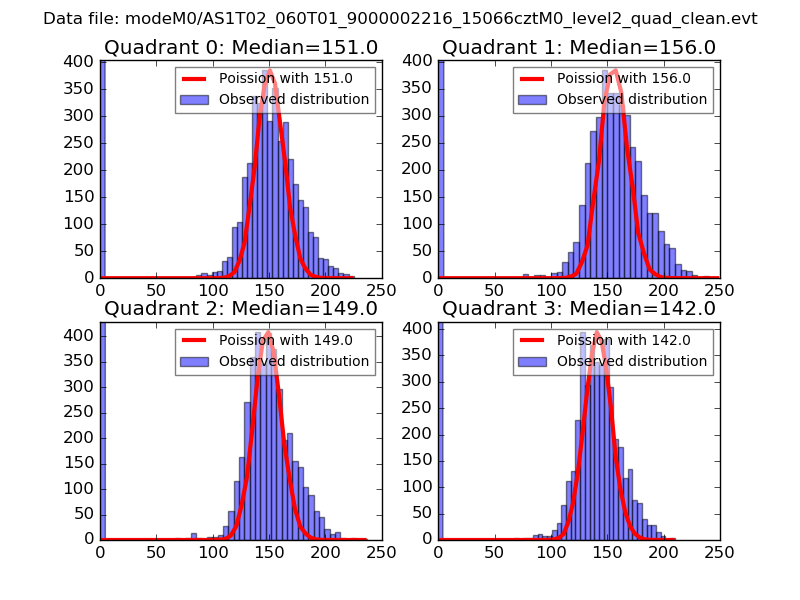 |
 |
| Quadrant-wise count rates Data is divided into 100 sec bins |
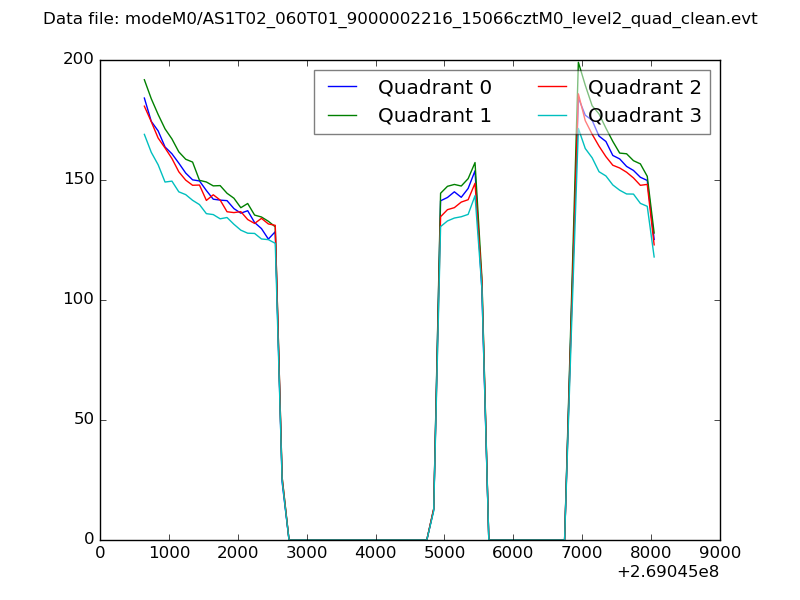 |
|
| Module-wise count rates for Quadrant A Data is divided into 100 sec bins |
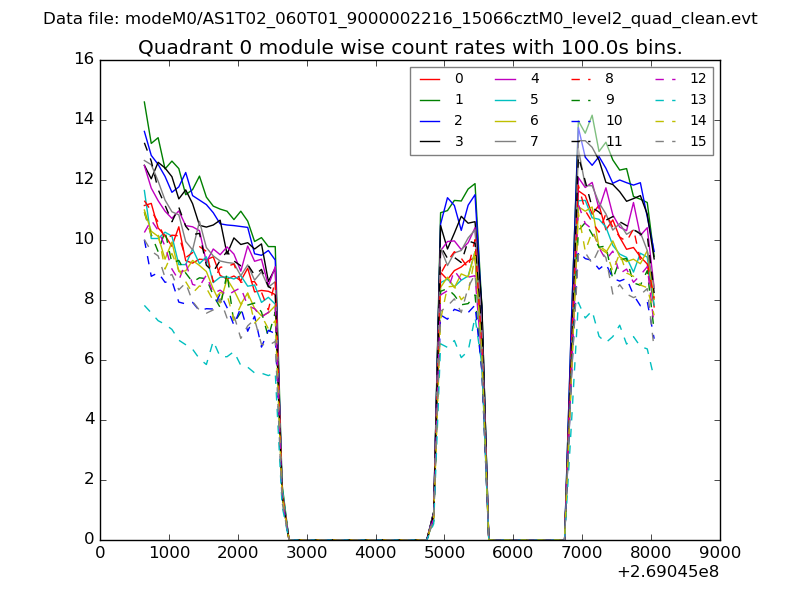 |
 |
| Module-wise count rates for Quadrant B Data is divided into 100 sec bins |
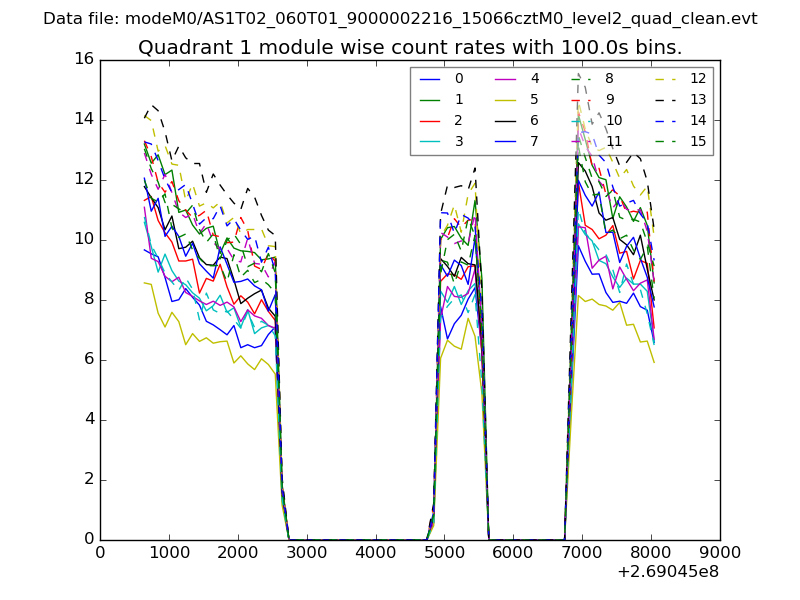 |
 |
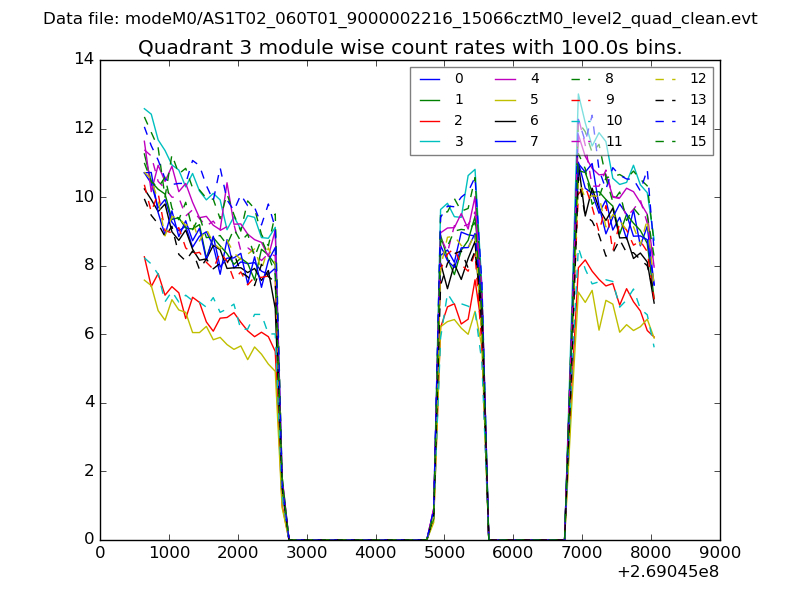
| Module-wise count rates for Quadrant C Data is divided into 100 sec bins |
 |
 |
| Module-wise count rates for Quadrant D Data is divided into 100 sec bins |
 |
 |
| Parameter | Plot |
|---|---|
| CZT HV Monitor | 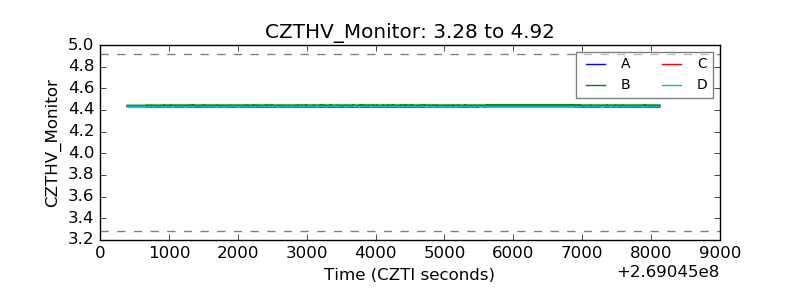 |
| D_VDD | 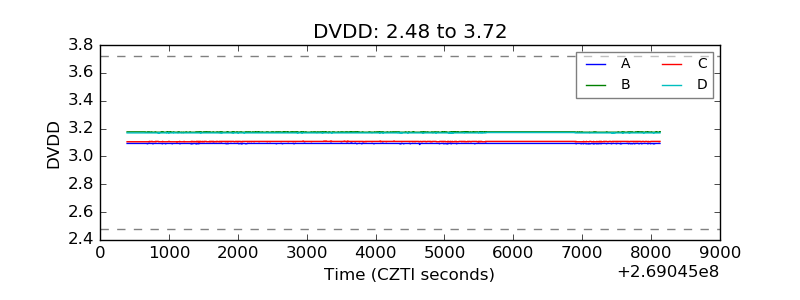 |
| Temperature 1 | 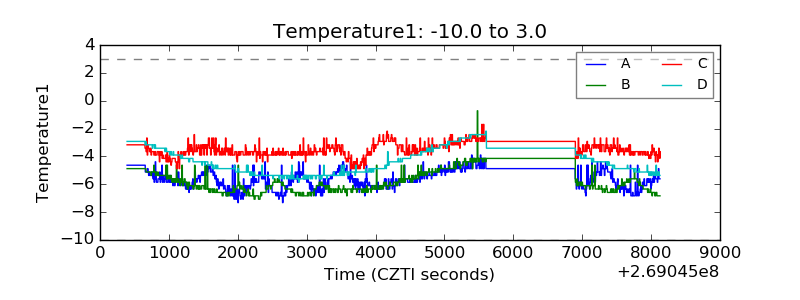 |
| Veto HV Monitor | 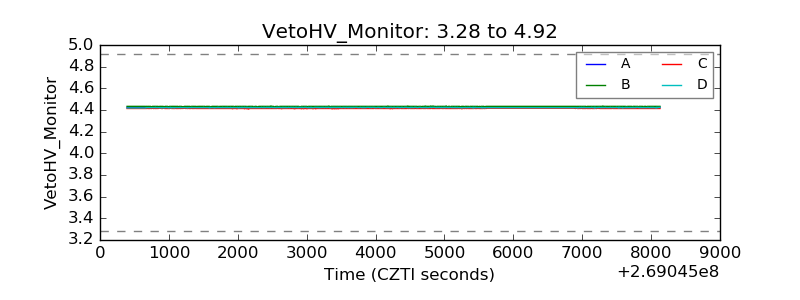 |
| Veto LLD | 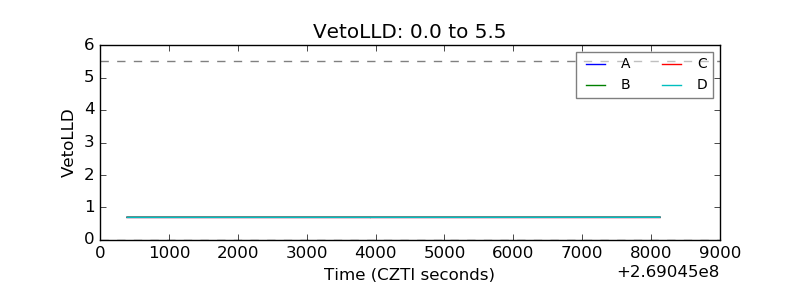 |
| Alpha Counter | 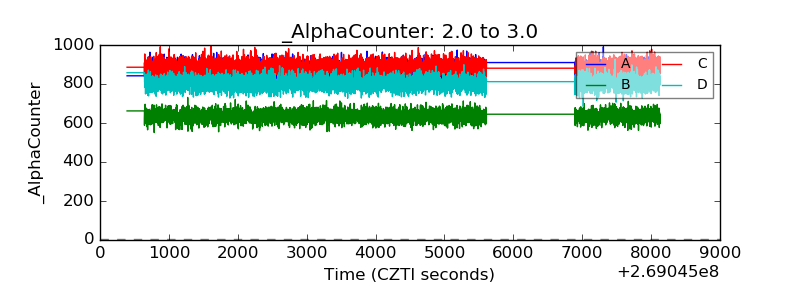 |
| _CPM_Rate | 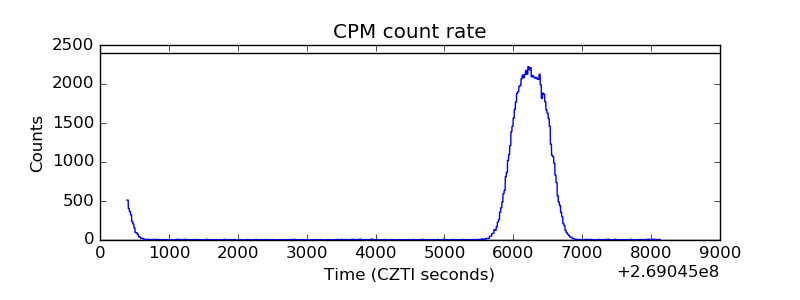 |
| CZT Counter |  |
| +2.5 Volts monitor |  |
| +5 Volts monitor | 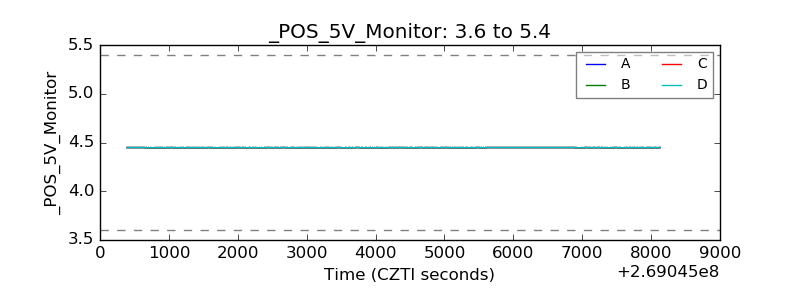 |
| _ROLL_ROT | 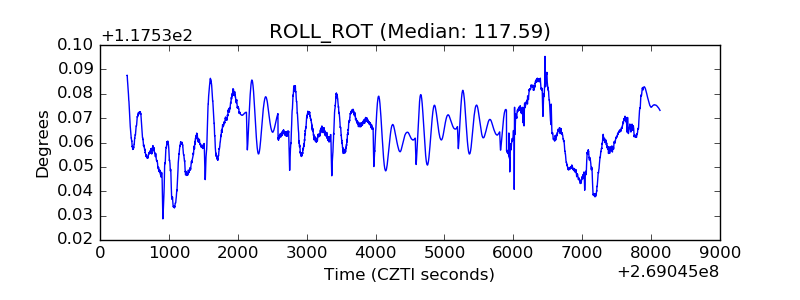 |
| _Roll_DEC | 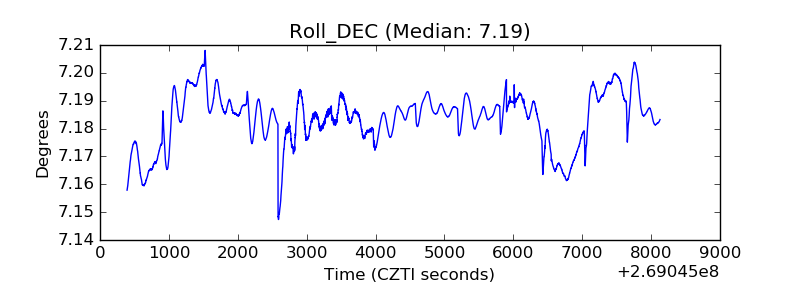 |
| _Roll_RA |  |
| Veto Counter | 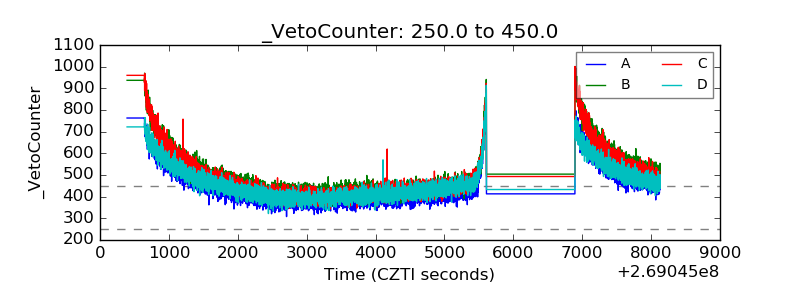 |