| Param | Original file | Final file |
|---|---|---|
| Filename | modeM0/AS1T02_060T01_9000002216_15067cztM0_level2.evt | modeM0/AS1T02_060T01_9000002216_15067cztM0_level2_quad_clean.evt |
| Size (bytes) | 474,647,040 | 92,779,200 |
| Size | 452.7 MB | 88.5 MB |
| Events in quadrant A | 3,354,871 | 603,119 |
| Events in quadrant B | 4,006,556 | 626,156 |
| Events in quadrant C | 3,601,253 | 590,914 |
| Events in quadrant D | 2,993,176 | 558,704 |
| Mode M0 | |||
|---|---|---|---|
| Quadrant | BADHDUFLAG | Total packets | Discarded packets |
| A | 0 | 13682 | 3 |
| B | 0 | 15739 | 2 |
| C | 0 | 14674 | 2 |
| D | 0 | 12977 | 2 |
| Mode M9 | |||
|---|---|---|---|
| Quadrant | BADHDUFLAG | Total packets | Discarded packets |
| A | 0 | 20 | 0 |
| B | 0 | 20 | 0 |
| C | 0 | 20 | 0 |
| D | 0 | 21 | 0 |
| Mode SS | |||
|---|---|---|---|
| Quadrant | BADHDUFLAG | Total packets | Discarded packets |
| A | 0 | 124 | 0 |
| B | 0 | 124 | 0 |
| C | 0 | 124 | 0 |
| D | 0 | 124 | 0 |
| Quadrant | Total seconds | Saturated seconds | Saturation percentage |
|---|---|---|---|
| A | 6178 | 37 | 0.598899% |
| B | 6178 | 114 | 1.845257% |
| C | 6178 | 22 | 0.356102% |
| D | 6178 | 23 | 0.372289% |
Noise dominated data is calculated using 1-second bins in cleaned event files. If a bin has >2000 counts, and if more than 50% of those come from <1% of pixels, then it is considered to be noise-dominated and hence unusable.
| Quadrant | # 1 sec bins | Bins with >0 counts | Bins with >2000 counts | High rate bins dominated by noise | Noise dominated (total time) | Noise dominated (detector-on time) | Marked lightcurve |
|---|---|---|---|---|---|---|---|
| A | 7524 | 6180 | 0 | 0 | 0.00% | 0.00% | 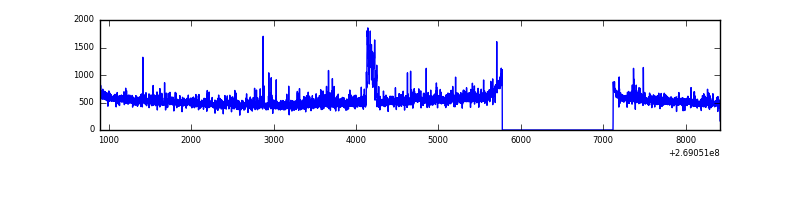 |
| B | 7524 | 6180 | 78 | 78 | 1.04% | 1.26% | 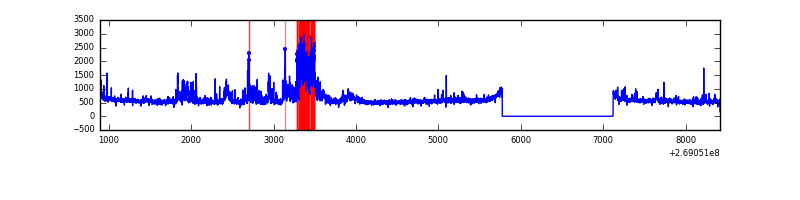 |
| C | 7524 | 6180 | 0 | 0 | 0.00% | 0.00% | 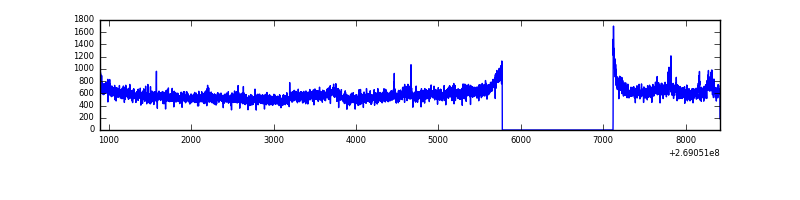 |
| D | 7524 | 6180 | 9 | 9 | 0.12% | 0.15% | 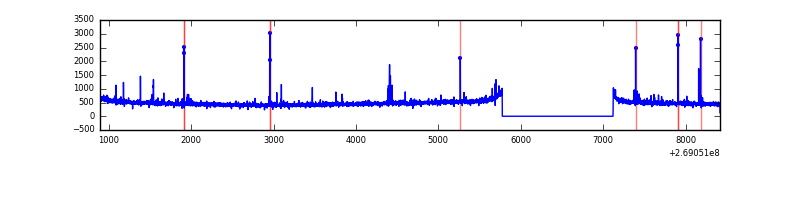 |
Top three noisy pixels from each quadrant. If the there are fewer than three noisy pixels in the level2.evt file, extra rows are filled as -1
| Pixel properties | Quadrant properties | ||||||
|---|---|---|---|---|---|---|---|
| Quadrant | DetID | PixID | Counts | Sigma | Mean | Median | Sigma |
| A | 15 | 239 | 94137 | 581.3 | 804 | 791 | 160.6 |
| A | 1 | 162 | 71529 | 440.51 | 804 | 791 | 160.6 |
| A | 1 | 178 | 37199 | 226.73 | 804 | 791 | 160.6 |
| B | 3 | 64 | 832226 | 5509.66 | 806 | 789 | 150.9 |
| B | 4 | 80 | 19135 | 121.57 | 806 | 789 | 150.9 |
| B | 12 | 111 | 17694 | 112.02 | 806 | 789 | 150.9 |
| C | 3 | 233 | 569554 | 3174.36 | 777 | 785 | 179.2 |
| C | 13 | 61 | 5524 | 26.45 | 777 | 785 | 179.2 |
| C | 3 | 232 | 2779 | 11.13 | 777 | 785 | 179.2 |
| D | 13 | 249 | 60144 | 317.76 | 767 | 748 | 186.9 |
| D | 10 | 70 | 25825 | 134.16 | 767 | 748 | 186.9 |
| D | 2 | 234 | 18550 | 95.24 | 767 | 748 | 186.9 |
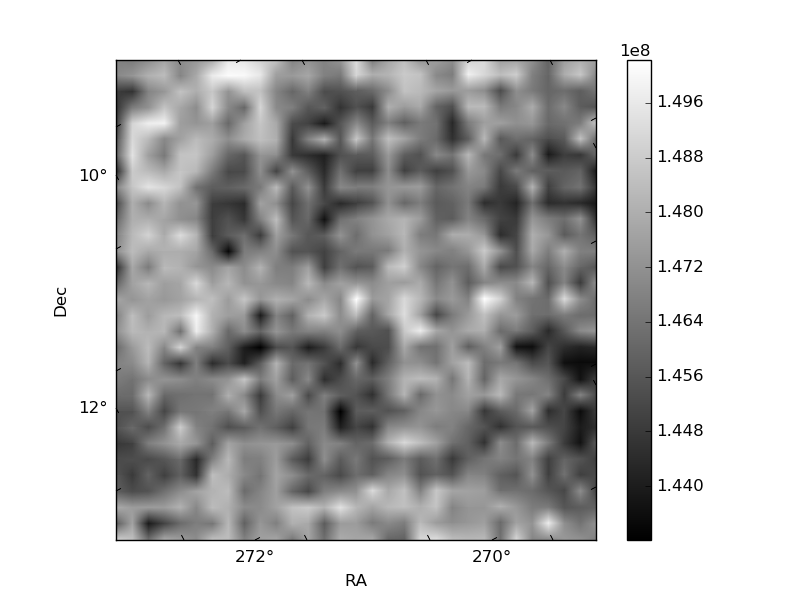
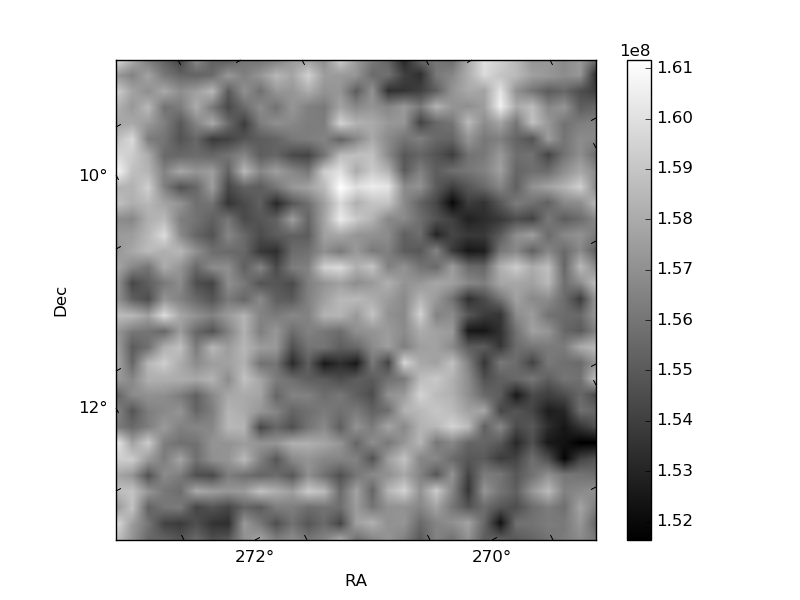
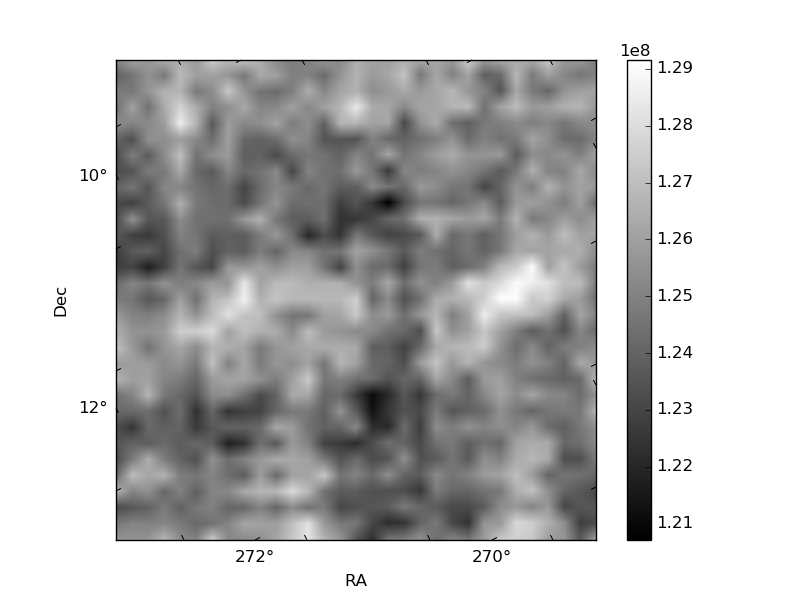
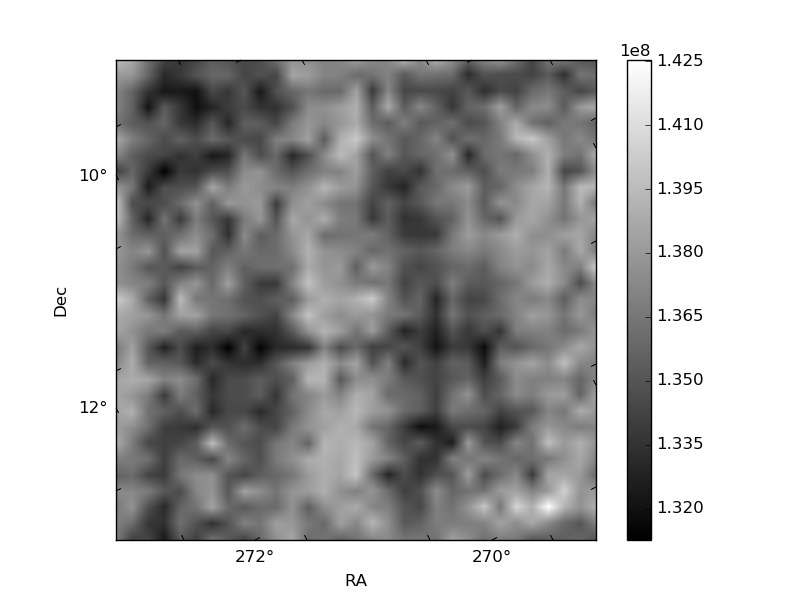
Histogram calculated using DETX and DETY for each event in the final _common_clean file
| Quadrant A | 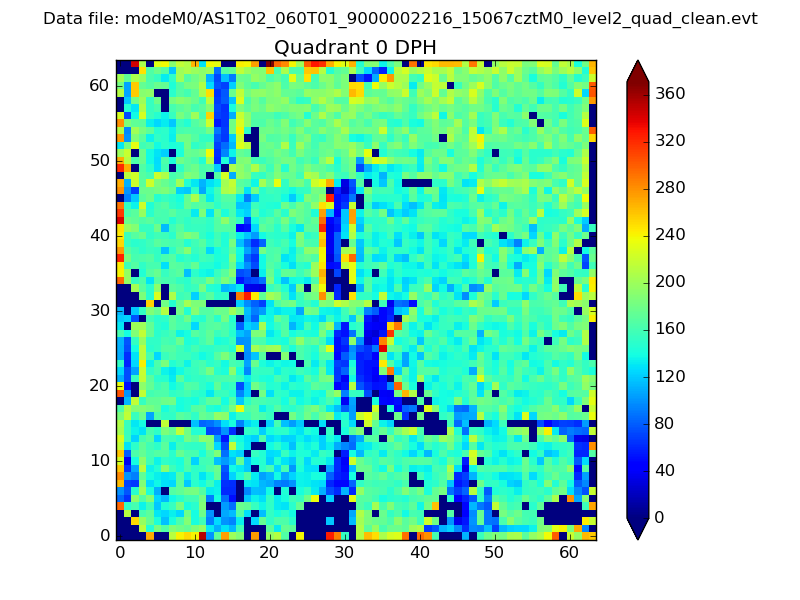 |
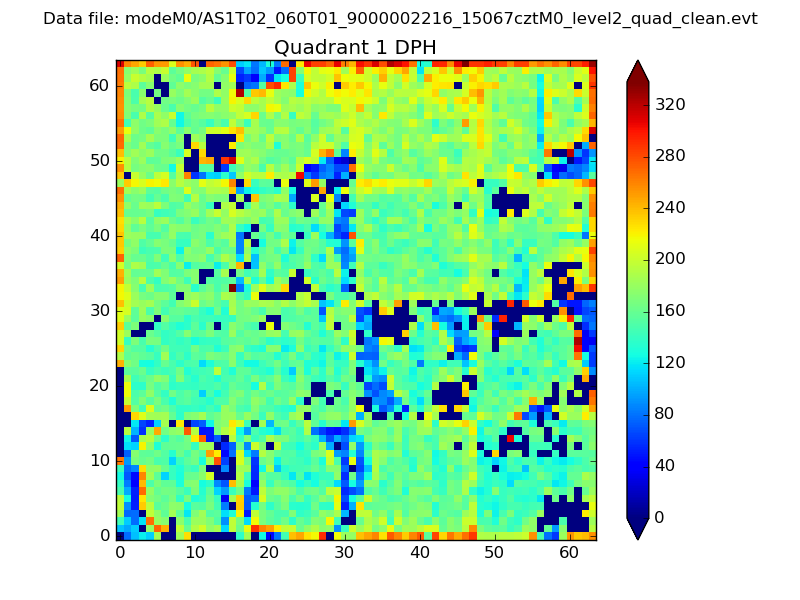 |
Quadrant B |
|---|---|---|---|
| Quadrant D | 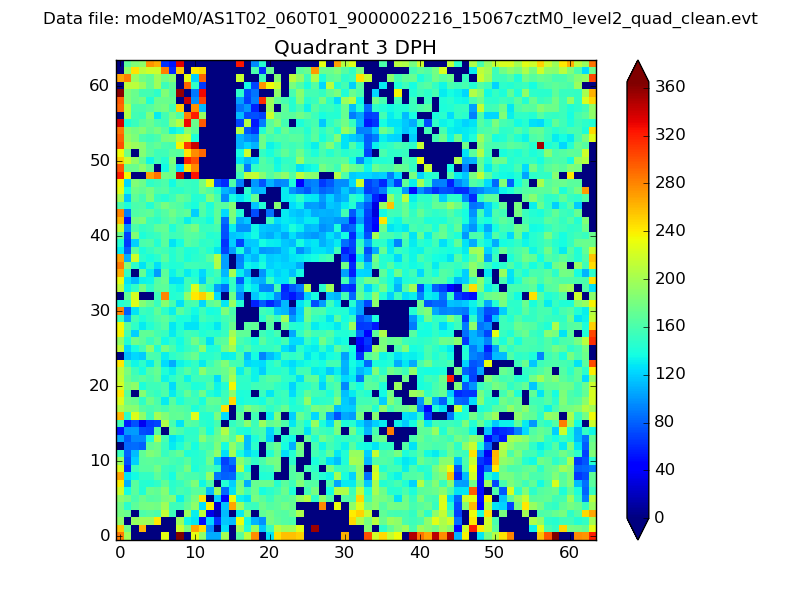 |
 |
Quadrant C |
| Plot type | Count rate plots | Images |
|---|---|---|
| Comparison with Poisson distribution Blue bars denote a histogram of data divided into 1 sec bins. Red curve is a Poisson curve with rate = median count rate of data. |
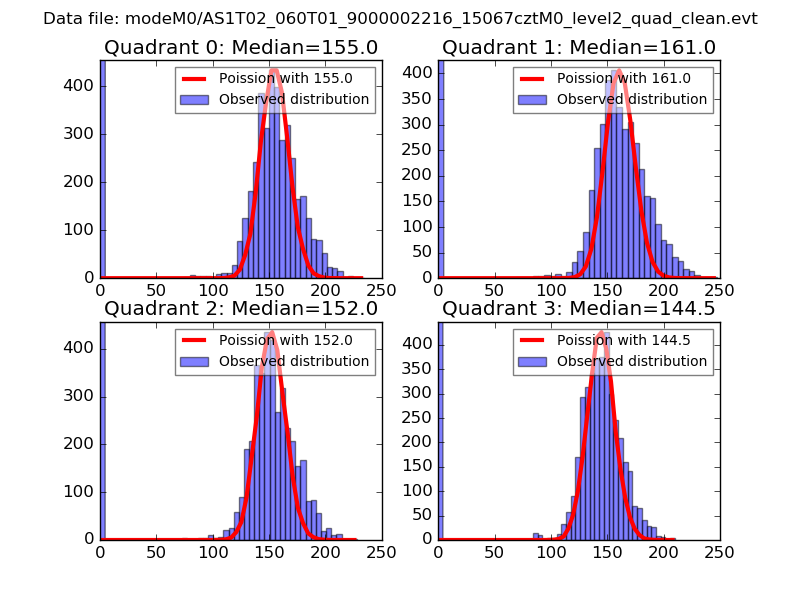 |
 |
| Quadrant-wise count rates Data is divided into 100 sec bins |
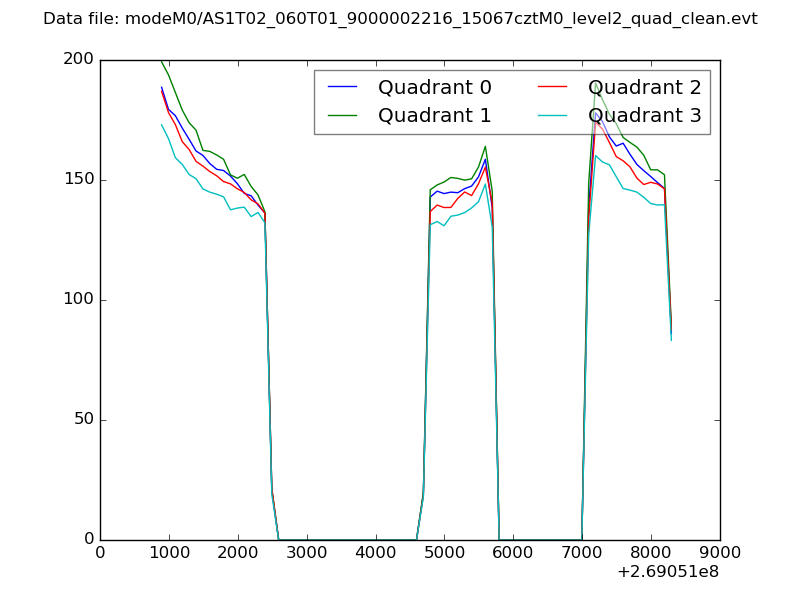 |
|
| Module-wise count rates for Quadrant A Data is divided into 100 sec bins |
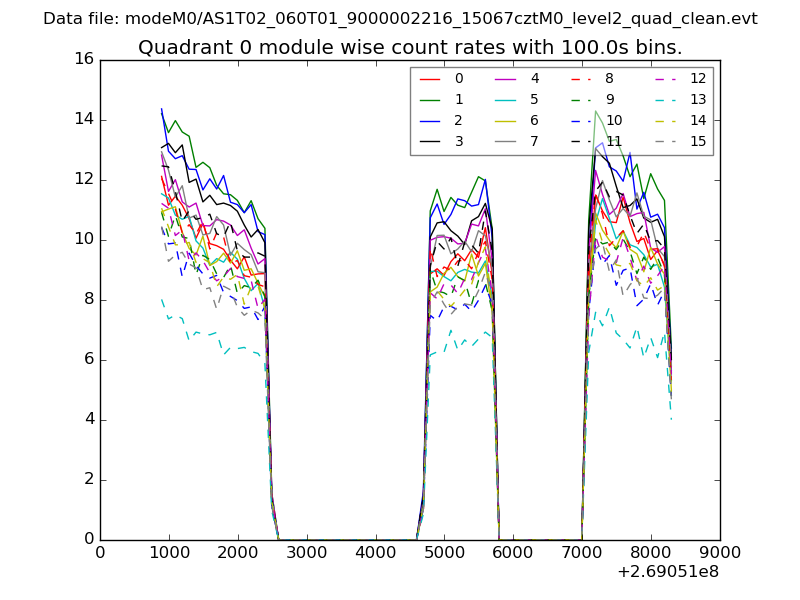 |
 |
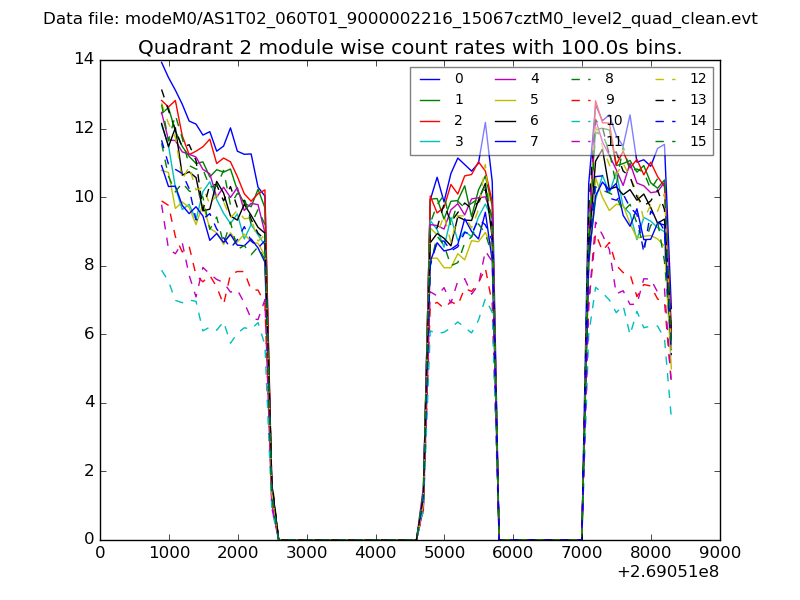
| Module-wise count rates for Quadrant B Data is divided into 100 sec bins |
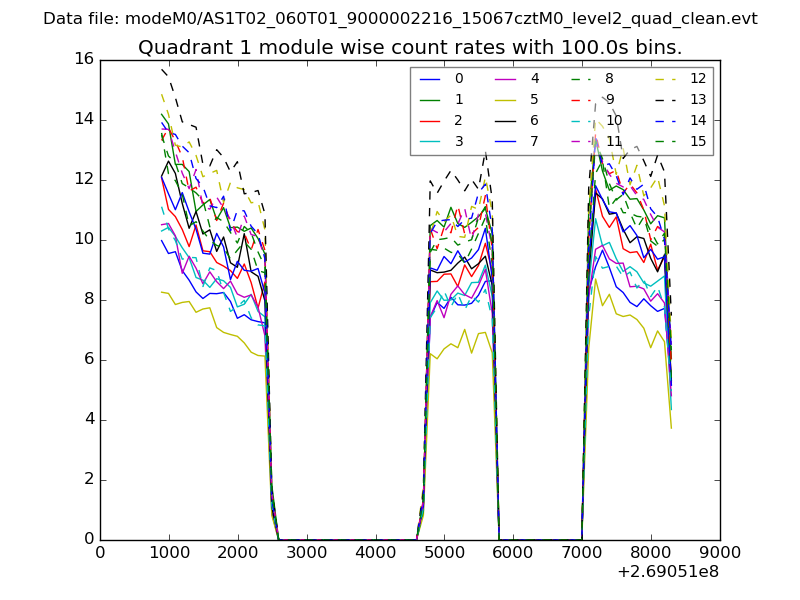 |
 |
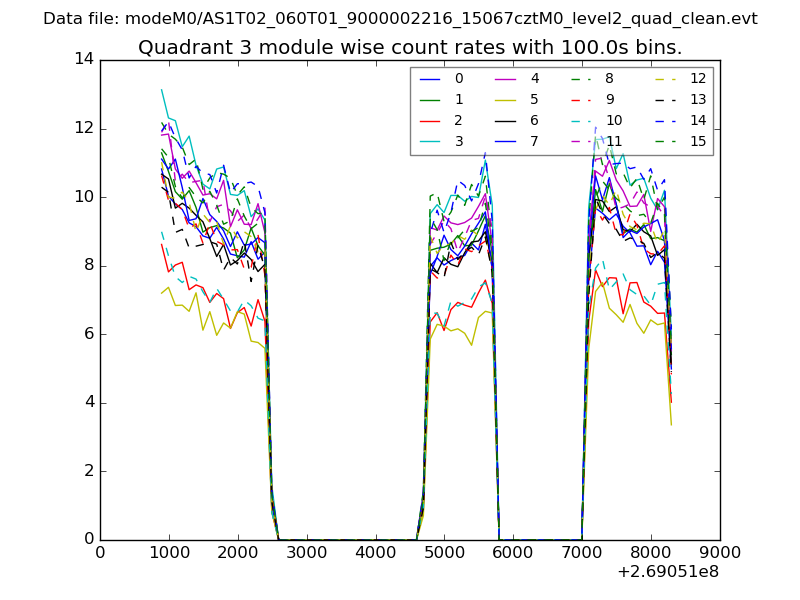
| Module-wise count rates for Quadrant C Data is divided into 100 sec bins |
 |
 |
| Module-wise count rates for Quadrant D Data is divided into 100 sec bins |
 |
 |
| Parameter | Plot |
|---|---|
| CZT HV Monitor | 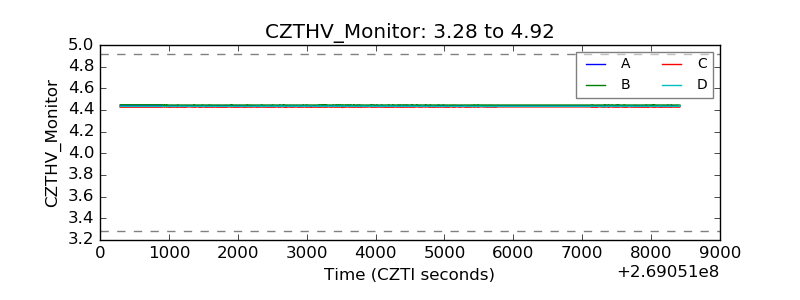 |
| D_VDD | 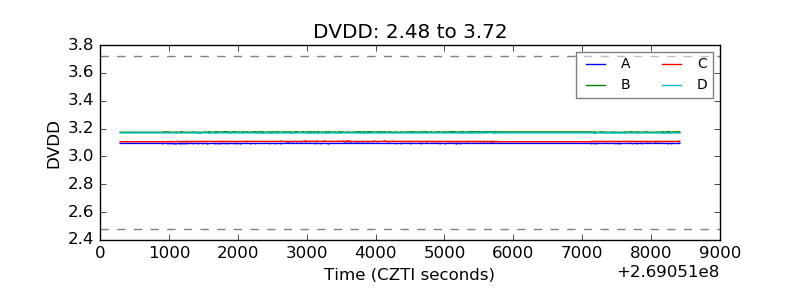 |
| Temperature 1 | 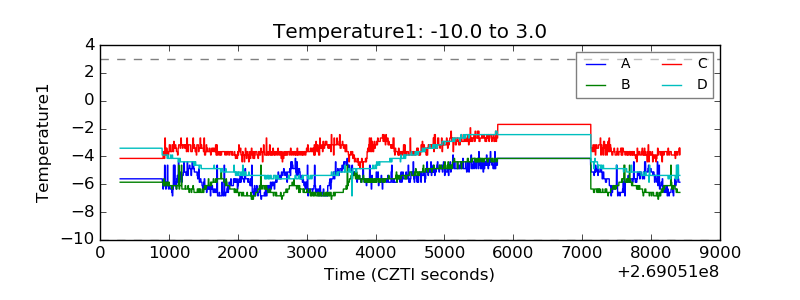 |
| Veto HV Monitor | 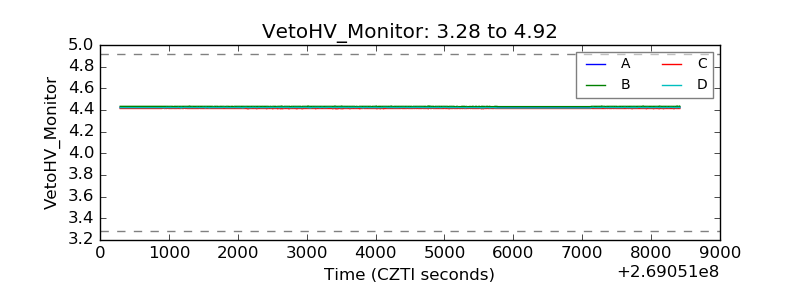 |
| Veto LLD | 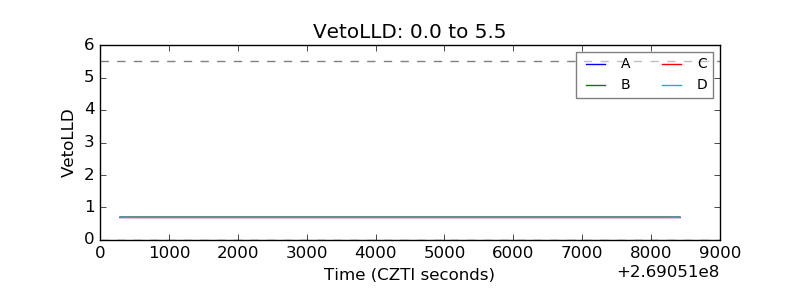 |
| Alpha Counter | 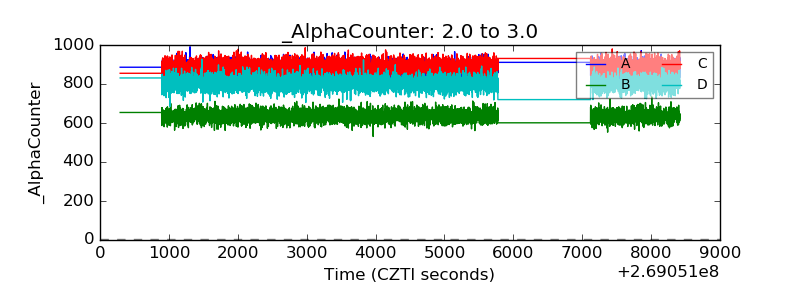 |
| _CPM_Rate | 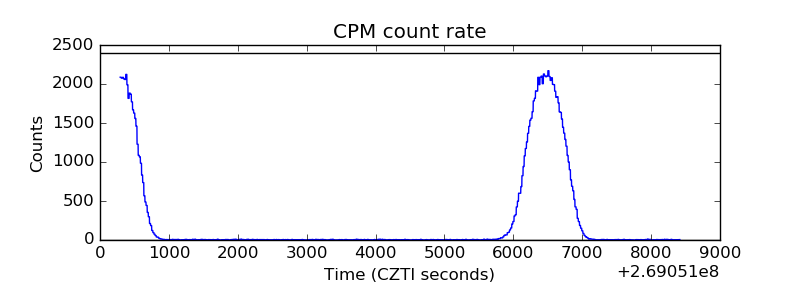 |
| CZT Counter | 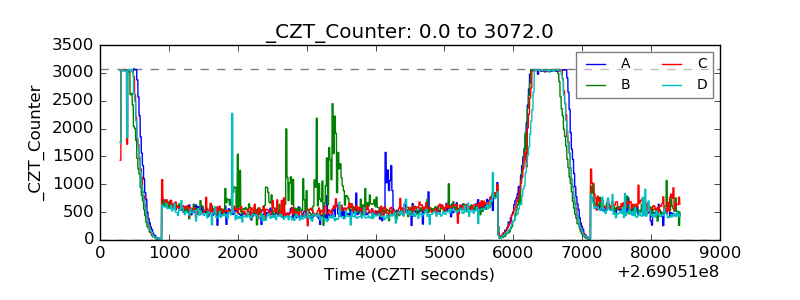 |
| +2.5 Volts monitor |  |
| +5 Volts monitor |  |
| _ROLL_ROT | 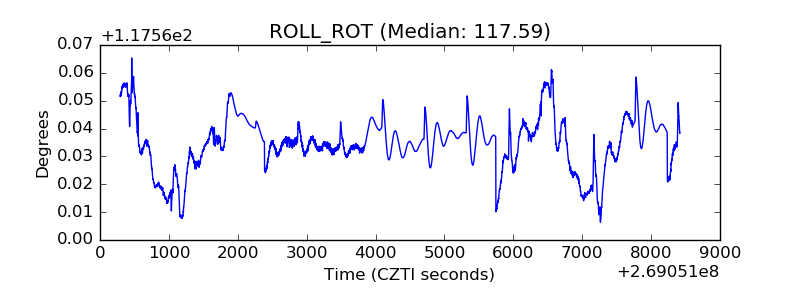 |
| _Roll_DEC | 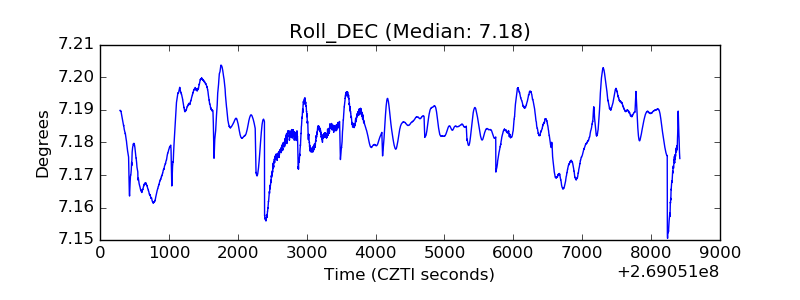 |
| _Roll_RA | 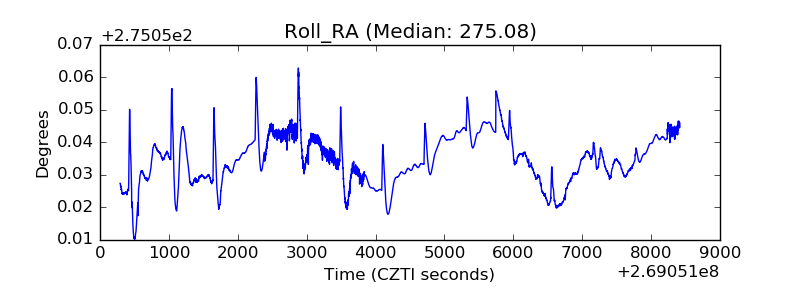 |
| Veto Counter | 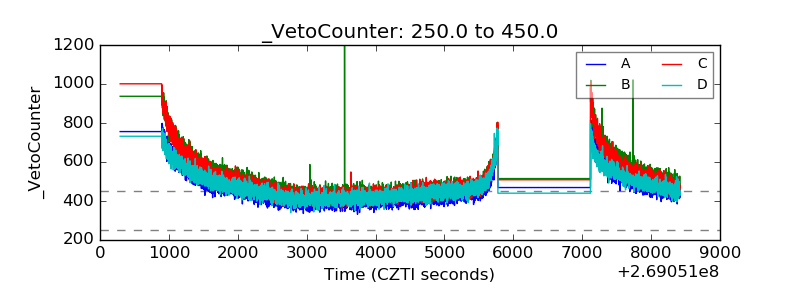 |