| Param | Original file | Final file |
|---|---|---|
| Filename | modeM0/AS1T02_060T01_9000002216_15068cztM0_level2.evt | modeM0/AS1T02_060T01_9000002216_15068cztM0_level2_quad_clean.evt |
| Size (bytes) | 435,280,320 | 76,325,760 |
| Size | 415.1 MB | 72.8 MB |
| Events in quadrant A | 3,046,768 | 482,931 |
| Events in quadrant B | 3,238,772 | 501,293 |
| Events in quadrant C | 3,635,890 | 472,514 |
| Events in quadrant D | 2,869,557 | 451,466 |
| Mode M0 | |||
|---|---|---|---|
| Quadrant | BADHDUFLAG | Total packets | Discarded packets |
| A | 0 | 12435 | 2 |
| B | 0 | 13114 | 1 |
| C | 0 | 14836 | 1 |
| D | 0 | 12377 | 1 |
| Mode M9 | |||
|---|---|---|---|
| Quadrant | BADHDUFLAG | Total packets | Discarded packets |
| A | 0 | 14 | 0 |
| B | 0 | 14 | 0 |
| C | 0 | 14 | 0 |
| D | 0 | 14 | 0 |
| Mode SS | |||
|---|---|---|---|
| Quadrant | BADHDUFLAG | Total packets | Discarded packets |
| A | 0 | 118 | 0 |
| B | 0 | 118 | 0 |
| C | 0 | 118 | 0 |
| D | 0 | 118 | 0 |
| Quadrant | Total seconds | Saturated seconds | Saturation percentage |
|---|---|---|---|
| A | 5762 | 38 | 0.659493% |
| B | 5762 | 49 | 0.850399% |
| C | 5762 | 10 | 0.173551% |
| D | 5762 | 49 | 0.850399% |
Noise dominated data is calculated using 1-second bins in cleaned event files. If a bin has >2000 counts, and if more than 50% of those come from <1% of pixels, then it is considered to be noise-dominated and hence unusable.
| Quadrant | # 1 sec bins | Bins with >0 counts | Bins with >2000 counts | High rate bins dominated by noise | Noise dominated (total time) | Noise dominated (detector-on time) | Marked lightcurve |
|---|---|---|---|---|---|---|---|
| A | 7148 | 5764 | 3 | 3 | 0.04% | 0.05% | 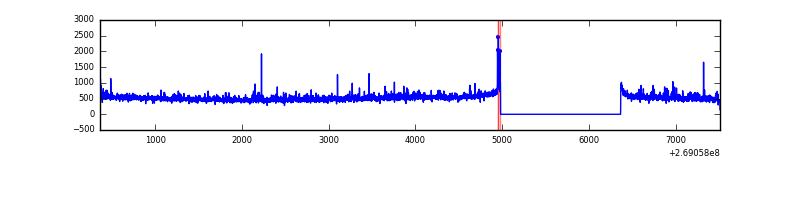 |
| B | 7148 | 5764 | 21 | 21 | 0.29% | 0.36% | 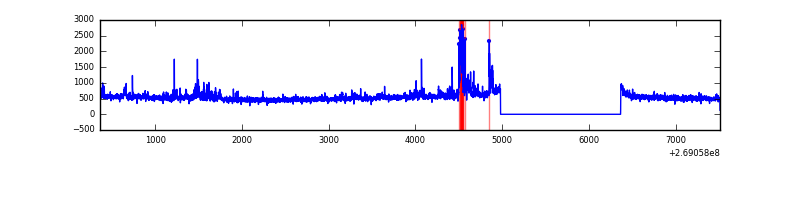 |
| C | 7148 | 5764 | 0 | 0 | 0.00% | 0.00% | 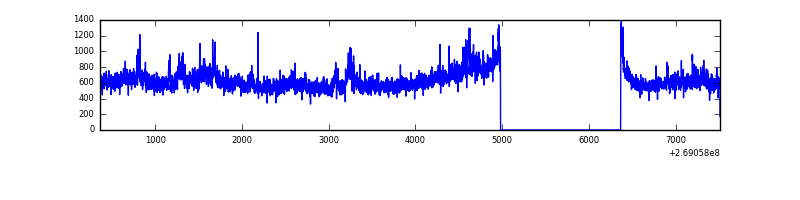 |
| D | 7148 | 5764 | 34 | 34 | 0.48% | 0.59% | 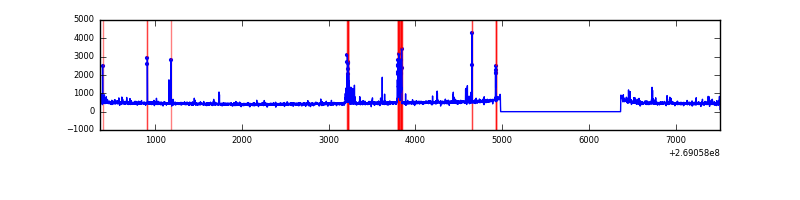 |
Top three noisy pixels from each quadrant. If the there are fewer than three noisy pixels in the level2.evt file, extra rows are filled as -1
| Pixel properties | Quadrant properties | ||||||
|---|---|---|---|---|---|---|---|
| Quadrant | DetID | PixID | Counts | Sigma | Mean | Median | Sigma |
| A | 1 | 162 | 68673 | 456.44 | 741 | 729 | 148.9 |
| A | 4 | 2 | 44740 | 295.66 | 741 | 729 | 148.9 |
| A | 1 | 178 | 32259 | 211.82 | 741 | 729 | 148.9 |
| B | 3 | 64 | 319425 | 2295.19 | 742 | 726 | 138.9 |
| B | 4 | 173 | 17762 | 122.69 | 742 | 726 | 138.9 |
| B | 12 | 111 | 16875 | 116.3 | 742 | 726 | 138.9 |
| C | 3 | 233 | 854461 | 5239.29 | 711 | 717 | 163.0 |
| C | 13 | 61 | 5018 | 26.39 | 711 | 717 | 163.0 |
| C | 3 | 232 | 4672 | 24.27 | 711 | 717 | 163.0 |
| D | 10 | 70 | 140280 | 811.35 | 703 | 684 | 172.1 |
| D | 13 | 249 | 63099 | 362.76 | 703 | 684 | 172.1 |
| D | 2 | 234 | 16807 | 93.71 | 703 | 684 | 172.1 |
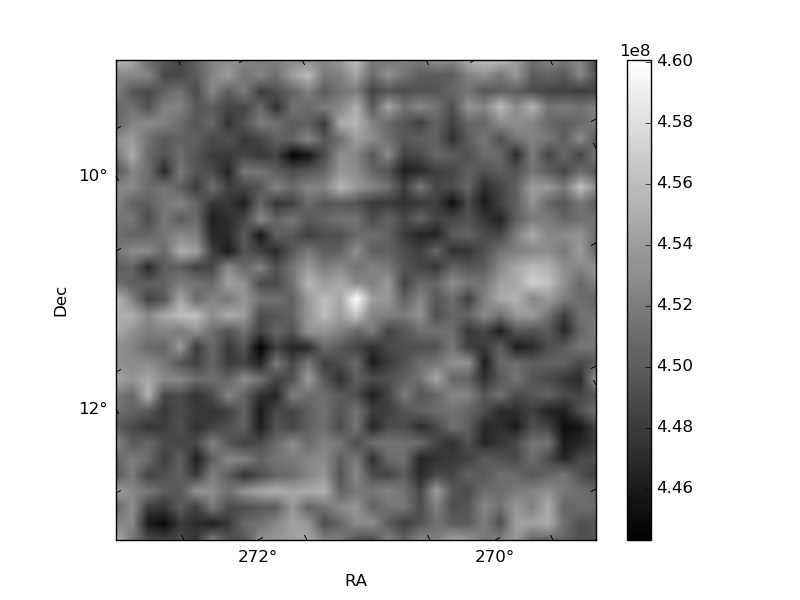
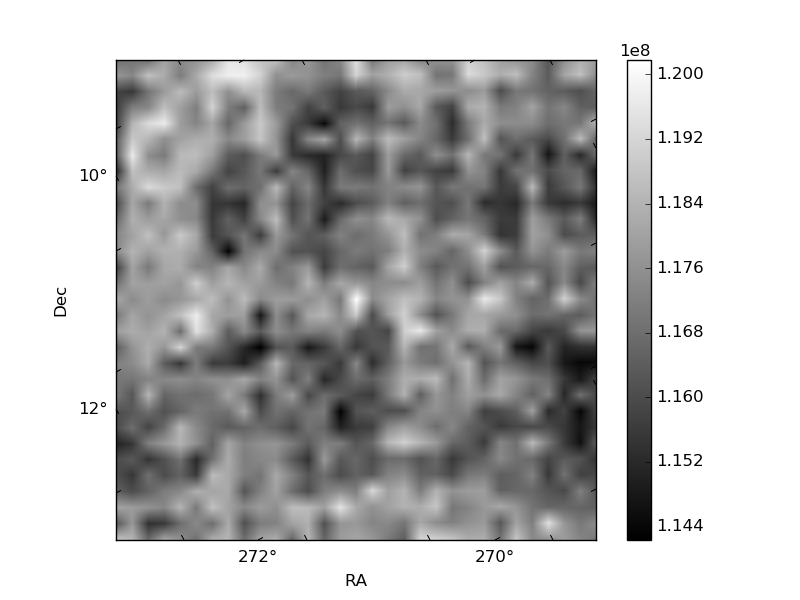
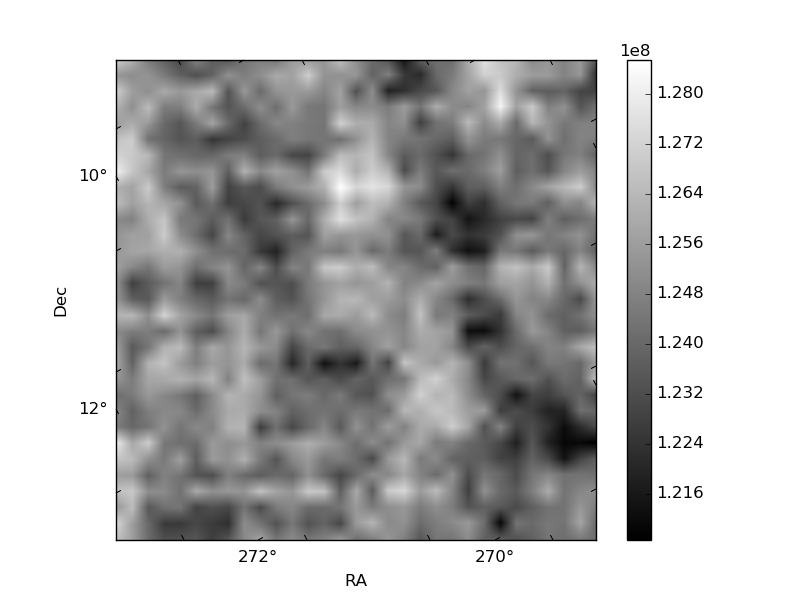
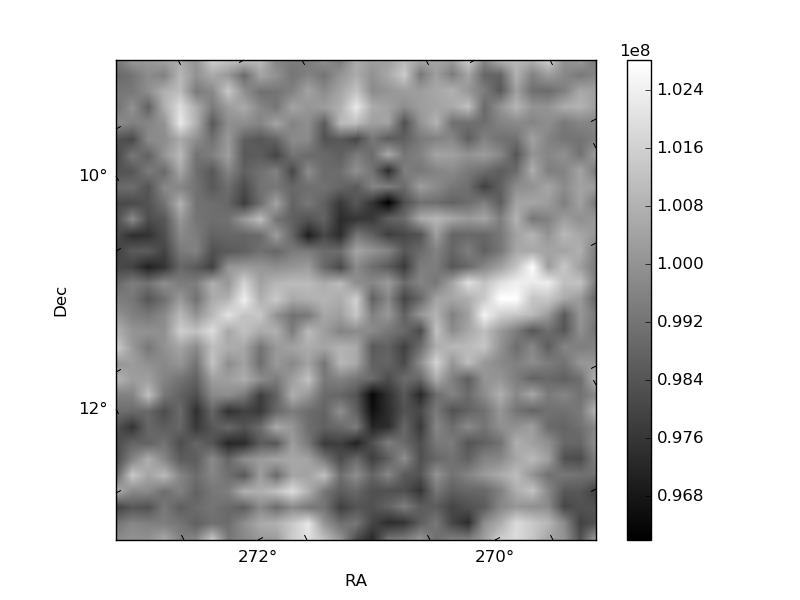
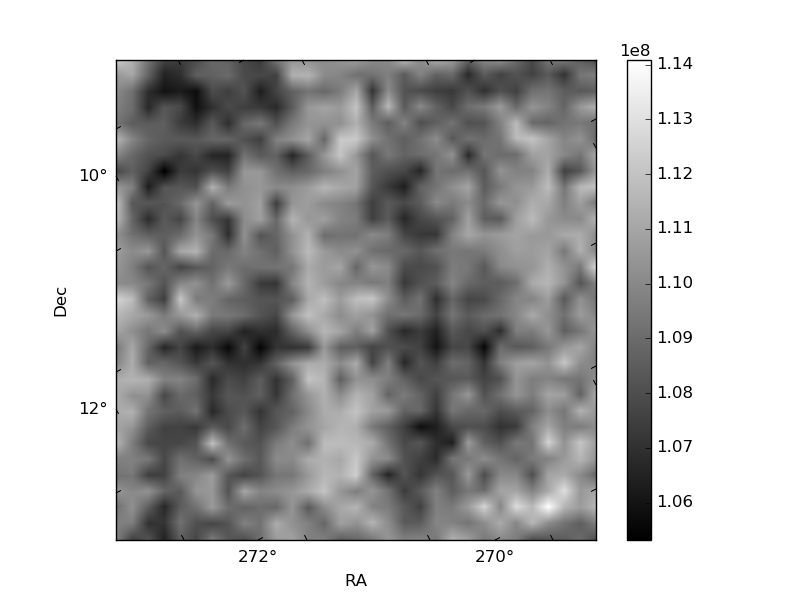
Histogram calculated using DETX and DETY for each event in the final _common_clean file
| Quadrant A | 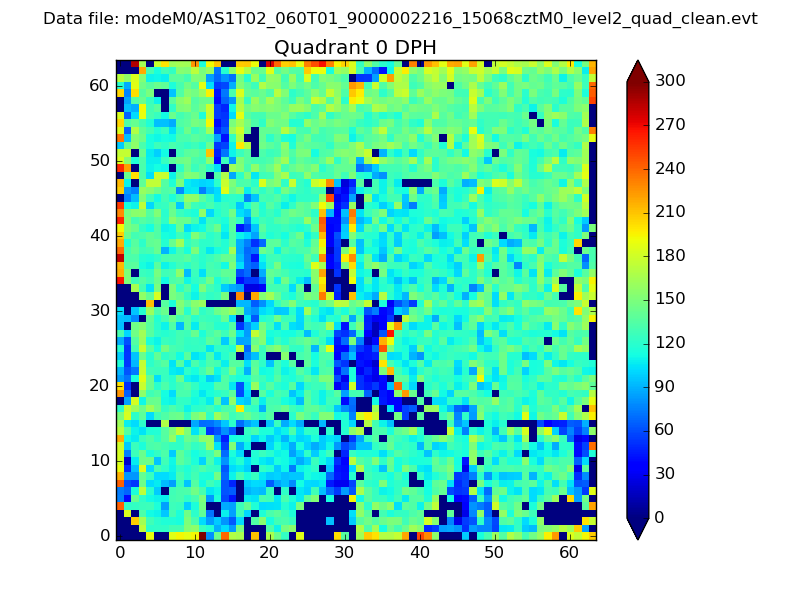 |
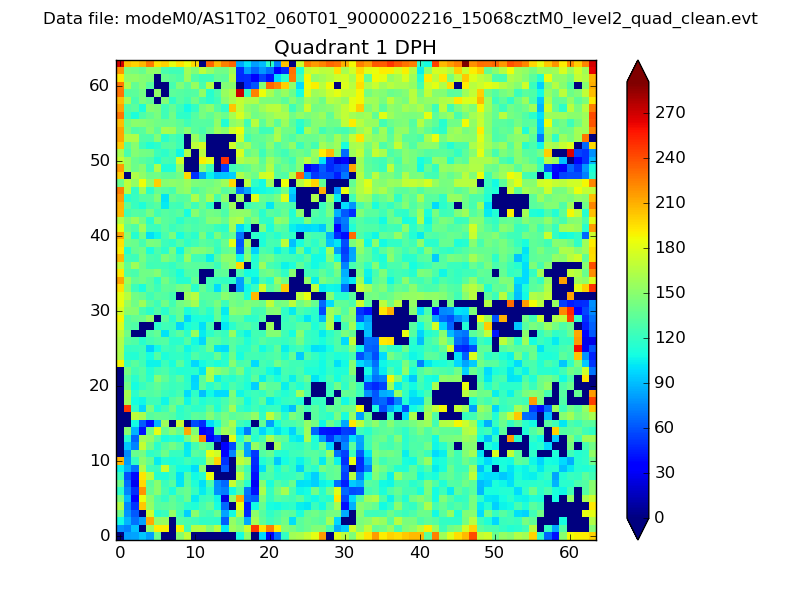 |
Quadrant B |
|---|---|---|---|
| Quadrant D |  |
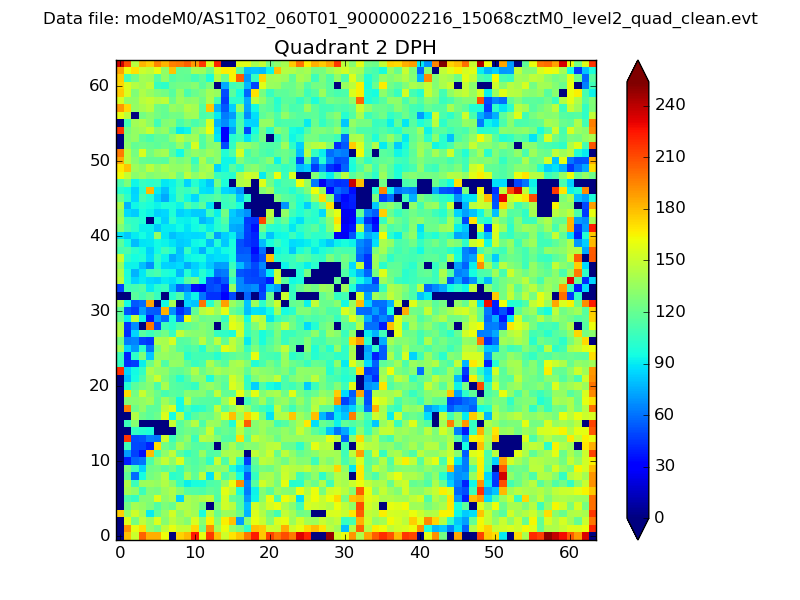 |
Quadrant C |
| Plot type | Count rate plots | Images |
|---|---|---|
| Comparison with Poisson distribution Blue bars denote a histogram of data divided into 1 sec bins. Red curve is a Poisson curve with rate = median count rate of data. |
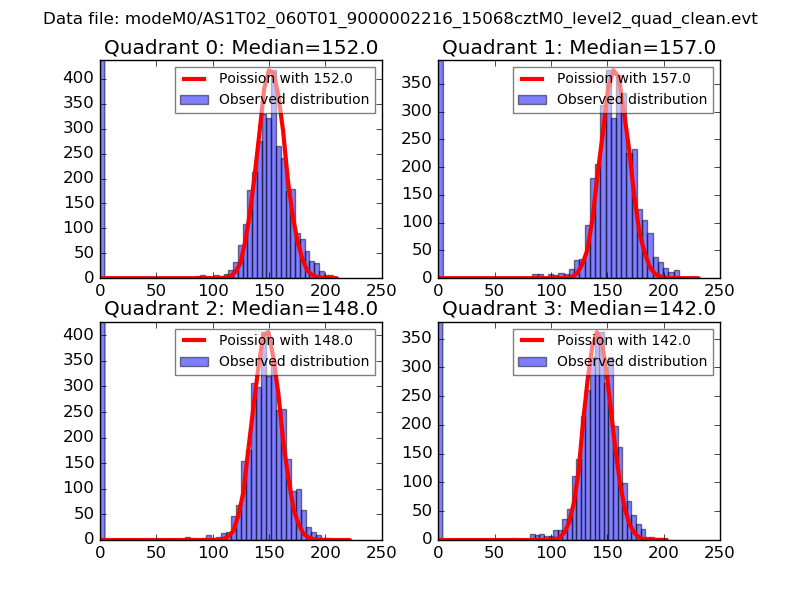 |
 |
| Quadrant-wise count rates Data is divided into 100 sec bins |
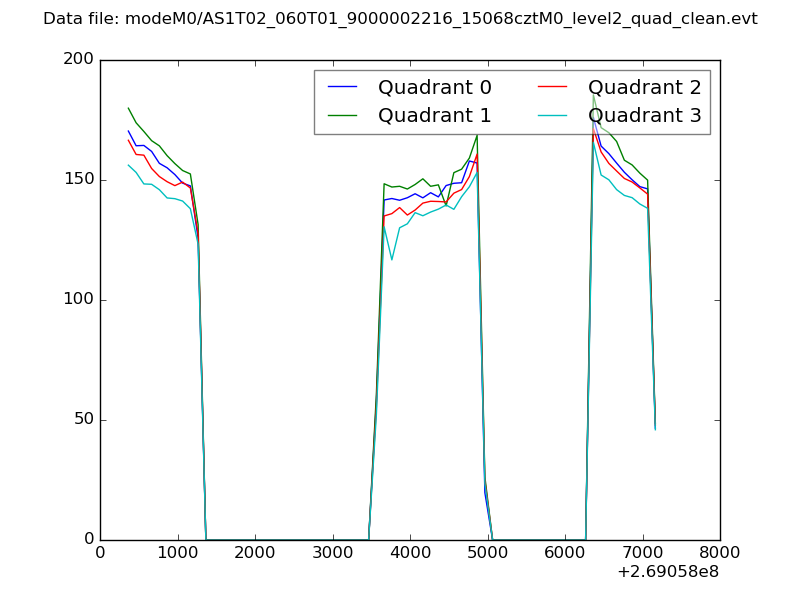 |
|
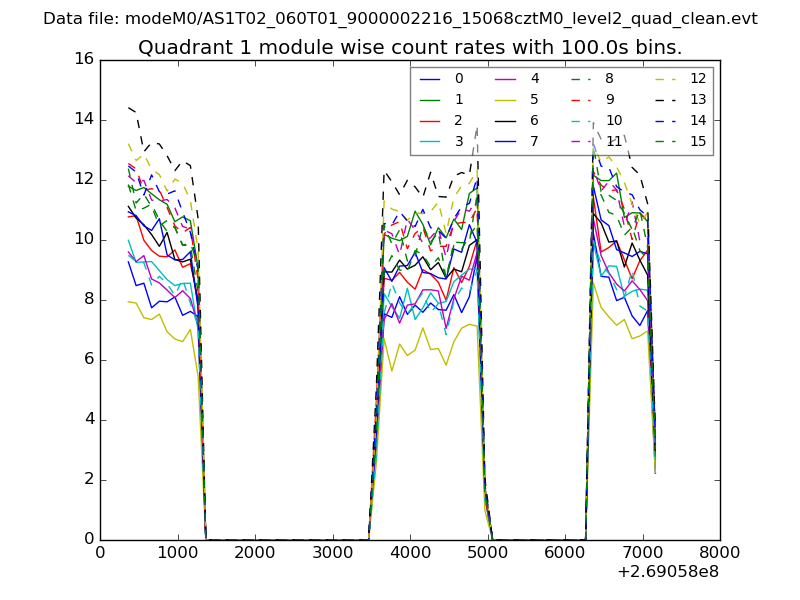
| Module-wise count rates for Quadrant A Data is divided into 100 sec bins |
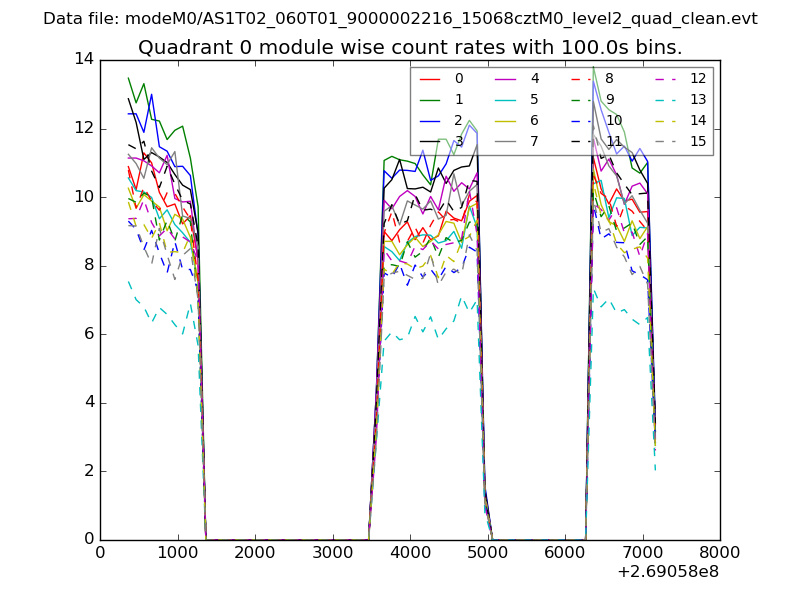 |
 |
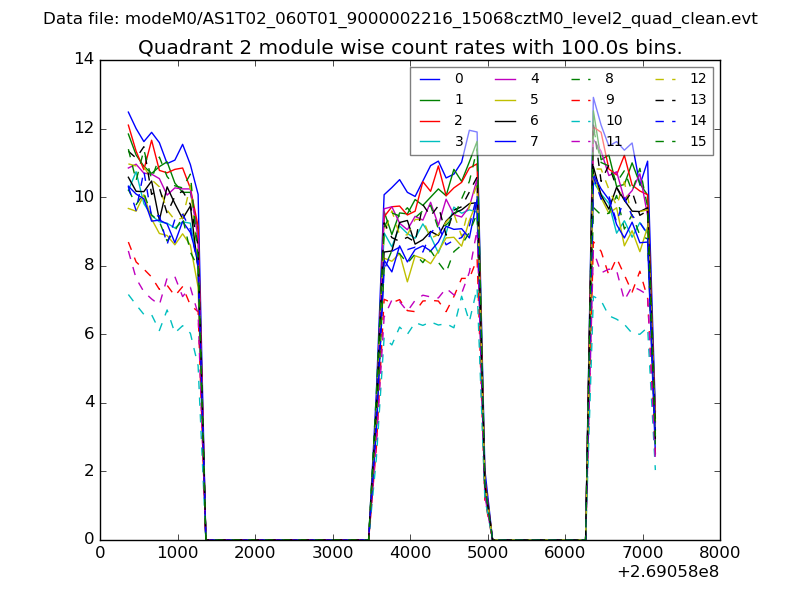
| Module-wise count rates for Quadrant B Data is divided into 100 sec bins |
 |
 |
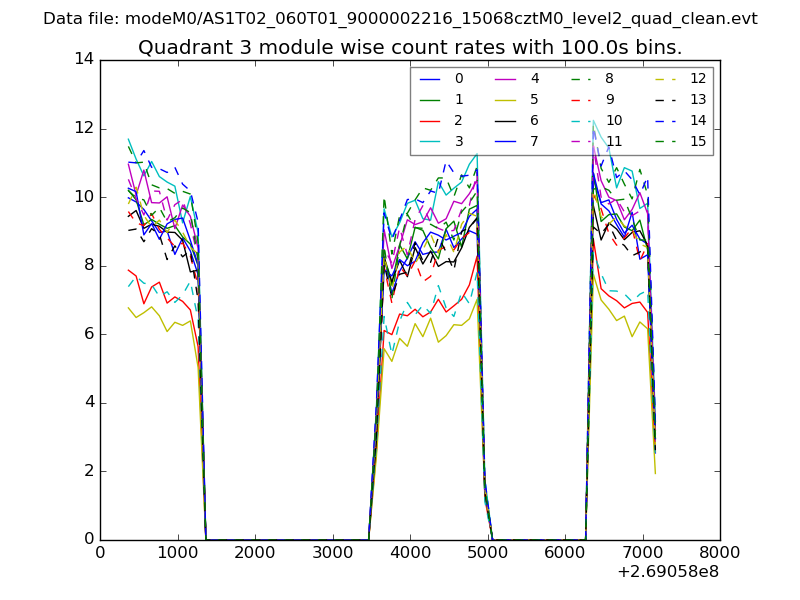
| Module-wise count rates for Quadrant C Data is divided into 100 sec bins |
 |
 |
| Module-wise count rates for Quadrant D Data is divided into 100 sec bins |
 |
 |
| Parameter | Plot |
|---|---|
| CZT HV Monitor |  |
| D_VDD | 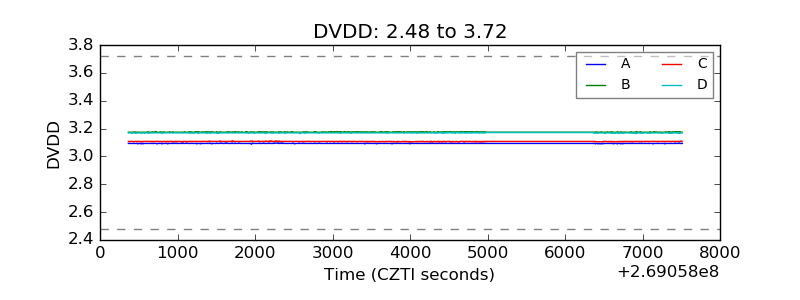 |
| Temperature 1 | 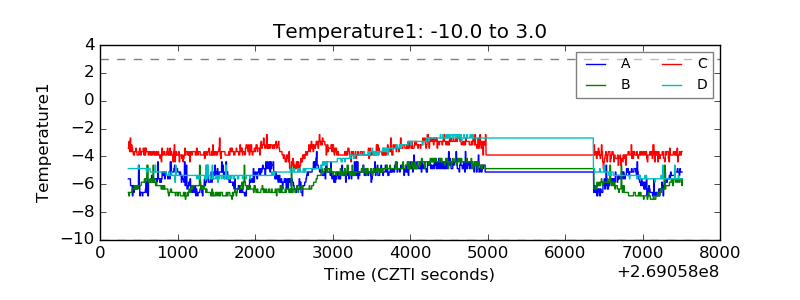 |
| Veto HV Monitor | 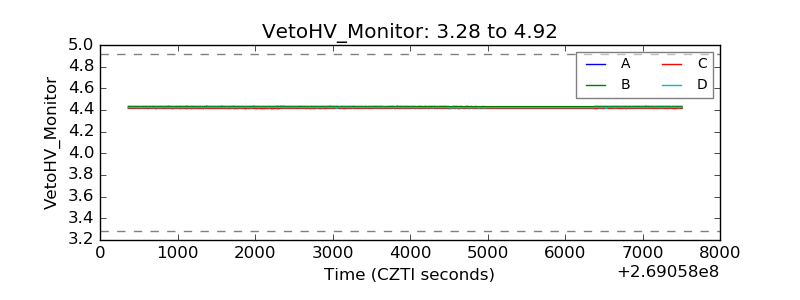 |
| Veto LLD | 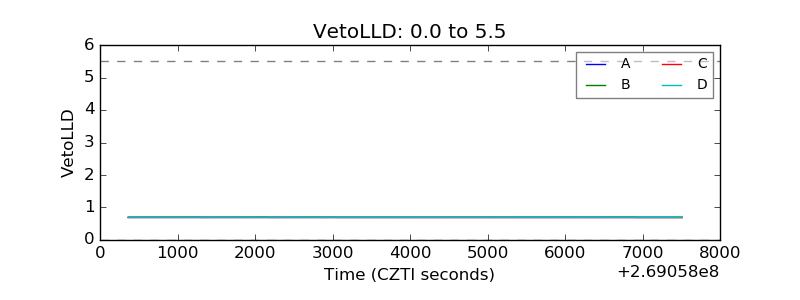 |
| Alpha Counter | 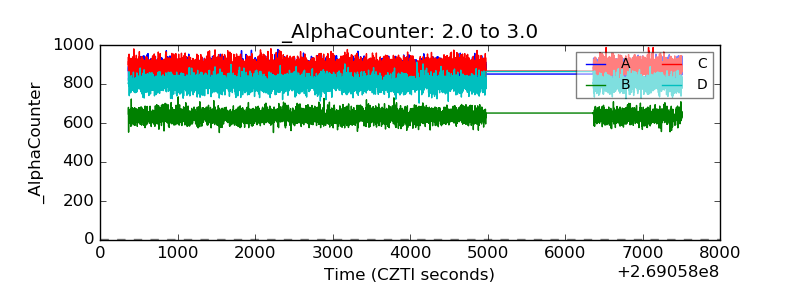 |
| _CPM_Rate | 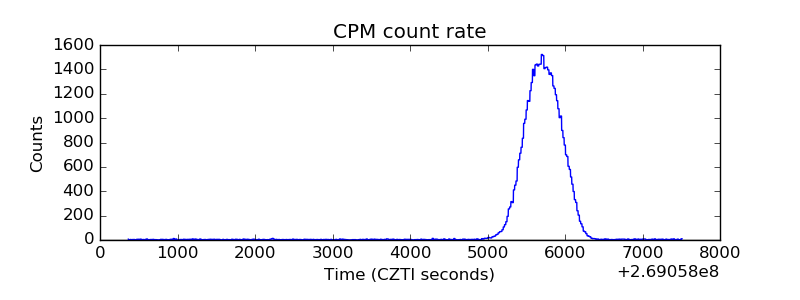 |
| CZT Counter | 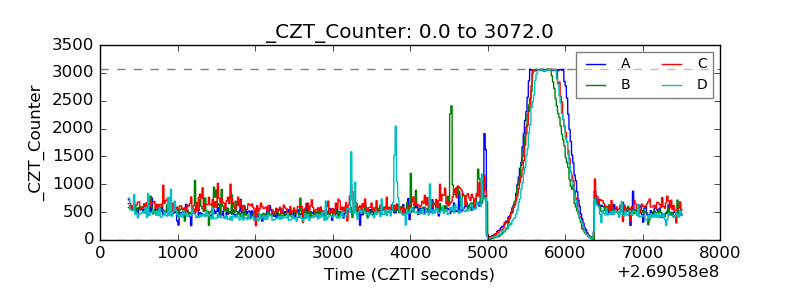 |
| +2.5 Volts monitor |  |
| +5 Volts monitor | 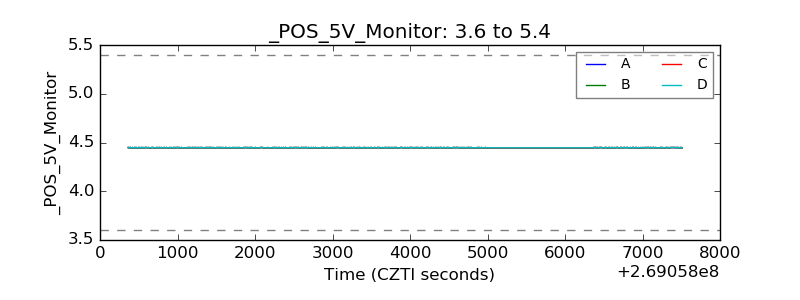 |
| _ROLL_ROT | 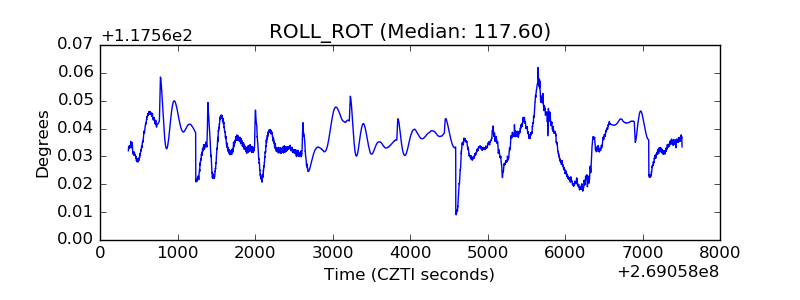 |
| _Roll_DEC | 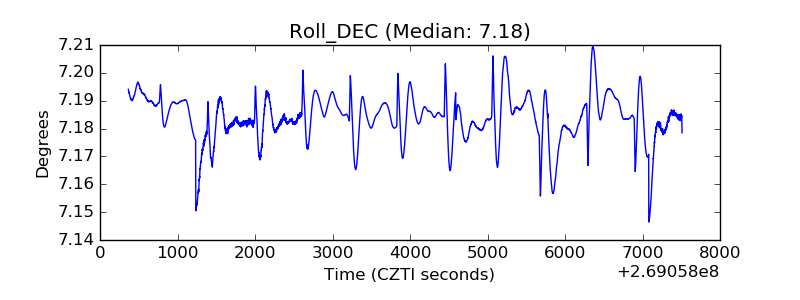 |
| _Roll_RA | 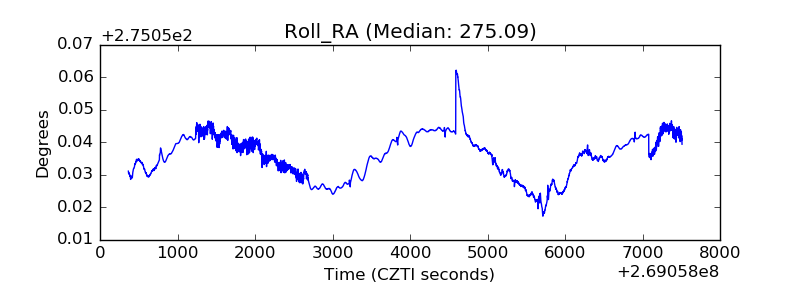 |
| Veto Counter | 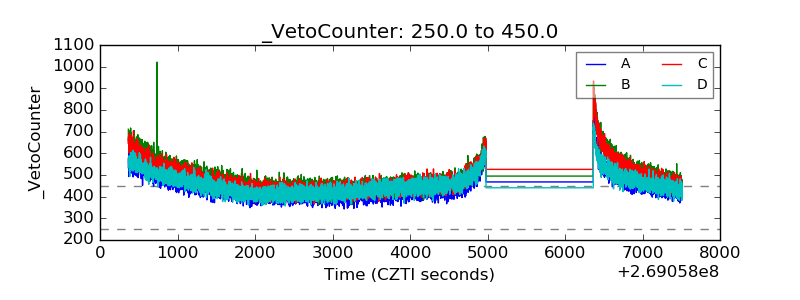 |