| Param | Original file | Final file |
|---|---|---|
| Filename | modeM0/AS1T02_060T01_9000002216_15070cztM0_level2.evt | modeM0/AS1T02_060T01_9000002216_15070cztM0_level2_quad_clean.evt |
| Size (bytes) | 632,957,760 | 71,458,560 |
| Size | 603.6 MB | 68.1 MB |
| Events in quadrant A | 3,199,030 | 435,511 |
| Events in quadrant B | 3,347,287 | 443,821 |
| Events in quadrant C | 6,772,012 | 412,935 |
| Events in quadrant D | 5,402,913 | 409,559 |
| Mode M0 | |||
|---|---|---|---|
| Quadrant | BADHDUFLAG | Total packets | Discarded packets |
| A | 0 | 13667 | 3 |
| B | 0 | 13845 | 2 |
| C | 0 | 24974 | 2 |
| D | 0 | 20511 | 2 |
| Mode M9 | |||
|---|---|---|---|
| Quadrant | BADHDUFLAG | Total packets | Discarded packets |
| A | 0 | 10 | 0 |
| B | 0 | 10 | 0 |
| C | 0 | 10 | 0 |
| D | 0 | 11 | 0 |
| Mode SS | |||
|---|---|---|---|
| Quadrant | BADHDUFLAG | Total packets | Discarded packets |
| A | 0 | 134 | 0 |
| B | 0 | 134 | 0 |
| C | 0 | 134 | 0 |
| D | 0 | 134 | 0 |
| Quadrant | Total seconds | Saturated seconds | Saturation percentage |
|---|---|---|---|
| A | 6624 | 83 | 1.253019% |
| B | 6624 | 110 | 1.660628% |
| C | 6624 | 351 | 5.298913% |
| D | 6624 | 1016 | 15.338164% |
Noise dominated data is calculated using 1-second bins in cleaned event files. If a bin has >2000 counts, and if more than 50% of those come from <1% of pixels, then it is considered to be noise-dominated and hence unusable.
| Quadrant | # 1 sec bins | Bins with >0 counts | Bins with >2000 counts | High rate bins dominated by noise | Noise dominated (total time) | Noise dominated (detector-on time) | Marked lightcurve |
|---|---|---|---|---|---|---|---|
| A | 7495 | 6625 | 0 | 0 | 0.00% | 0.00% | 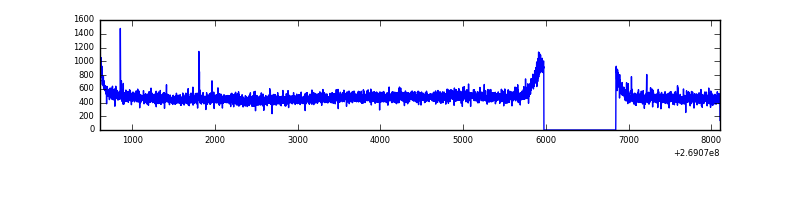 |
| B | 7495 | 6625 | 0 | 0 | 0.00% | 0.00% | 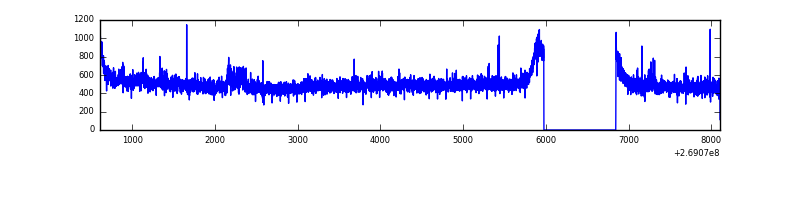 |
| C | 7495 | 6625 | 112 | 112 | 1.49% | 1.69% | 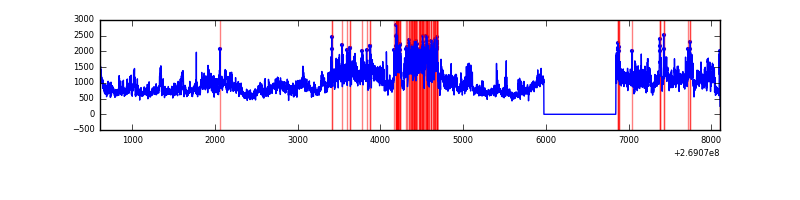 |
| D | 7495 | 6626 | 877 | 877 | 11.70% | 13.24% | 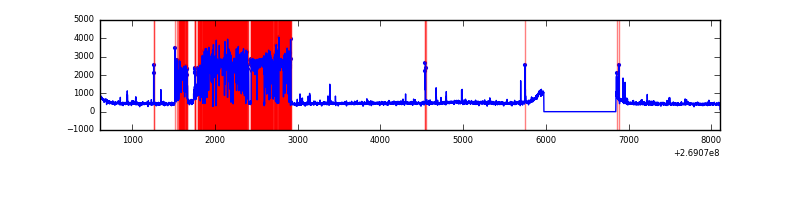 |
Top three noisy pixels from each quadrant. If the there are fewer than three noisy pixels in the level2.evt file, extra rows are filled as -1
| Pixel properties | Quadrant properties | ||||||
|---|---|---|---|---|---|---|---|
| Quadrant | DetID | PixID | Counts | Sigma | Mean | Median | Sigma |
| A | 12 | 189 | 9886 | 53.98 | 827 | 810 | 168.1 |
| A | 4 | 2 | 8430 | 45.32 | 827 | 810 | 168.1 |
| A | 0 | 226 | 7208 | 38.06 | 827 | 810 | 168.1 |
| B | 3 | 64 | 104064 | 644.21 | 827 | 807 | 160.3 |
| B | 12 | 111 | 19571 | 117.07 | 827 | 807 | 160.3 |
| B | 11 | 111 | 17357 | 103.25 | 827 | 807 | 160.3 |
| C | 3 | 233 | 3676956 | 19987.1 | 788 | 793 | 183.9 |
| C | 3 | 232 | 11196 | 56.56 | 788 | 793 | 183.9 |
| C | 3 | 234 | 10434 | 52.42 | 788 | 793 | 183.9 |
| D | 2 | 14 | 2503566 | 13661.23 | 743 | 719 | 183.2 |
| D | 13 | 249 | 48532 | 260.97 | 743 | 719 | 183.2 |
| D | 13 | 104 | 34522 | 184.5 | 743 | 719 | 183.2 |
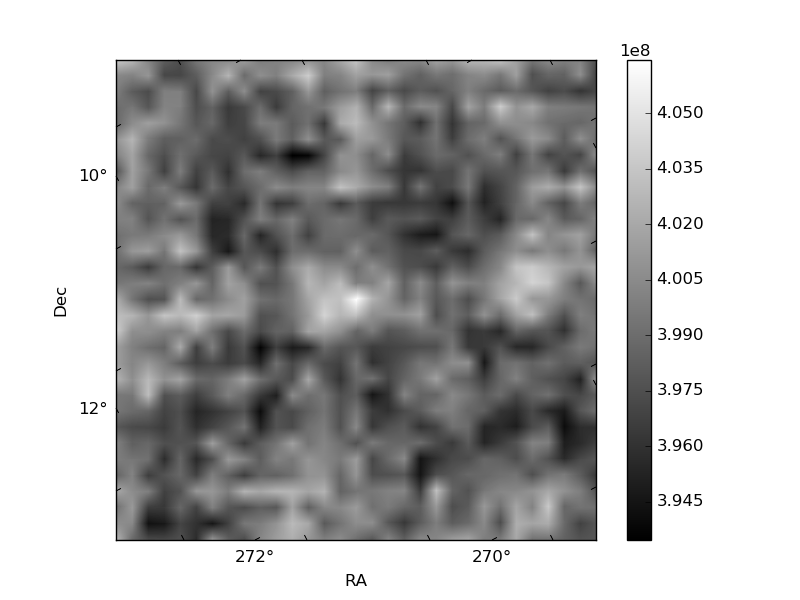
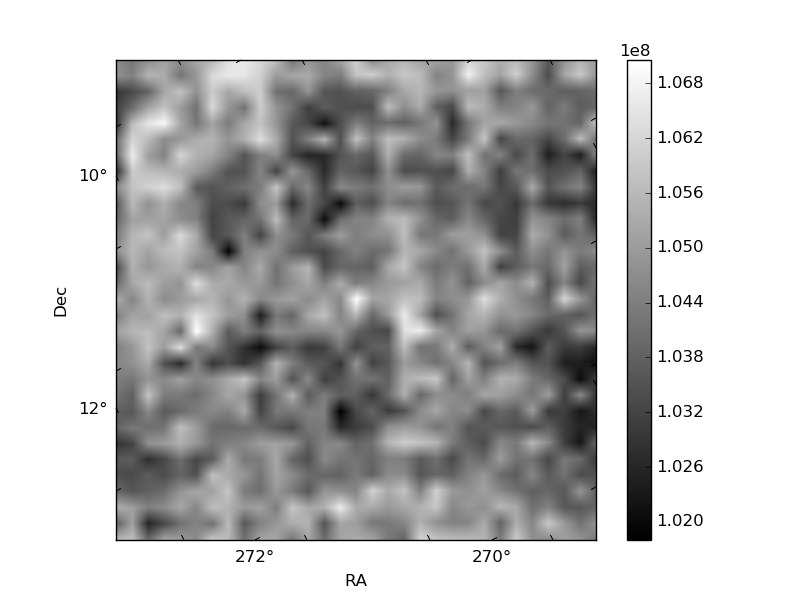
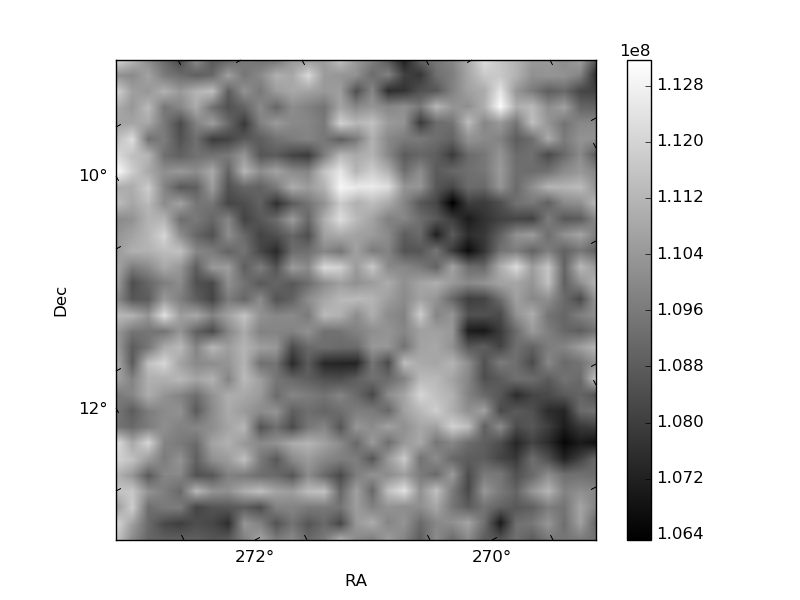
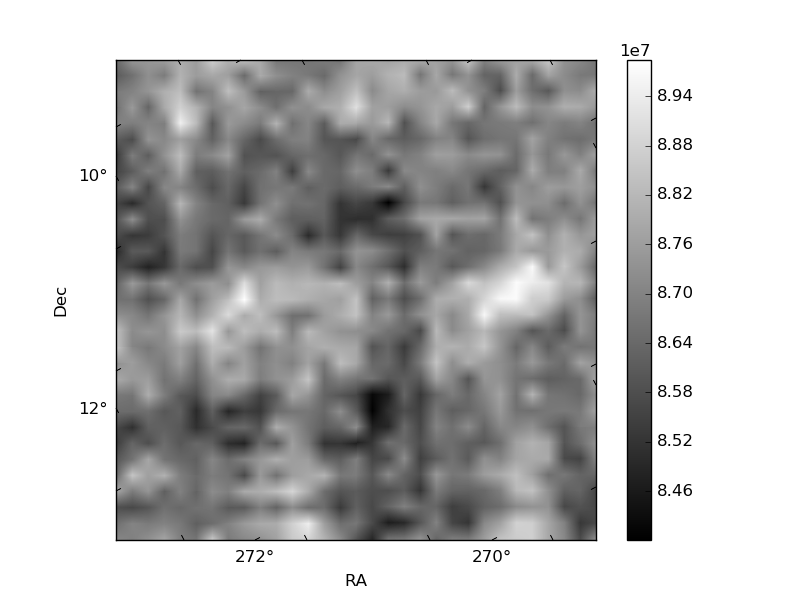
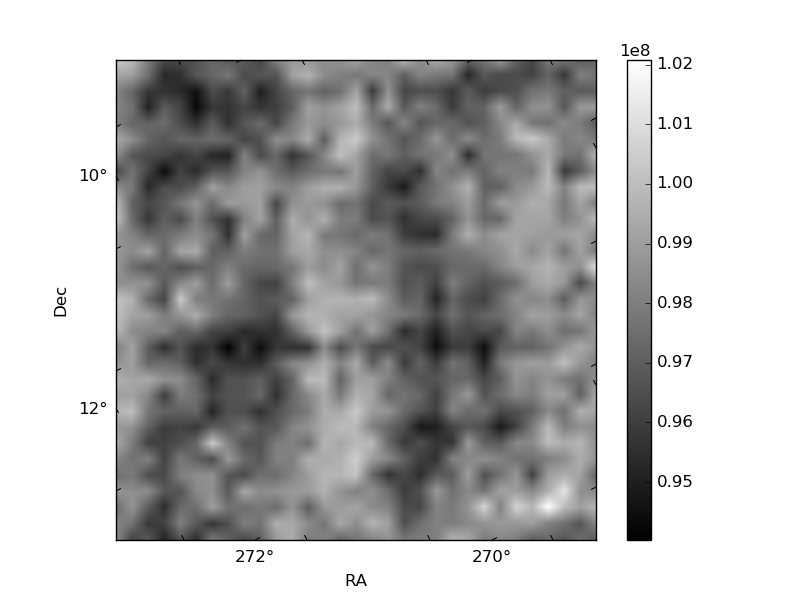
Histogram calculated using DETX and DETY for each event in the final _common_clean file
| Quadrant A |  |
 |
Quadrant B |
|---|---|---|---|
| Quadrant D |  |
 |
Quadrant C |
| Plot type | Count rate plots | Images |
|---|---|---|
| Comparison with Poisson distribution Blue bars denote a histogram of data divided into 1 sec bins. Red curve is a Poisson curve with rate = median count rate of data. |
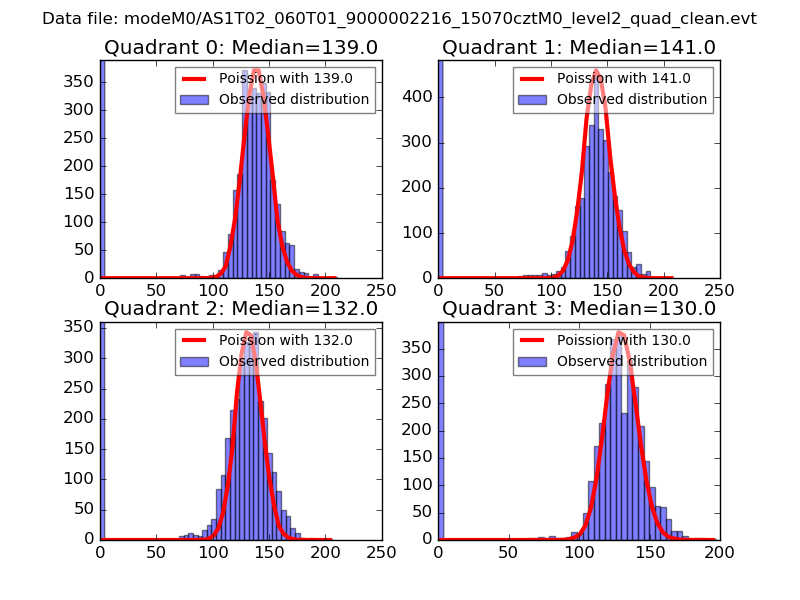 |
 |
| Quadrant-wise count rates Data is divided into 100 sec bins |
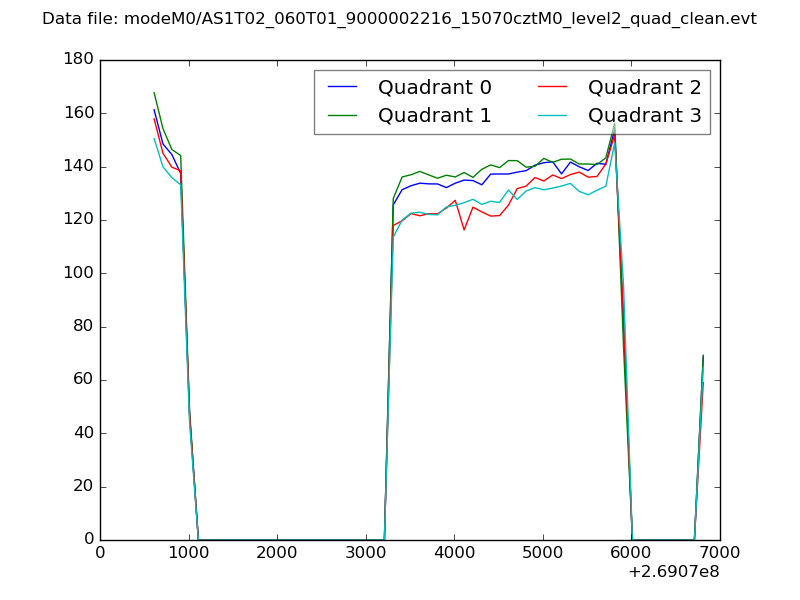 |
|
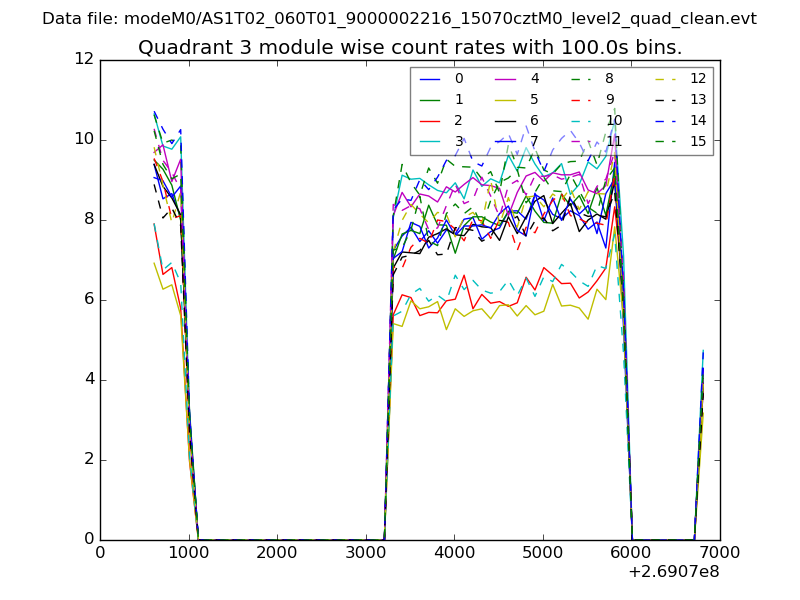
| Module-wise count rates for Quadrant A Data is divided into 100 sec bins |
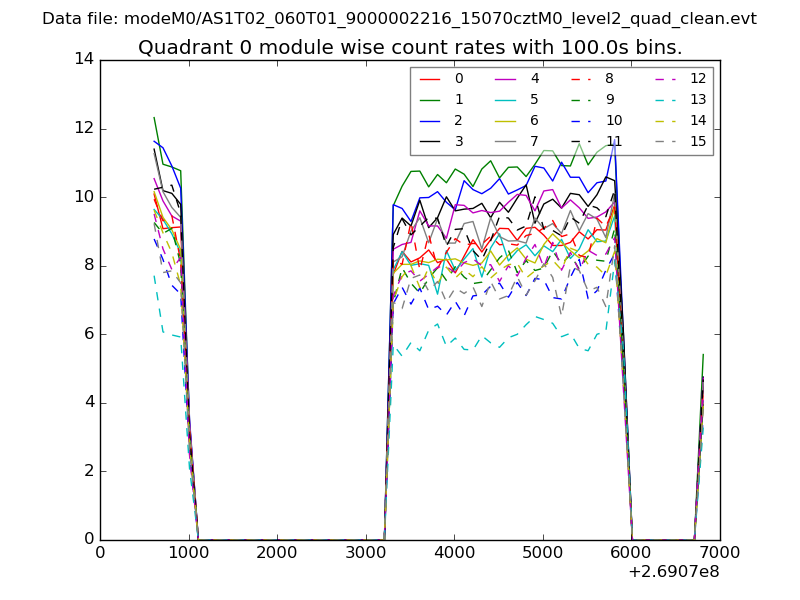 |
 |
| Module-wise count rates for Quadrant B Data is divided into 100 sec bins |
 |
 |
| Module-wise count rates for Quadrant C Data is divided into 100 sec bins |
 |
 |
| Module-wise count rates for Quadrant D Data is divided into 100 sec bins |
 |
 |
| Parameter | Plot |
|---|---|
| CZT HV Monitor |  |
| D_VDD | 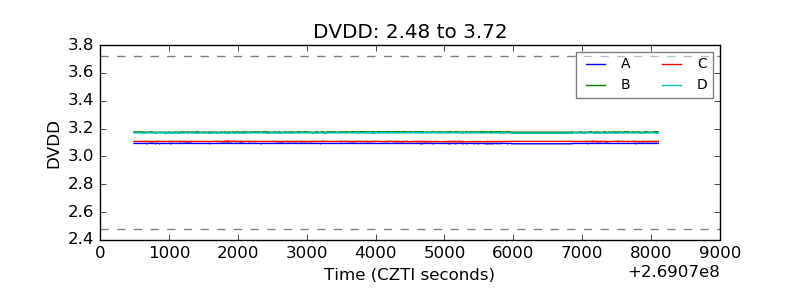 |
| Temperature 1 | 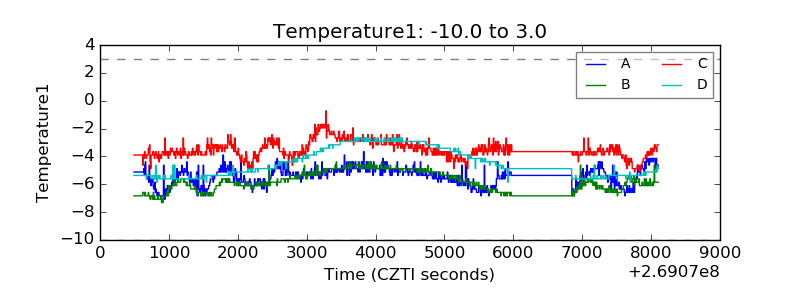 |
| Veto HV Monitor | 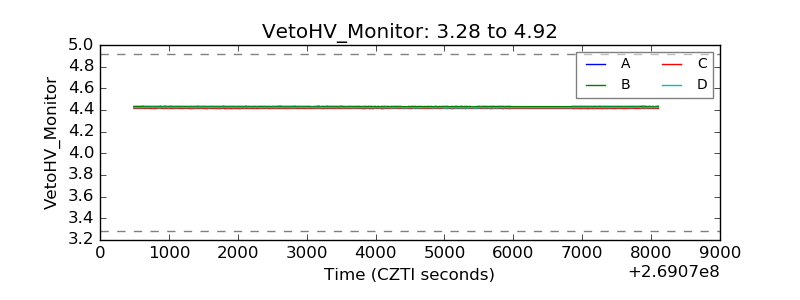 |
| Veto LLD | 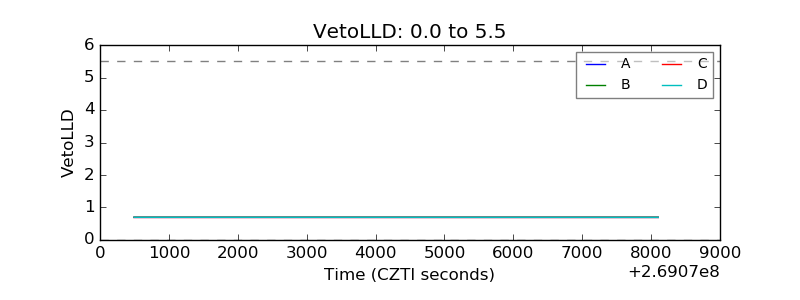 |
| Alpha Counter | 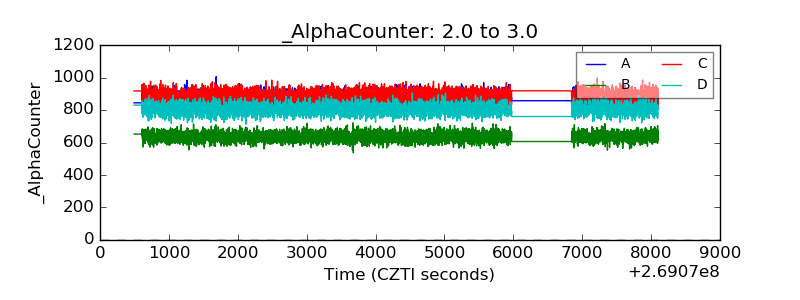 |
| _CPM_Rate | 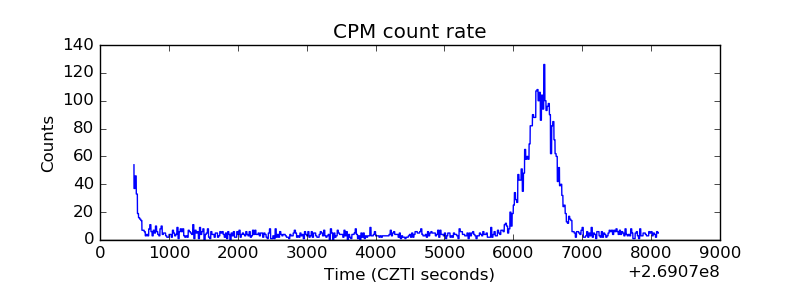 |
| CZT Counter | 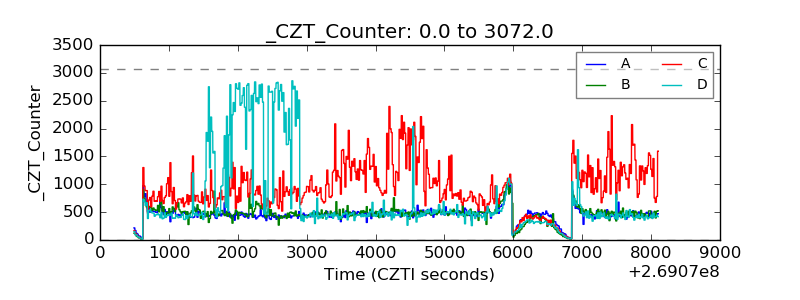 |
| +2.5 Volts monitor |  |
| +5 Volts monitor | 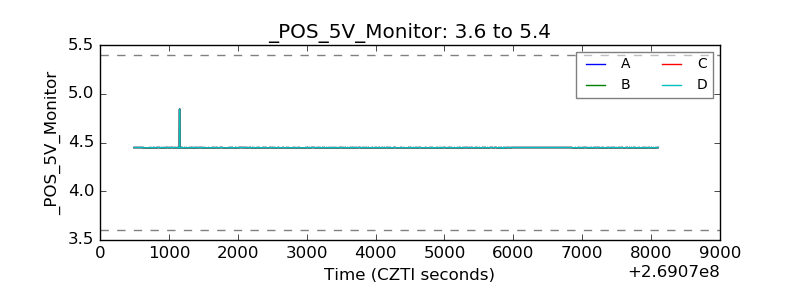 |
| _ROLL_ROT | 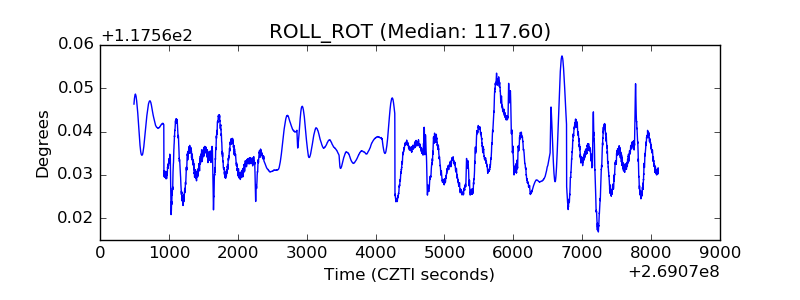 |
| _Roll_DEC | 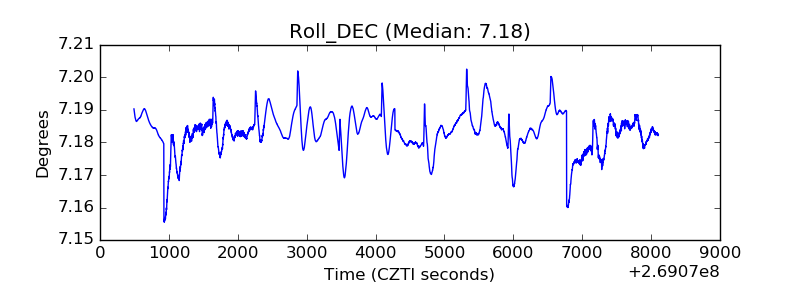 |
| _Roll_RA | 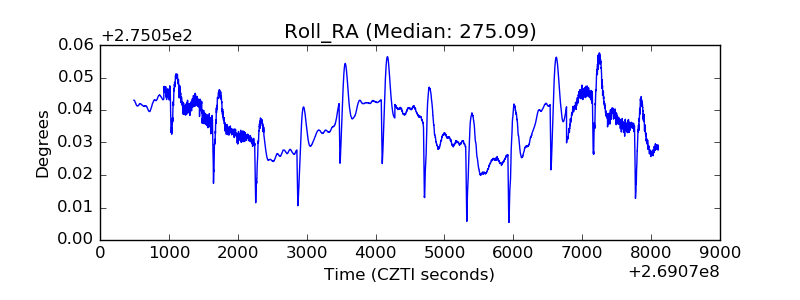 |
| Veto Counter | 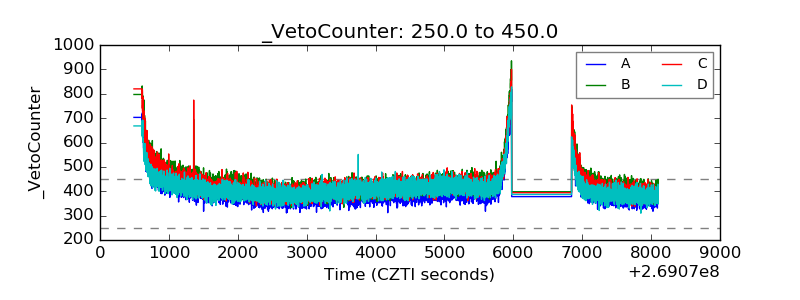 |