| Param | Original file | Final file |
|---|---|---|
| Filename | modeM0/AS1T02_060T01_9000002216_15073cztM0_level2.evt | modeM0/AS1T02_060T01_9000002216_15073cztM0_level2_quad_clean.evt |
| Size (bytes) | 618,972,480 | 86,304,960 |
| Size | 590.3 MB | 82.3 MB |
| Events in quadrant A | 4,001,186 | 519,161 |
| Events in quadrant B | 4,088,794 | 528,834 |
| Events in quadrant C | 6,117,825 | 502,846 |
| Events in quadrant D | 3,977,830 | 489,098 |
| Mode M0 | |||
|---|---|---|---|
| Quadrant | BADHDUFLAG | Total packets | Discarded packets |
| A | 0 | 17245 | 4 |
| B | 0 | 17328 | 3 |
| C | 0 | 23884 | 3 |
| D | 0 | 17584 | 3 |
| Mode M9 | |||
|---|---|---|---|
| Quadrant | BADHDUFLAG | Total packets | Discarded packets |
| A | 0 | 4 | 0 |
| B | 0 | 4 | 0 |
| C | 0 | 4 | 0 |
| D | 0 | 4 | 0 |
| Mode SS | |||
|---|---|---|---|
| Quadrant | BADHDUFLAG | Total packets | Discarded packets |
| A | 0 | 168 | 0 |
| B | 0 | 168 | 0 |
| C | 0 | 168 | 0 |
| D | 0 | 168 | 0 |
| Quadrant | Total seconds | Saturated seconds | Saturation percentage |
|---|---|---|---|
| A | 8257 | 392 | 4.747487% |
| B | 8257 | 401 | 4.856485% |
| C | 8257 | 543 | 6.576238% |
| D | 8257 | 310 | 3.754390% |
Noise dominated data is calculated using 1-second bins in cleaned event files. If a bin has >2000 counts, and if more than 50% of those come from <1% of pixels, then it is considered to be noise-dominated and hence unusable.
| Quadrant | # 1 sec bins | Bins with >0 counts | Bins with >2000 counts | High rate bins dominated by noise | Noise dominated (total time) | Noise dominated (detector-on time) | Marked lightcurve |
|---|---|---|---|---|---|---|---|
| A | 8613 | 8255 | 0 | 0 | 0.00% | 0.00% | 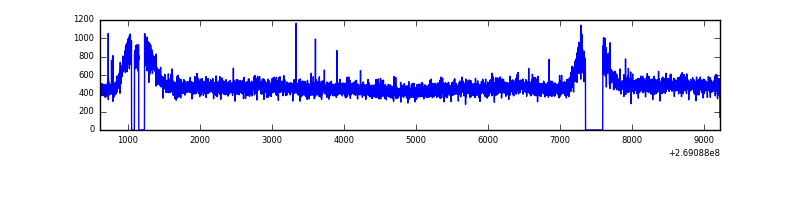 |
| B | 8613 | 8256 | 0 | 0 | 0.00% | 0.00% | 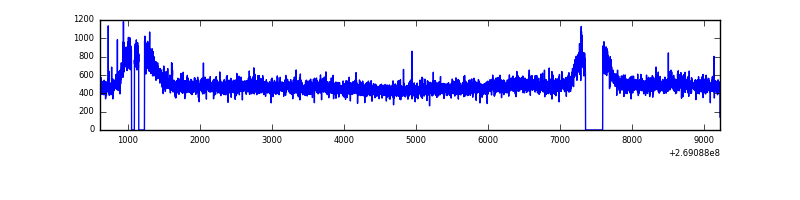 |
| C | 8613 | 8254 | 38 | 38 | 0.44% | 0.46% | 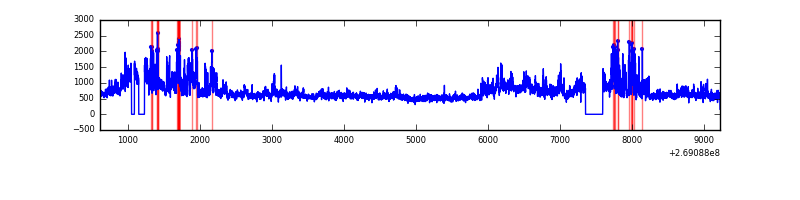 |
| D | 8613 | 8255 | 13 | 13 | 0.15% | 0.16% | 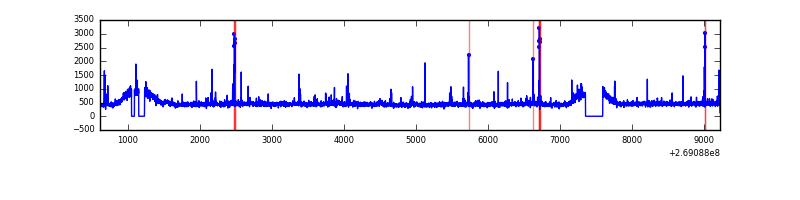 |
Top three noisy pixels from each quadrant. If the there are fewer than three noisy pixels in the level2.evt file, extra rows are filled as -1
| Pixel properties | Quadrant properties | ||||||
|---|---|---|---|---|---|---|---|
| Quadrant | DetID | PixID | Counts | Sigma | Mean | Median | Sigma |
| A | 0 | 226 | 9008 | 37.67 | 1038 | 1016 | 212.1 |
| A | 12 | 189 | 7965 | 32.76 | 1038 | 1016 | 212.1 |
| A | 3 | 137 | 7742 | 31.71 | 1038 | 1016 | 212.1 |
| B | 3 | 64 | 42581 | 205.46 | 1031 | 1001 | 202.4 |
| B | 12 | 111 | 25356 | 120.35 | 1031 | 1001 | 202.4 |
| B | 11 | 111 | 22547 | 106.47 | 1031 | 1001 | 202.4 |
| C | 3 | 233 | 2224250 | 9600.49 | 989 | 992 | 231.6 |
| C | 3 | 232 | 15554 | 62.88 | 989 | 992 | 231.6 |
| C | 3 | 234 | 13015 | 51.92 | 989 | 992 | 231.6 |
| D | 13 | 249 | 94413 | 381.57 | 1003 | 969 | 244.9 |
| D | 13 | 104 | 31402 | 124.27 | 1003 | 969 | 244.9 |
| D | 2 | 234 | 28606 | 112.85 | 1003 | 969 | 244.9 |
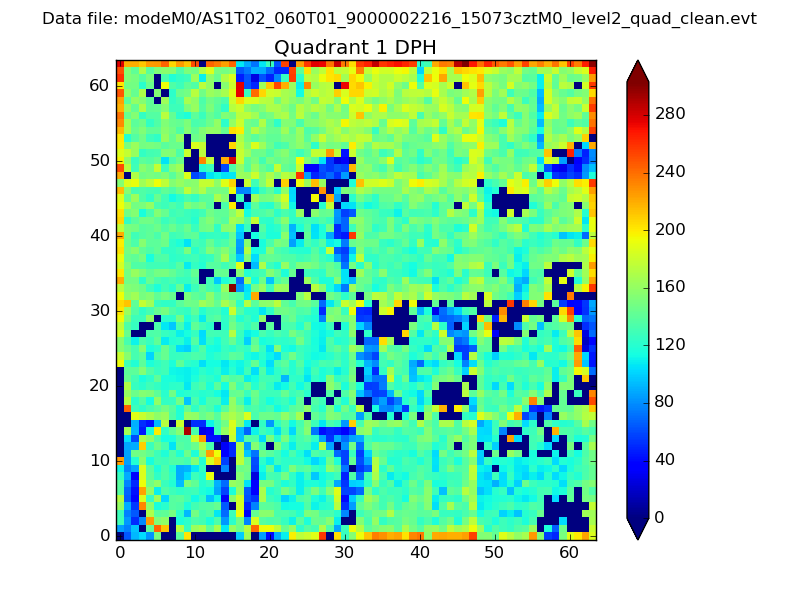
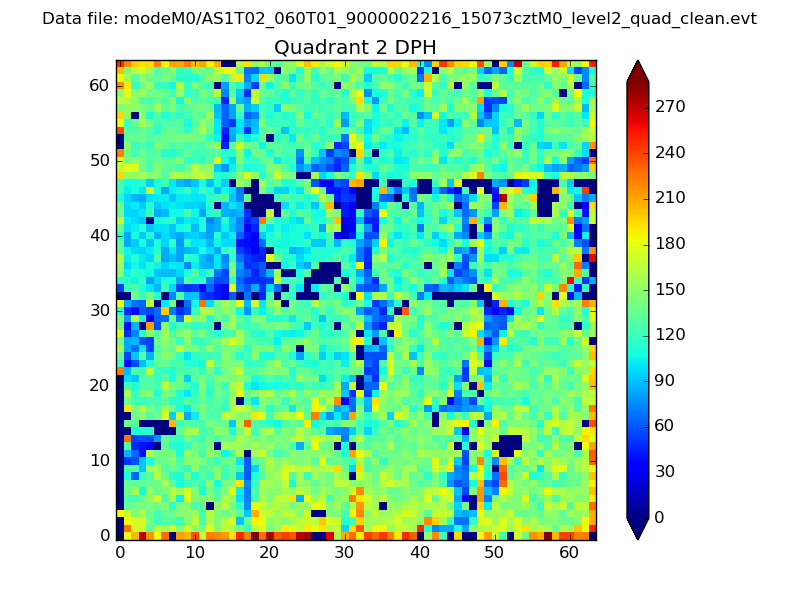
Histogram calculated using DETX and DETY for each event in the final _common_clean file
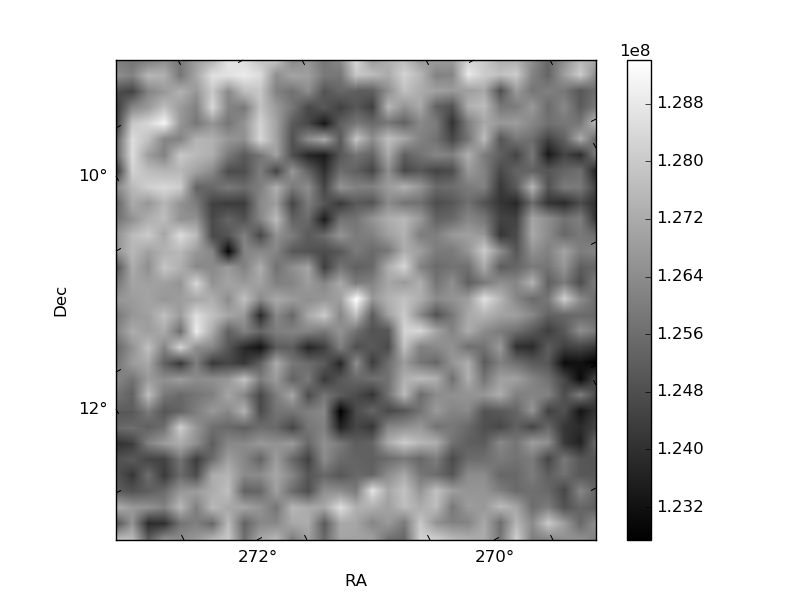
| Quadrant A |  |
 |
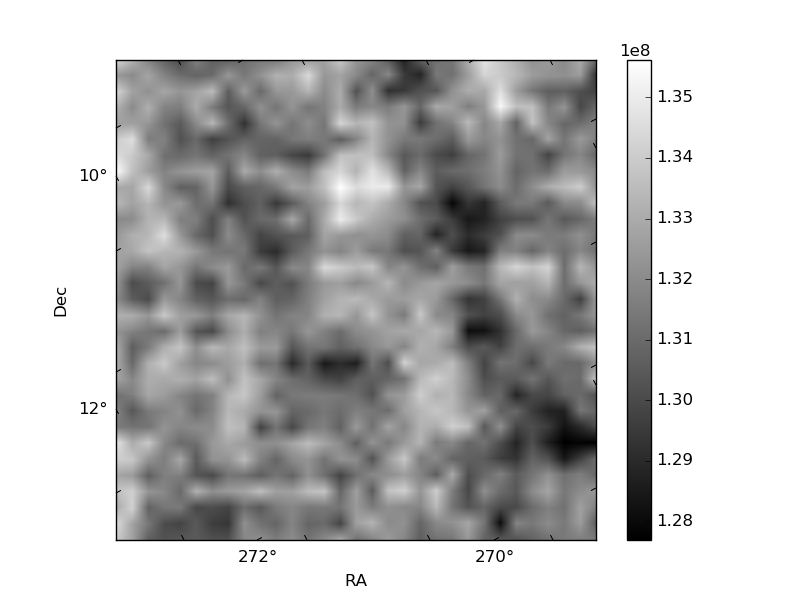
Quadrant B |
|---|---|---|---|
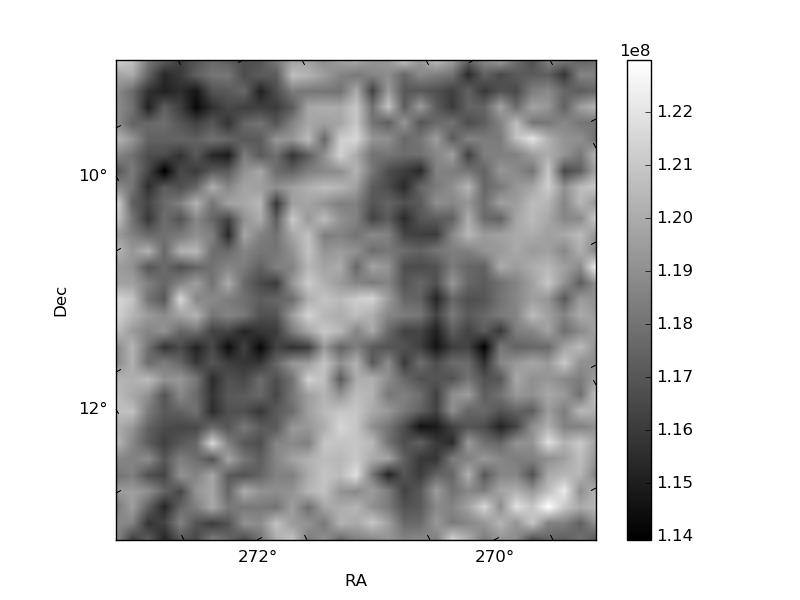
| Quadrant D |  |
 |
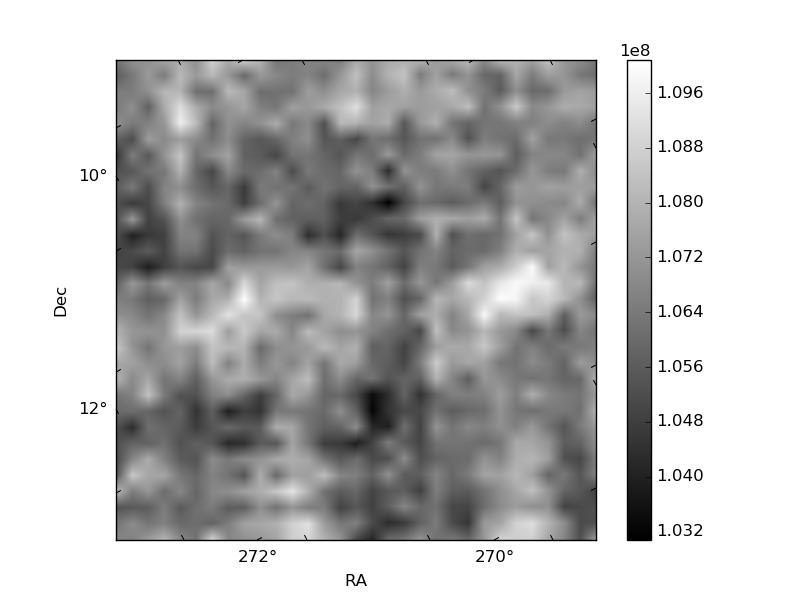
Quadrant C |
| Plot type | Count rate plots | Images |
|---|---|---|
| Comparison with Poisson distribution Blue bars denote a histogram of data divided into 1 sec bins. Red curve is a Poisson curve with rate = median count rate of data. |
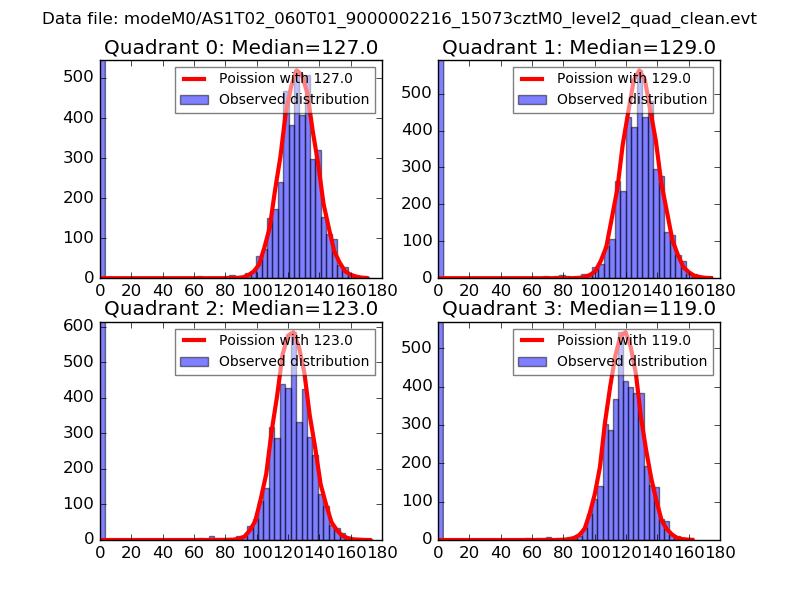 |
 |
| Quadrant-wise count rates Data is divided into 100 sec bins |
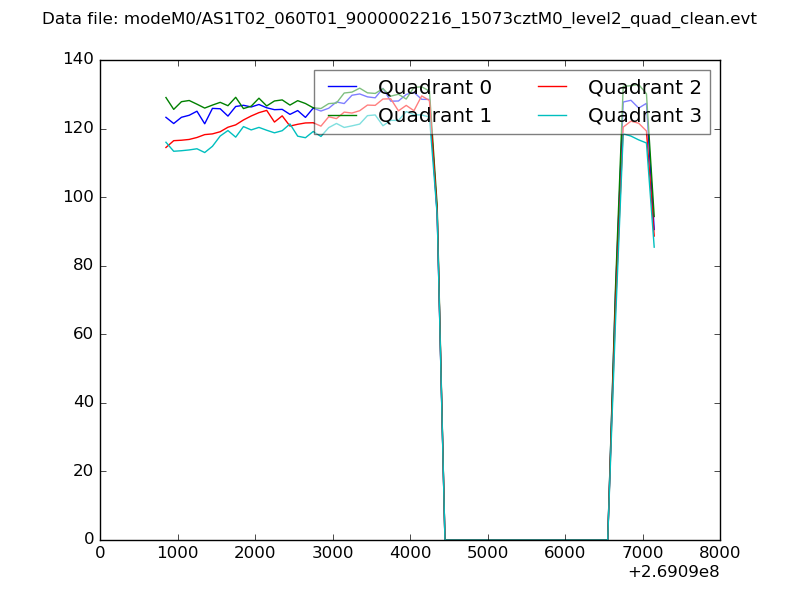 |
|
| Module-wise count rates for Quadrant A Data is divided into 100 sec bins |
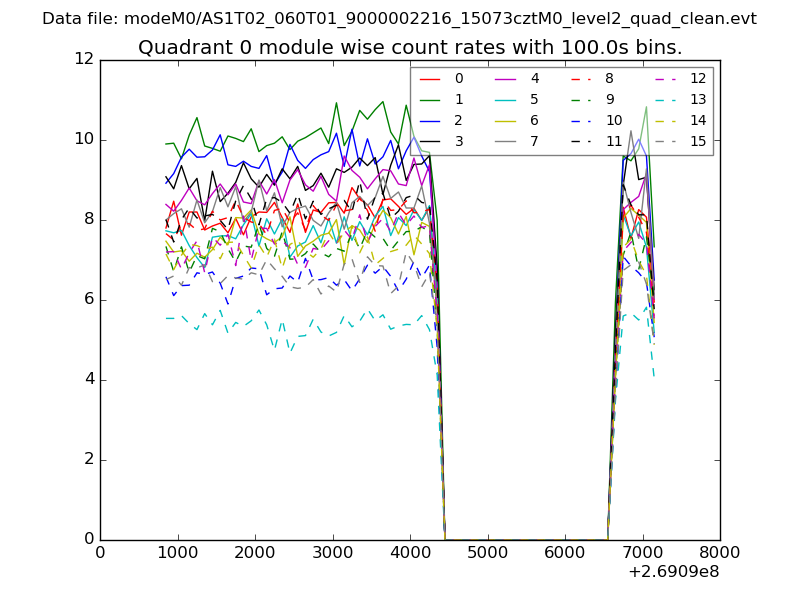 |
 |
| Module-wise count rates for Quadrant B Data is divided into 100 sec bins |
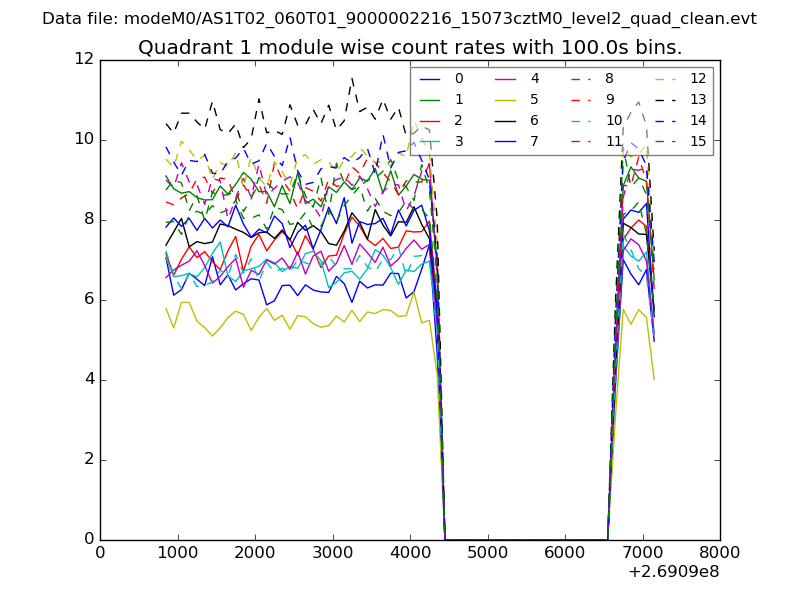 |
 |
| Module-wise count rates for Quadrant C Data is divided into 100 sec bins |
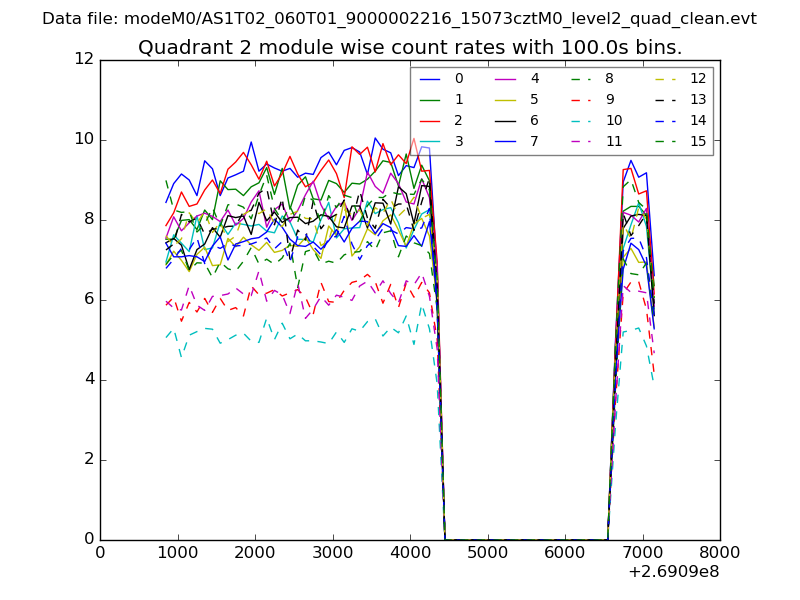 |
 |
| Module-wise count rates for Quadrant D Data is divided into 100 sec bins |
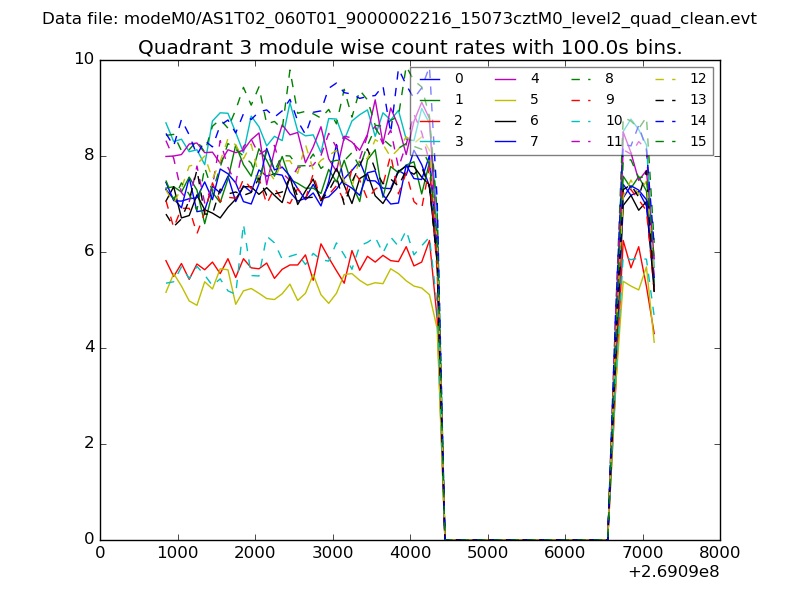 |
 |
| Parameter | Plot |
|---|---|
| CZT HV Monitor | 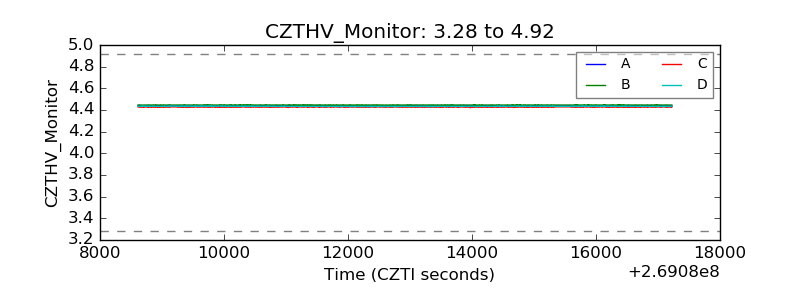 |
| D_VDD | 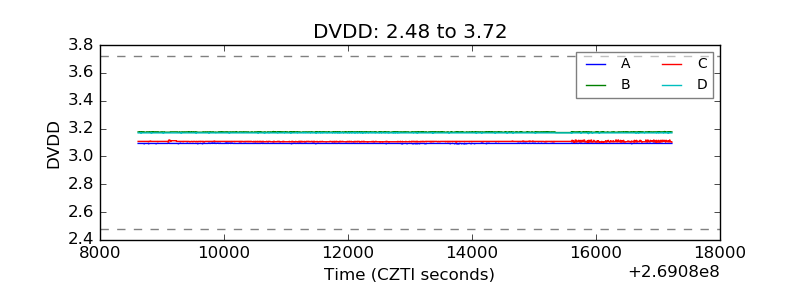 |
| Temperature 1 | 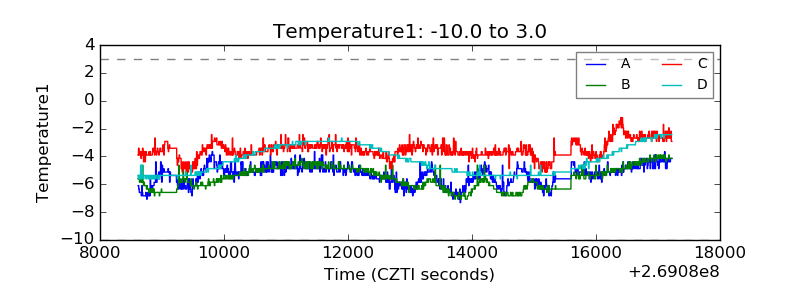 |
| Veto HV Monitor | 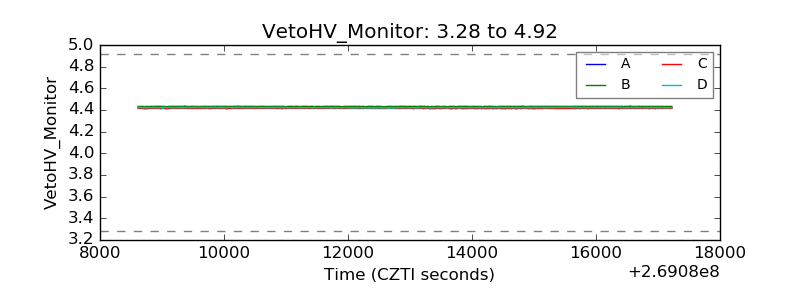 |
| Veto LLD | 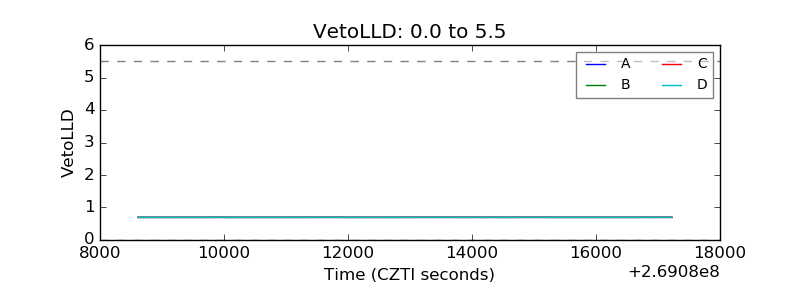 |
| Alpha Counter | 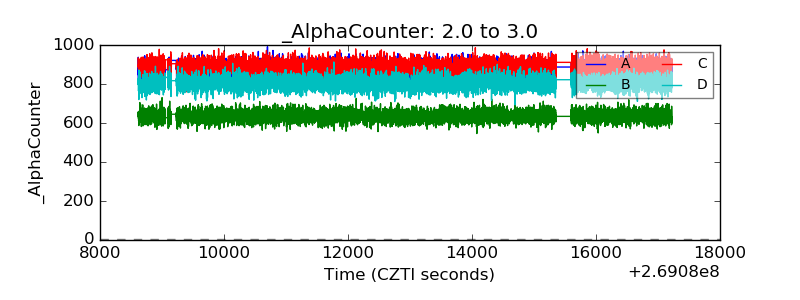 |
| _CPM_Rate | 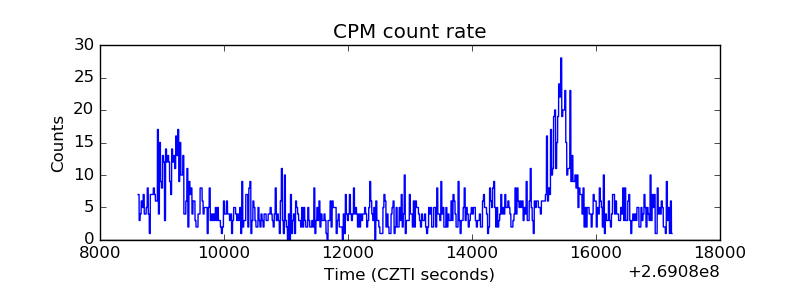 |
| CZT Counter |  |
| +2.5 Volts monitor |  |
| +5 Volts monitor | 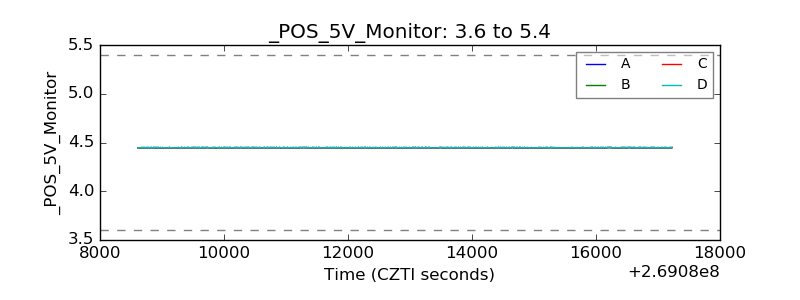 |
| _ROLL_ROT | 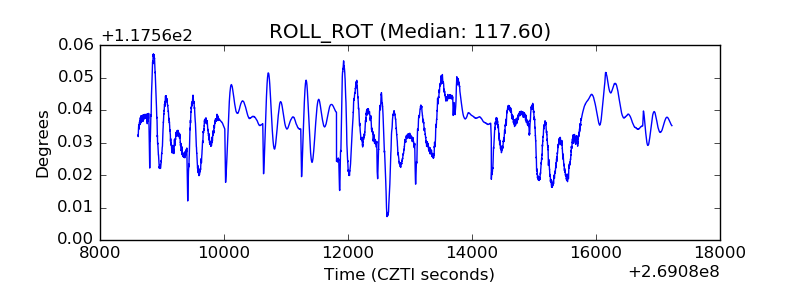 |
| _Roll_DEC | 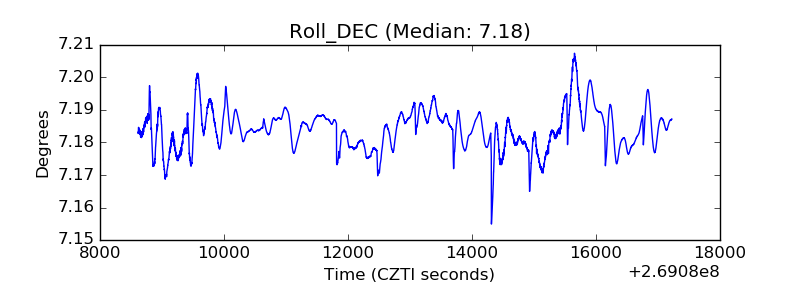 |
| _Roll_RA |  |
| Veto Counter | 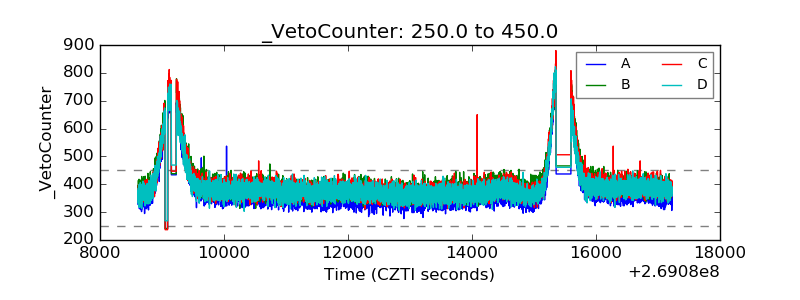 |