| Param | Original file | Final file |
|---|---|---|
| Filename | modeM0/AS1T02_060T01_9000002216_15076cztM0_level2.evt | modeM0/AS1T02_060T01_9000002216_15076cztM0_level2_quad_clean.evt |
| Size (bytes) | 1,270,307,520 | 241,295,040 |
| Size | 1.2 GB | 230.1 MB |
| Events in quadrant A | 8,443,863 | 1,540,569 |
| Events in quadrant B | 9,219,566 | 1,559,586 |
| Events in quadrant C | 10,944,296 | 1,497,927 |
| Events in quadrant D | 8,632,109 | 1,454,806 |
| Mode M0 | |||
|---|---|---|---|
| Quadrant | BADHDUFLAG | Total packets | Discarded packets |
| A | 0 | 37147 | 4 |
| B | 0 | 38917 | 3 |
| C | 0 | 44985 | 3 |
| D | 0 | 38390 | 3 |
| Mode M9 | |||
|---|---|---|---|
| Quadrant | BADHDUFLAG | Total packets | Discarded packets |
| A | 0 | 19 | 0 |
| B | 0 | 19 | 0 |
| C | 0 | 19 | 0 |
| D | 0 | 19 | 0 |
| Mode SS | |||
|---|---|---|---|
| Quadrant | BADHDUFLAG | Total packets | Discarded packets |
| A | 0 | 372 | 0 |
| B | 0 | 372 | 0 |
| C | 0 | 372 | 0 |
| D | 0 | 372 | 0 |
| Quadrant | Total seconds | Saturated seconds | Saturation percentage |
|---|---|---|---|
| A | 18214 | 155 | 0.850994% |
| B | 18214 | 221 | 1.213352% |
| C | 18214 | 241 | 1.323158% |
| D | 18214 | 202 | 1.109037% |
Noise dominated data is calculated using 1-second bins in cleaned event files. If a bin has >2000 counts, and if more than 50% of those come from <1% of pixels, then it is considered to be noise-dominated and hence unusable.
| Quadrant | # 1 sec bins | Bins with >0 counts | Bins with >2000 counts | High rate bins dominated by noise | Noise dominated (total time) | Noise dominated (detector-on time) | Marked lightcurve |
|---|---|---|---|---|---|---|---|
| A | 20225 | 18216 | 0 | 0 | 0.00% | 0.00% | 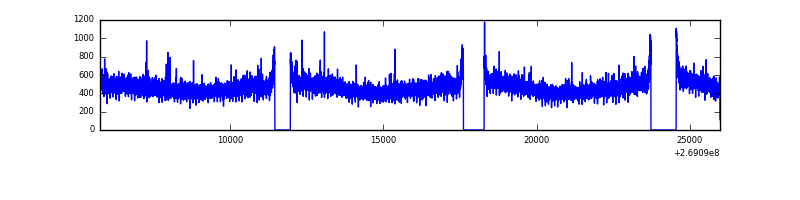 |
| B | 20225 | 18217 | 33 | 33 | 0.16% | 0.18% | 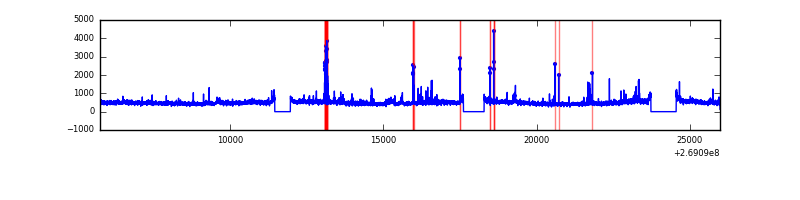 |
| C | 20225 | 18215 | 14 | 14 | 0.07% | 0.08% | 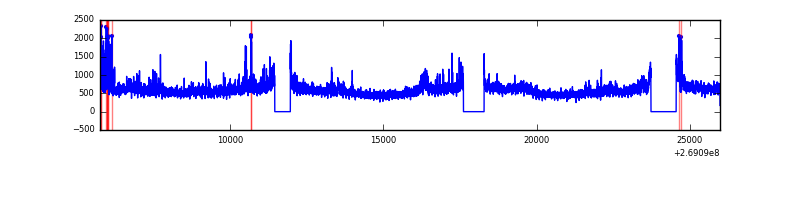 |
| D | 20225 | 18216 | 68 | 68 | 0.34% | 0.37% | 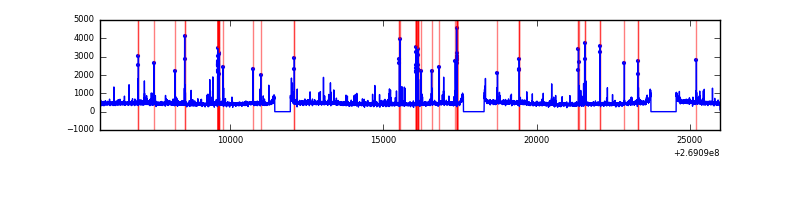 |
Top three noisy pixels from each quadrant. If the there are fewer than three noisy pixels in the level2.evt file, extra rows are filled as -1
| Pixel properties | Quadrant properties | ||||||
|---|---|---|---|---|---|---|---|
| Quadrant | DetID | PixID | Counts | Sigma | Mean | Median | Sigma |
| A | 0 | 226 | 18862 | 37.83 | 2193 | 2148 | 441.8 |
| A | 12 | 189 | 17352 | 34.41 | 2193 | 2148 | 441.8 |
| A | 12 | 194 | 15980 | 31.31 | 2193 | 2148 | 441.8 |
| B | 3 | 64 | 450269 | 1076.45 | 2179 | 2125 | 416.3 |
| B | 10 | 245 | 178323 | 423.23 | 2179 | 2125 | 416.3 |
| B | 12 | 111 | 52321 | 120.57 | 2179 | 2125 | 416.3 |
| C | 3 | 233 | 2601672 | 5288.84 | 2123 | 2134 | 491.5 |
| C | 3 | 232 | 29330 | 55.33 | 2123 | 2134 | 491.5 |
| C | 3 | 234 | 20370 | 37.1 | 2123 | 2134 | 491.5 |
| D | 13 | 249 | 263882 | 509.11 | 2121 | 2061 | 514.3 |
| D | 13 | 104 | 111360 | 212.53 | 2121 | 2061 | 514.3 |
| D | 10 | 70 | 104382 | 198.96 | 2121 | 2061 | 514.3 |
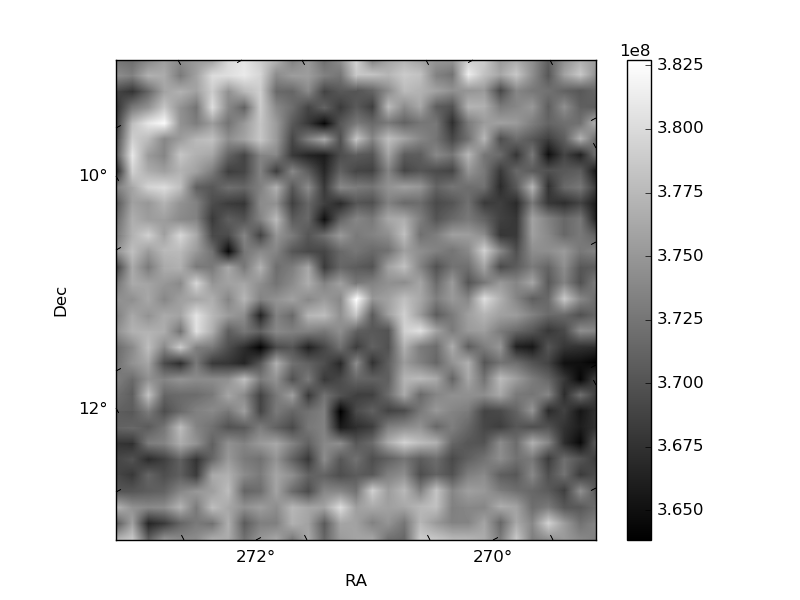
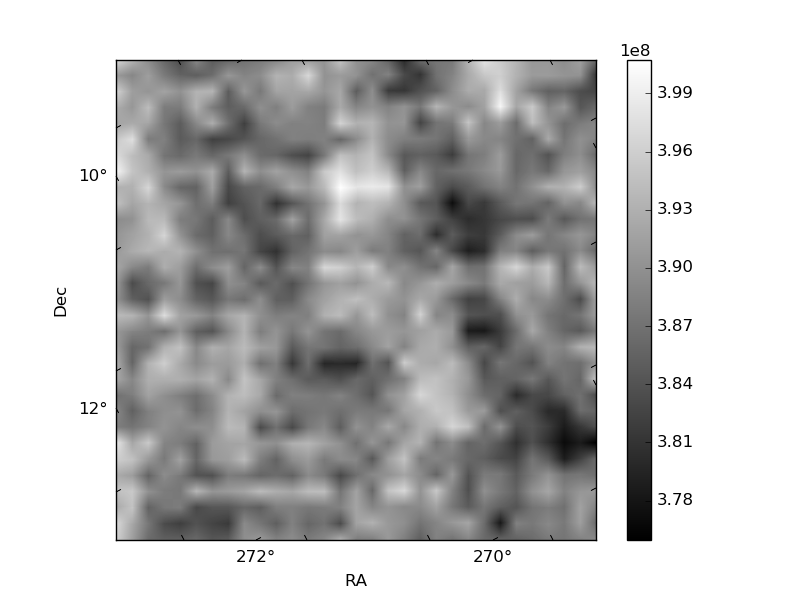
Histogram calculated using DETX and DETY for each event in the final _common_clean file
| Quadrant A | 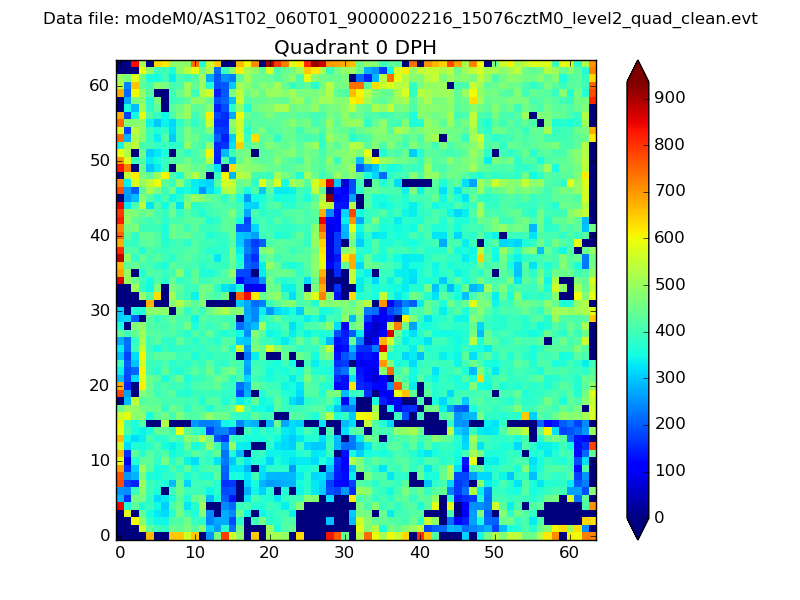 |
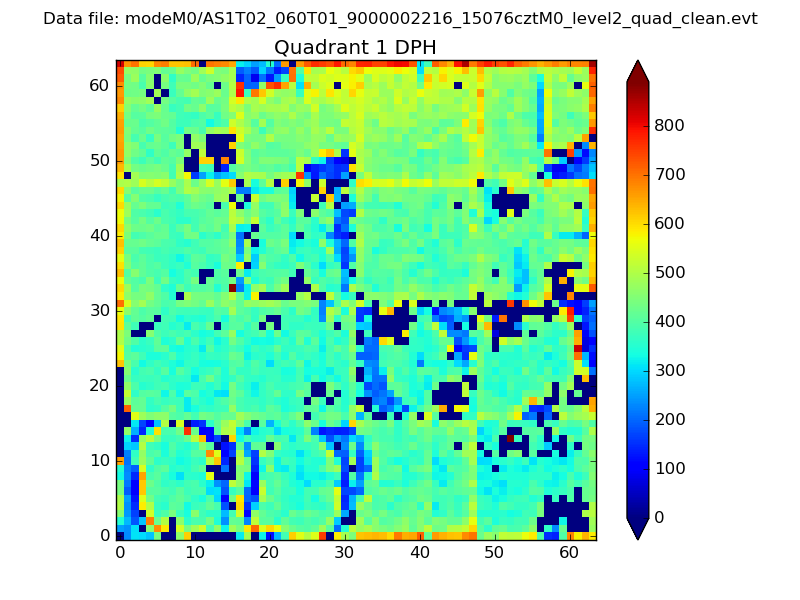 |
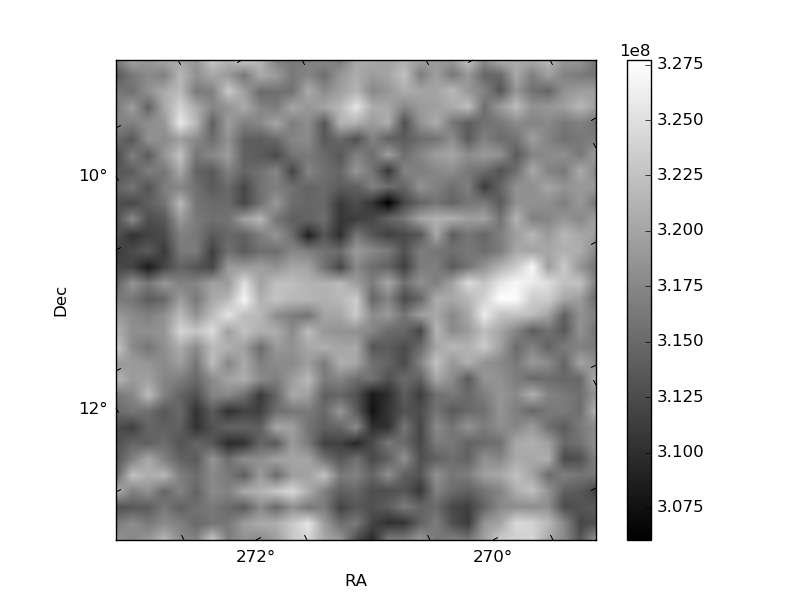
Quadrant B |
|---|---|---|---|
| Quadrant D |  |
 |
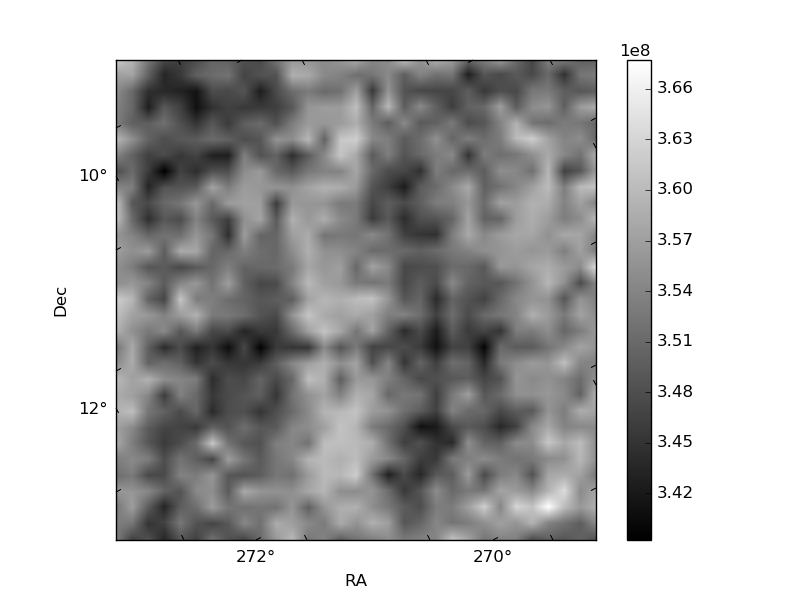
Quadrant C |
| Plot type | Count rate plots | Images |
|---|---|---|
| Comparison with Poisson distribution Blue bars denote a histogram of data divided into 1 sec bins. Red curve is a Poisson curve with rate = median count rate of data. |
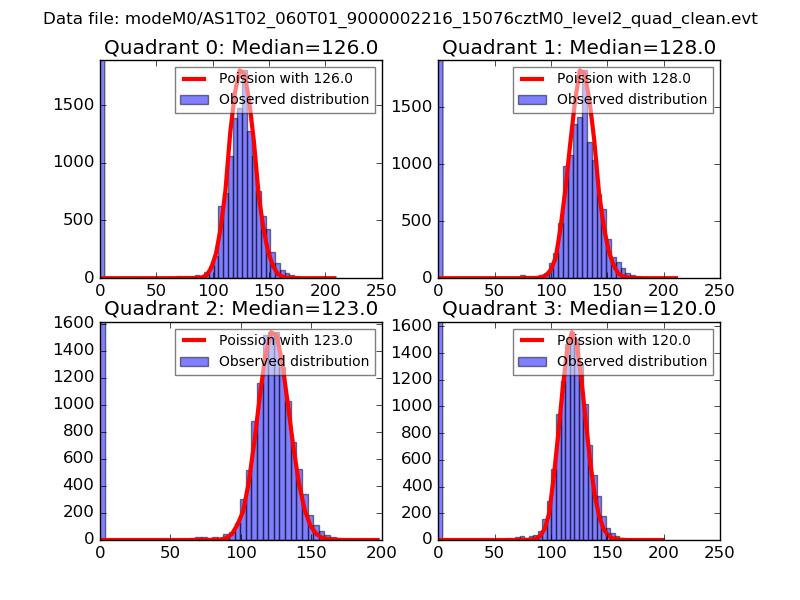 |
 |
| Quadrant-wise count rates Data is divided into 100 sec bins |
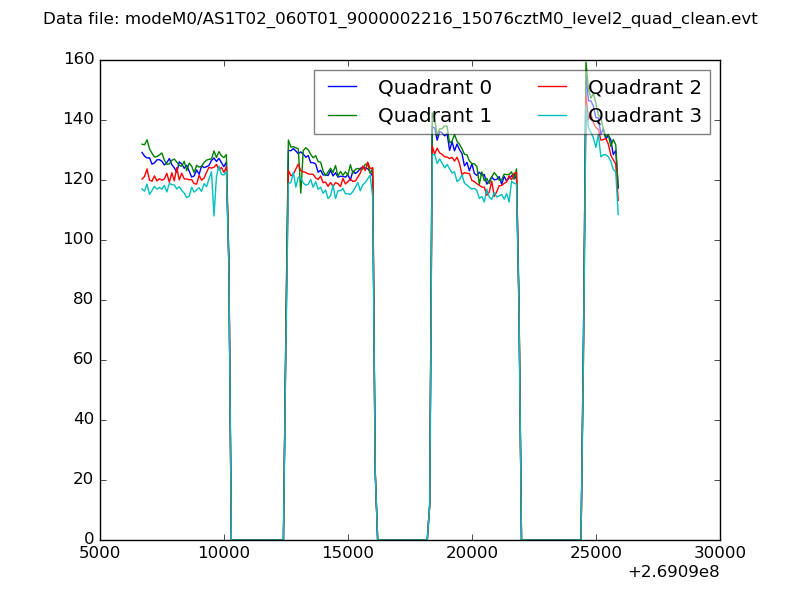 |
|
| Module-wise count rates for Quadrant A Data is divided into 100 sec bins |
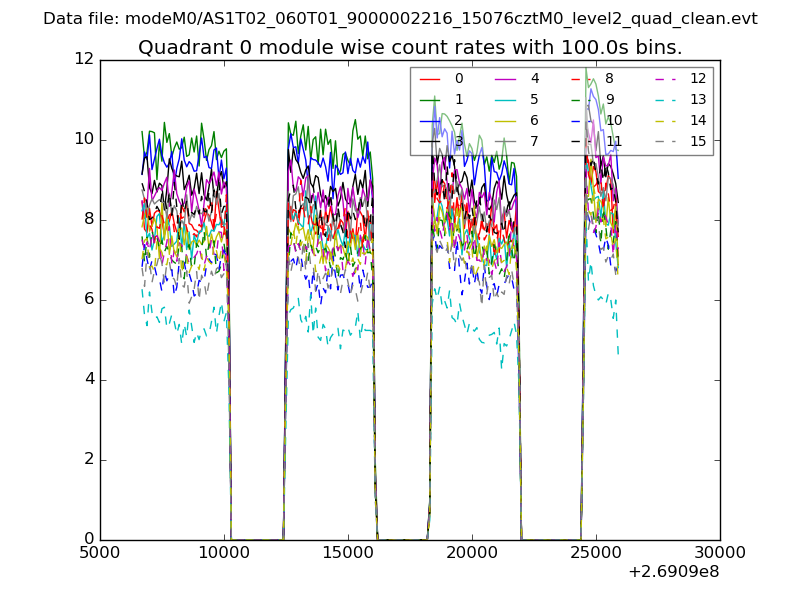 |
 |
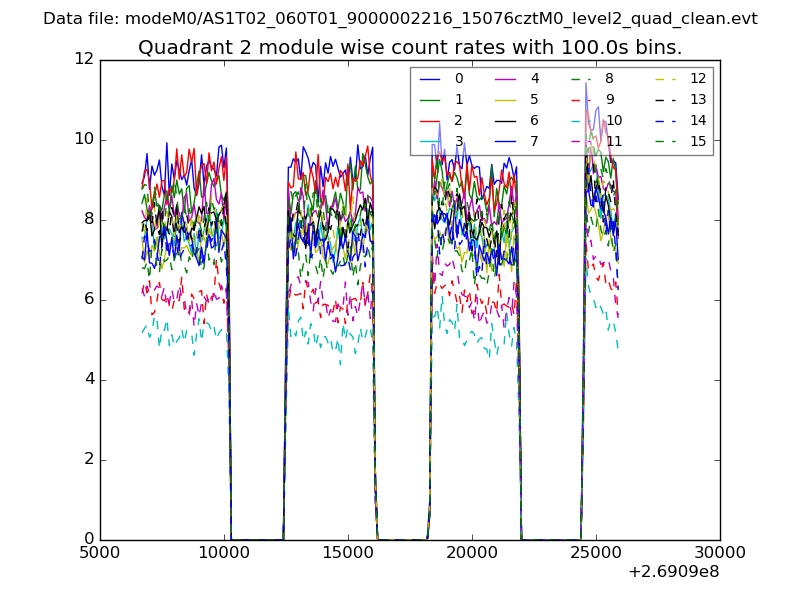
| Module-wise count rates for Quadrant B Data is divided into 100 sec bins |
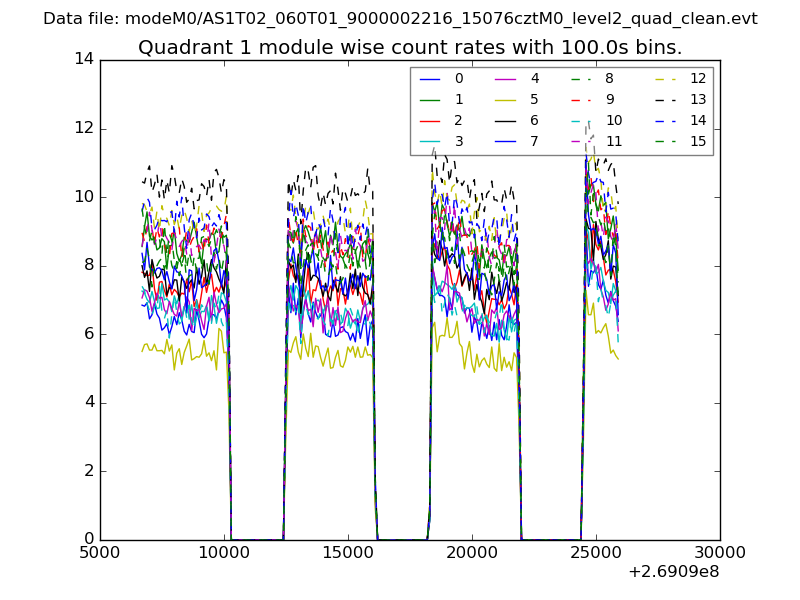 |
 |
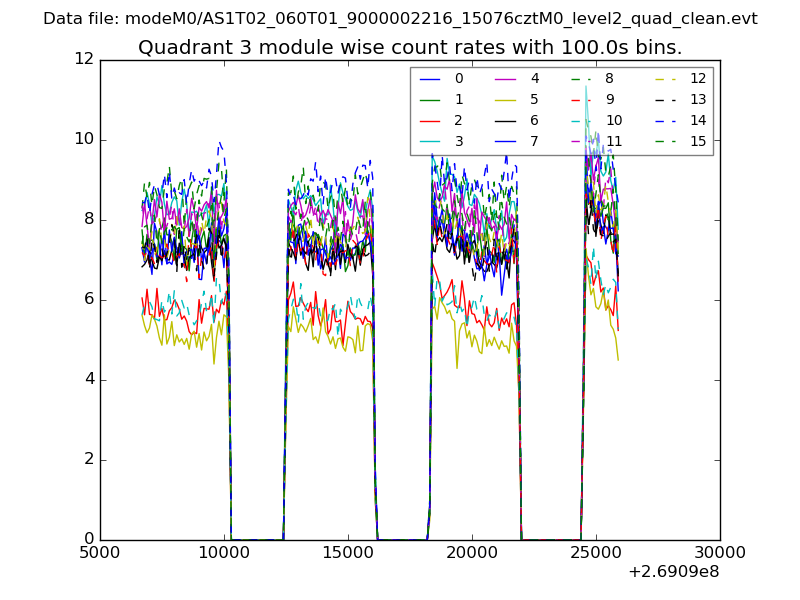
| Module-wise count rates for Quadrant C Data is divided into 100 sec bins |
 |
 |
| Module-wise count rates for Quadrant D Data is divided into 100 sec bins |
 |
 |
| Parameter | Plot |
|---|---|
| CZT HV Monitor | 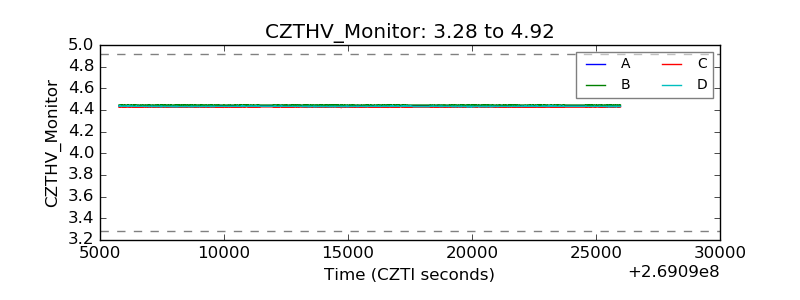 |
| D_VDD | 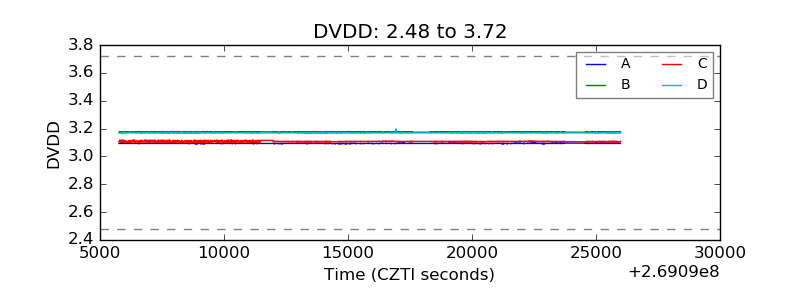 |
| Temperature 1 | 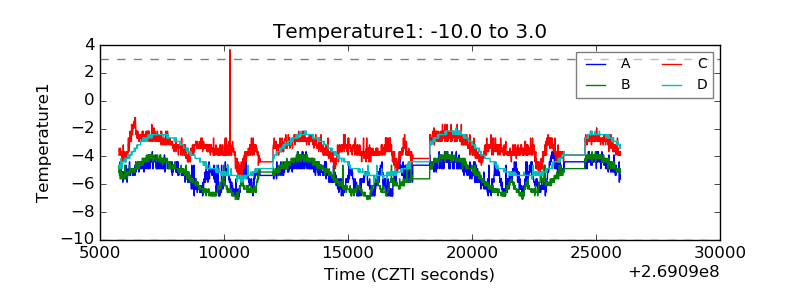 |
| Veto HV Monitor | 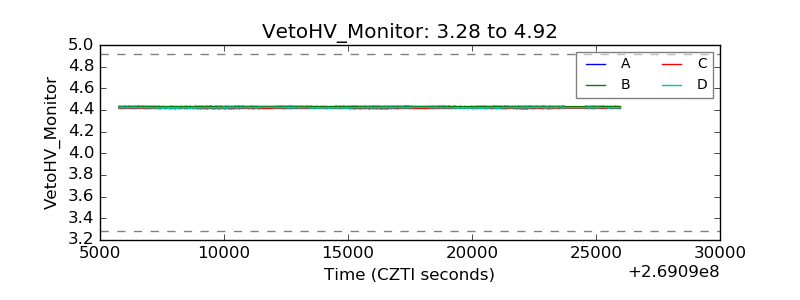 |
| Veto LLD | 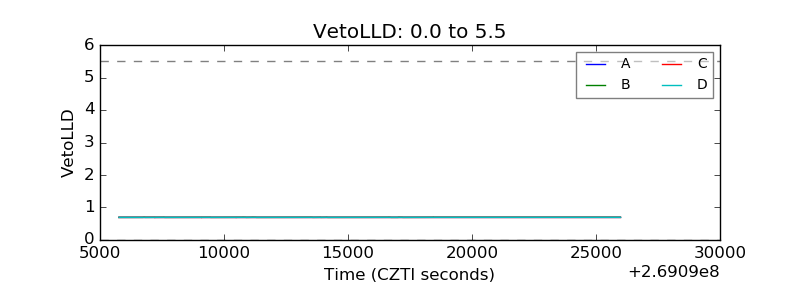 |
| Alpha Counter | 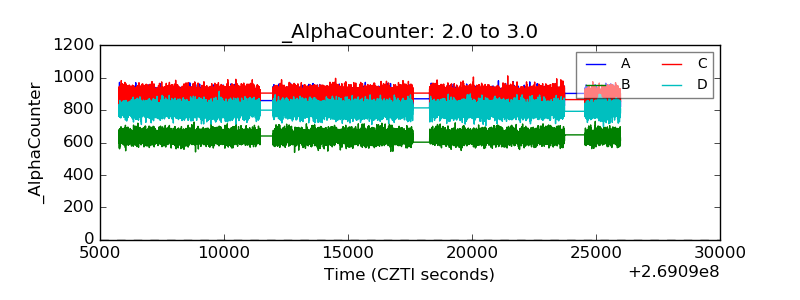 |
| _CPM_Rate | 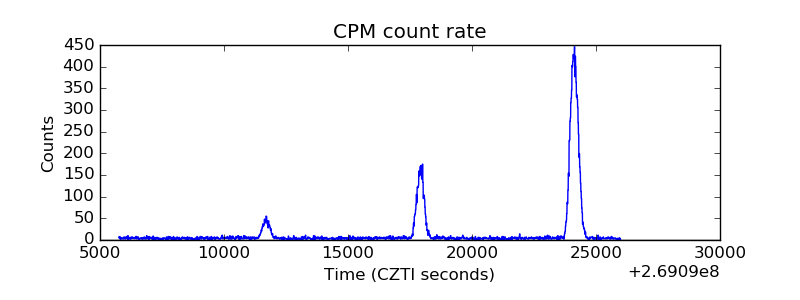 |
| CZT Counter |  |
| +2.5 Volts monitor |  |
| +5 Volts monitor | 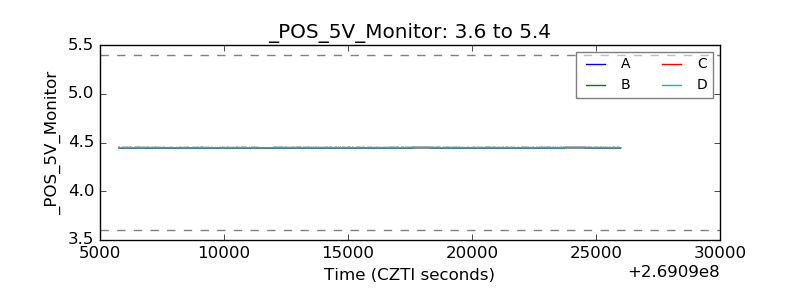 |
| _ROLL_ROT | 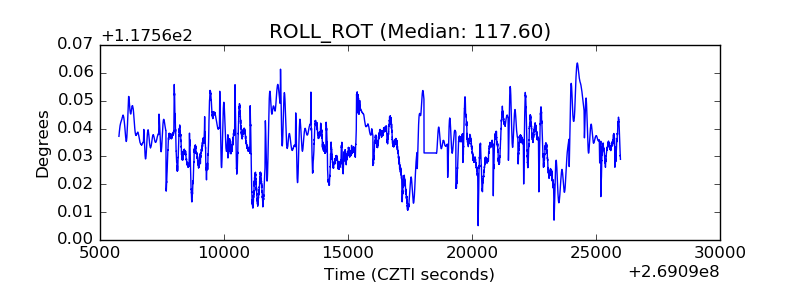 |
| _Roll_DEC | 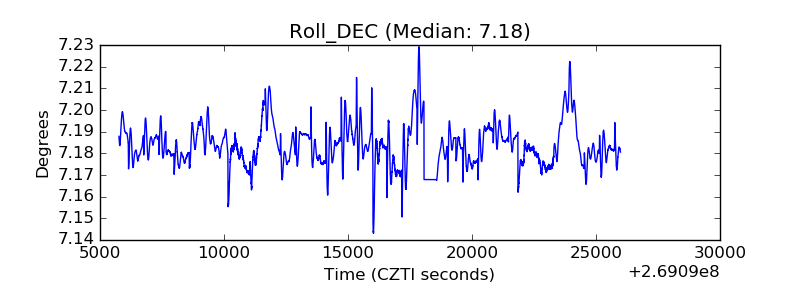 |
| _Roll_RA |  |
| Veto Counter | 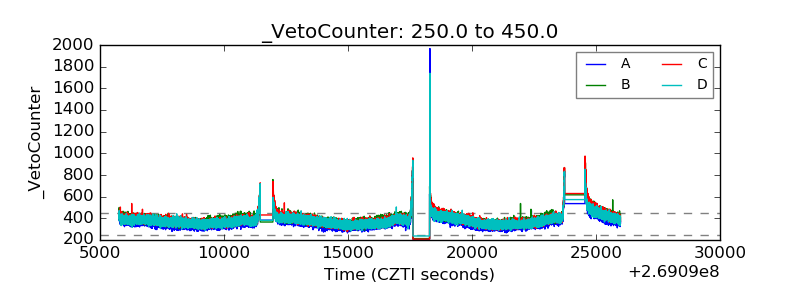 |