| Param | Original file | Final file |
|---|---|---|
| Filename | modeM0/AS1T02_060T01_9000002216_15077cztM0_level2.evt | modeM0/AS1T02_060T01_9000002216_15077cztM0_level2_quad_clean.evt |
| Size (bytes) | 167,166,720 | 45,797,760 |
| Size | 159.4 MB | 43.7 MB |
| Events in quadrant A | 1,092,315 | 309,590 |
| Events in quadrant B | 1,141,528 | 313,640 |
| Events in quadrant C | 1,559,026 | 300,876 |
| Events in quadrant D | 1,107,334 | 292,969 |
| Mode M0 | |||
|---|---|---|---|
| Quadrant | BADHDUFLAG | Total packets | Discarded packets |
| A | 0 | 4832 | 0 |
| B | 0 | 4956 | 0 |
| C | 0 | 6431 | 0 |
| D | 0 | 4923 | 0 |
| Mode SS | |||
|---|---|---|---|
| Quadrant | BADHDUFLAG | Total packets | Discarded packets |
| A | 0 | 46 | 0 |
| B | 0 | 46 | 0 |
| C | 0 | 46 | 0 |
| D | 0 | 46 | 0 |
| Quadrant | Total seconds | Saturated seconds | Saturation percentage |
|---|---|---|---|
| A | 2358 | 1 | 0.042409% |
| B | 2358 | 2 | 0.084818% |
| C | 2358 | 12 | 0.508906% |
| D | 2358 | 2 | 0.084818% |
Noise dominated data is calculated using 1-second bins in cleaned event files. If a bin has >2000 counts, and if more than 50% of those come from <1% of pixels, then it is considered to be noise-dominated and hence unusable.
| Quadrant | # 1 sec bins | Bins with >0 counts | Bins with >2000 counts | High rate bins dominated by noise | Noise dominated (total time) | Noise dominated (detector-on time) | Marked lightcurve |
|---|---|---|---|---|---|---|---|
| A | 2359 | 2359 | 0 | 0 | 0.00% | 0.00% | 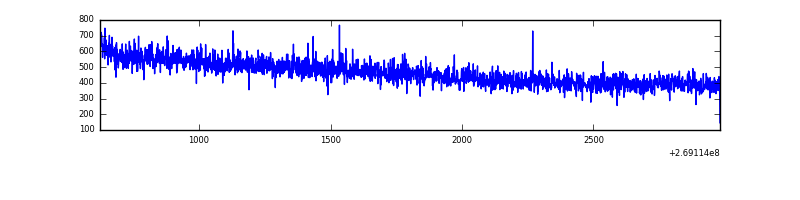 |
| B | 2359 | 2359 | 0 | 0 | 0.00% | 0.00% | 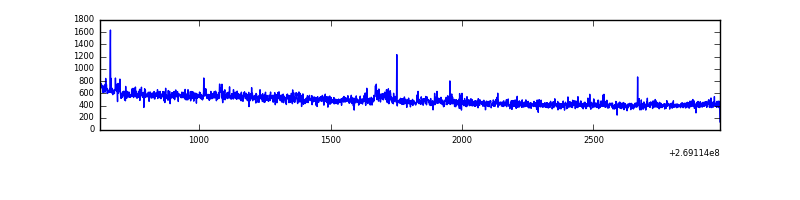 |
| C | 2359 | 2359 | 2 | 2 | 0.08% | 0.08% | 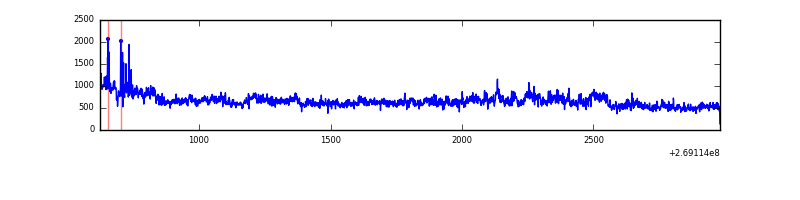 |
| D | 2359 | 2359 | 1 | 1 | 0.04% | 0.04% | 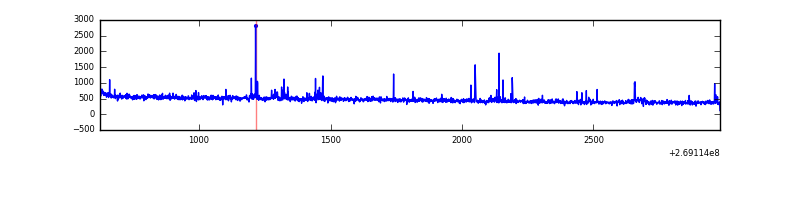 |
Top three noisy pixels from each quadrant. If the there are fewer than three noisy pixels in the level2.evt file, extra rows are filled as -1
| Pixel properties | Quadrant properties | ||||||
|---|---|---|---|---|---|---|---|
| Quadrant | DetID | PixID | Counts | Sigma | Mean | Median | Sigma |
| A | 0 | 226 | 2441 | 36.78 | 284 | 278 | 58.8 |
| A | 12 | 194 | 2084 | 30.71 | 284 | 278 | 58.8 |
| A | 3 | 137 | 1917 | 27.87 | 284 | 278 | 58.8 |
| B | 3 | 64 | 27148 | 482.29 | 282 | 276 | 55.7 |
| B | 12 | 111 | 6444 | 110.7 | 282 | 276 | 55.7 |
| B | 11 | 111 | 5605 | 95.64 | 282 | 276 | 55.7 |
| C | 3 | 233 | 463292 | 6970.53 | 279 | 280 | 66.4 |
| C | 3 | 232 | 2648 | 35.65 | 279 | 280 | 66.4 |
| C | 3 | 234 | 1944 | 25.05 | 279 | 280 | 66.4 |
| D | 13 | 249 | 33426 | 475.07 | 281 | 273 | 69.8 |
| D | 10 | 70 | 8988 | 124.88 | 281 | 273 | 69.8 |
| D | 2 | 234 | 7595 | 104.92 | 281 | 273 | 69.8 |
Histogram calculated using DETX and DETY for each event in the final _common_clean file
| Quadrant A |  |
 |
Quadrant B |
|---|---|---|---|
| Quadrant D |  |
 |
Quadrant C |
| Plot type | Count rate plots | Images |
|---|---|---|
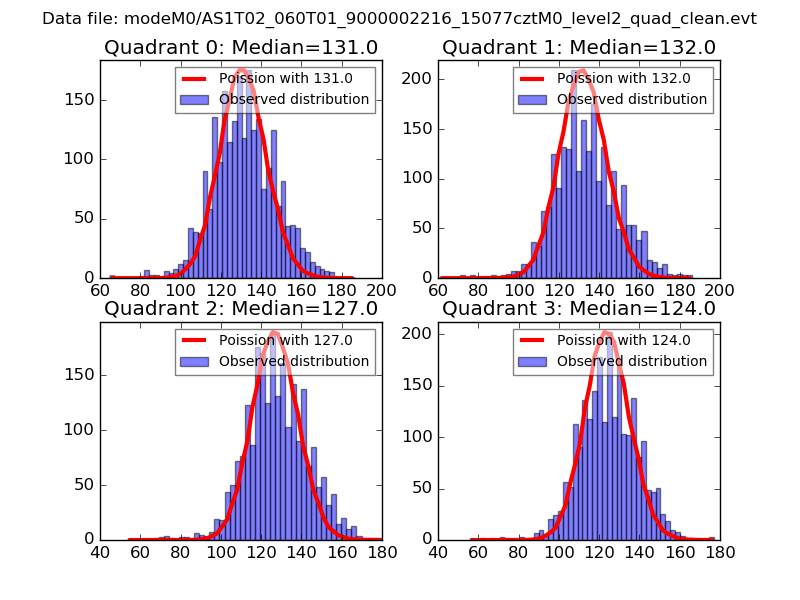
| Comparison with Poisson distribution Blue bars denote a histogram of data divided into 1 sec bins. Red curve is a Poisson curve with rate = median count rate of data. |
 |
 |
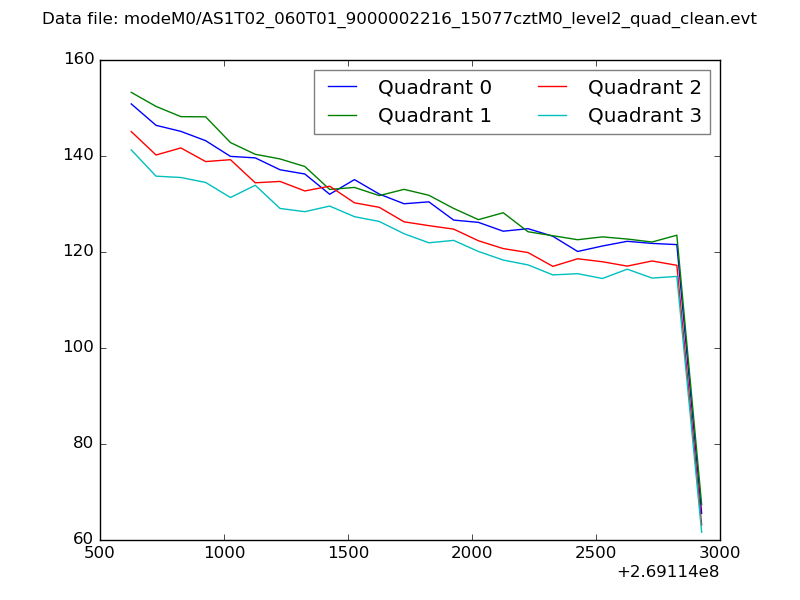
| Quadrant-wise count rates Data is divided into 100 sec bins |
 |
|
| Module-wise count rates for Quadrant A Data is divided into 100 sec bins |
 |
 |
| Module-wise count rates for Quadrant B Data is divided into 100 sec bins |
 |
 |
| Module-wise count rates for Quadrant C Data is divided into 100 sec bins |
 |
 |
| Module-wise count rates for Quadrant D Data is divided into 100 sec bins |
 |
 |
| Parameter | Plot |
|---|---|
| CZT HV Monitor |  |
| D_VDD |  |
| Temperature 1 |  |
| Veto HV Monitor |  |
| Veto LLD |  |
| Alpha Counter | 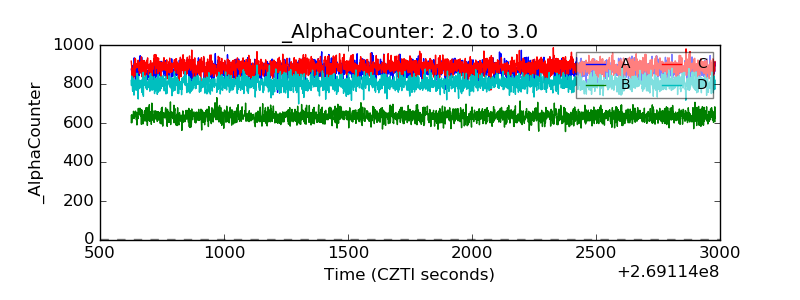 |
| _CPM_Rate | 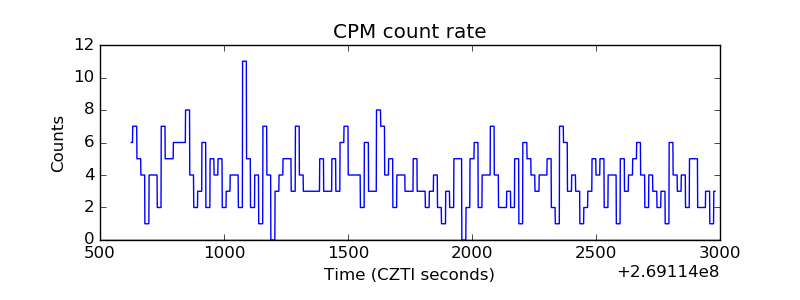 |
| CZT Counter |  |
| +2.5 Volts monitor |  |
| +5 Volts monitor |  |
| _ROLL_ROT |  |
| _Roll_DEC |  |
| _Roll_RA |  |
| Veto Counter |  |