| Param | Original file | Final file |
|---|---|---|
| Filename | modeM0/AS1T02_065T01_9000002218cztM0_level2.fits | modeM0/AS1T02_065T01_9000002218cztM0_level2_quad_clean.evt |
| Size (bytes) | 527,921,280 | 426,199,680 |
| Size | 503.5 MB | 406.5 MB |
| Events in quadrant A | 3,251,480 | 2,421,294 |
| Events in quadrant B | 3,133,102 | 2,421,905 |
| Events in quadrant C | 3,147,720 | 2,247,004 |
| Events in quadrant D | 2,737,810 | 2,097,986 |
| Mode M0 | |||
|---|---|---|---|
| Quadrant | BADHDUFLAG | Total packets | Discarded packets |
| A | 0 | 112523 | 0 |
| B | 0 | 115462 | 0 |
| C | 0 | 127760 | 0 |
| D | 0 | 118194 | 0 |
| Mode M9 | |||
|---|---|---|---|
| Quadrant | BADHDUFLAG | Total packets | Discarded packets |
| A | 0 | 92 | 0 |
| B | 0 | 92 | 0 |
| C | 0 | 92 | 0 |
| D | 0 | 92 | 0 |
| Mode SS | |||
|---|---|---|---|
| Quadrant | BADHDUFLAG | Total packets | Discarded packets |
| A | 0 | 1108 | 0 |
| B | 0 | 1108 | 0 |
| C | 0 | 1108 | 0 |
| D | 0 | 1108 | 0 |
| Quadrant | Total seconds | Saturated seconds | Saturation percentage |
|---|---|---|---|
| A | 54175 | 846 | 1.561606% |
| B | 54175 | 1047 | 1.932626% |
| C | 54175 | 706 | 1.303184% |
| D | 54175 | 1246 | 2.299954% |
Noise dominated data is calculated using 1-second bins in cleaned event files. If a bin has >2000 counts, and if more than 50% of those come from <1% of pixels, then it is considered to be noise-dominated and hence unusable.
| Quadrant | # 1 sec bins | Bins with >0 counts | Bins with >2000 counts | High rate bins dominated by noise | Noise dominated (total time) | Noise dominated (detector-on time) | Marked lightcurve |
|---|---|---|---|---|---|---|---|
| A | 63555 | 54174 | 0 | 0 | 0.00% | 0.00% | 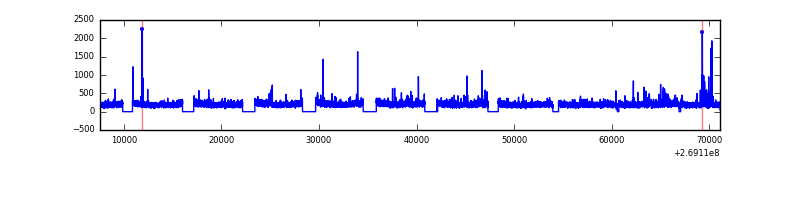 |
| B | 63555 | 54174 | 0 | 0 | 0.00% | 0.00% | 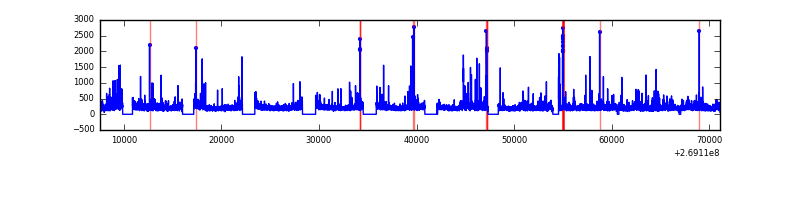 |
| C | 63555 | 54179 | 0 | 0 | 0.00% | 0.00% | 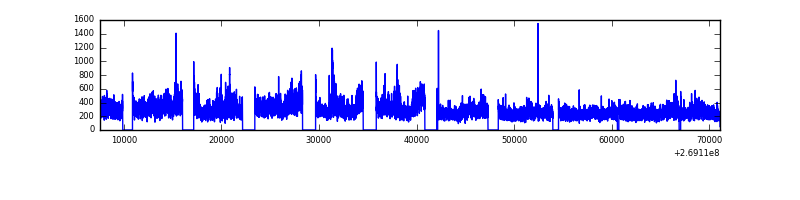 |
| D | 63555 | 54173 | 0 | 0 | 0.00% | 0.00% | 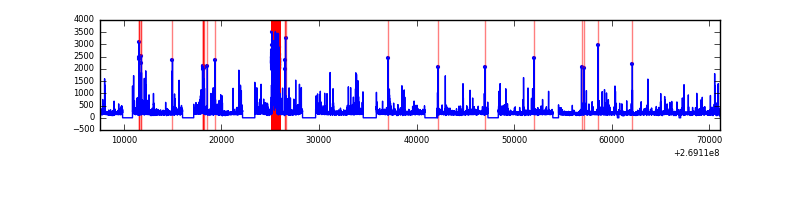 |
Top three noisy pixels from each quadrant. If the there are fewer than three noisy pixels in the level2.evt file, extra rows are filled as -1
| Pixel properties | Quadrant properties | ||||||
|---|---|---|---|---|---|---|---|
| Quadrant | DetID | PixID | Counts | Sigma | Mean | Median | Sigma |
| A | 0 | 29 | 3169 | 11.4 | 845 | 795 | 208.2 |
| A | 7 | 110 | 2574 | 8.55 | 845 | 795 | 208.2 |
| A | 9 | 19 | 2479 | 8.09 | 845 | 795 | 208.2 |
| B | 2 | 9 | 2696 | 11.7 | 827 | 791 | 162.8 |
| B | 5 | 128 | 2065 | 7.82 | 827 | 791 | 162.8 |
| B | 3 | 17 | 2056 | 7.77 | 827 | 791 | 162.8 |
| C | 12 | 241 | 2237 | 6.8 | 832 | 775 | 215.1 |
| C | 2 | 191 | 2048 | 5.92 | 832 | 775 | 215.1 |
| C | 3 | 126 | 2047 | 5.91 | 832 | 775 | 215.1 |
| D | 3 | 14 | 2060 | 6.38 | 782 | 711 | 211.5 |
| D | 6 | 231 | 2049 | 6.33 | 782 | 711 | 211.5 |
| D | 10 | 189 | 1948 | 5.85 | 782 | 711 | 211.5 |
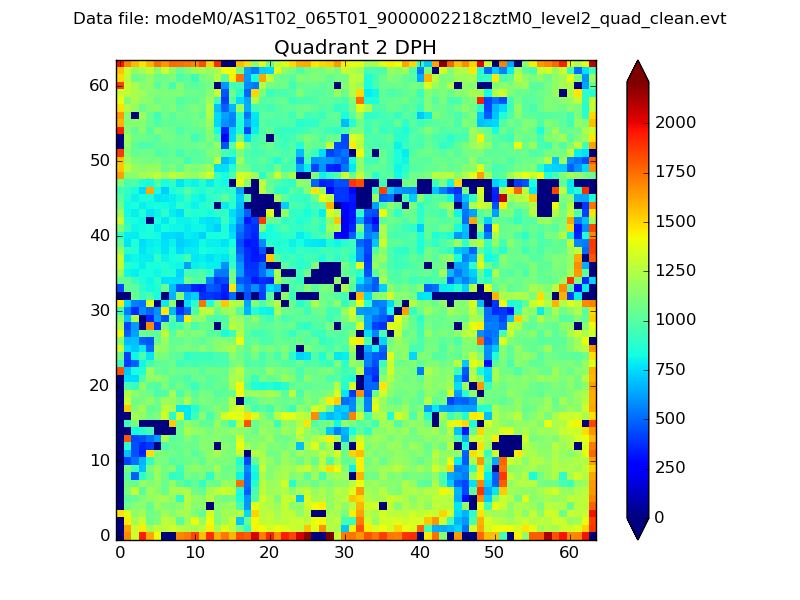
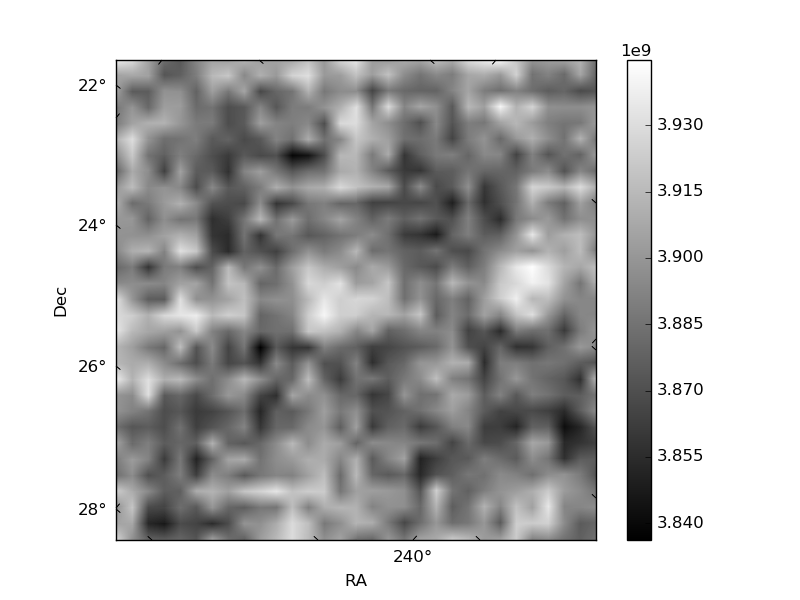
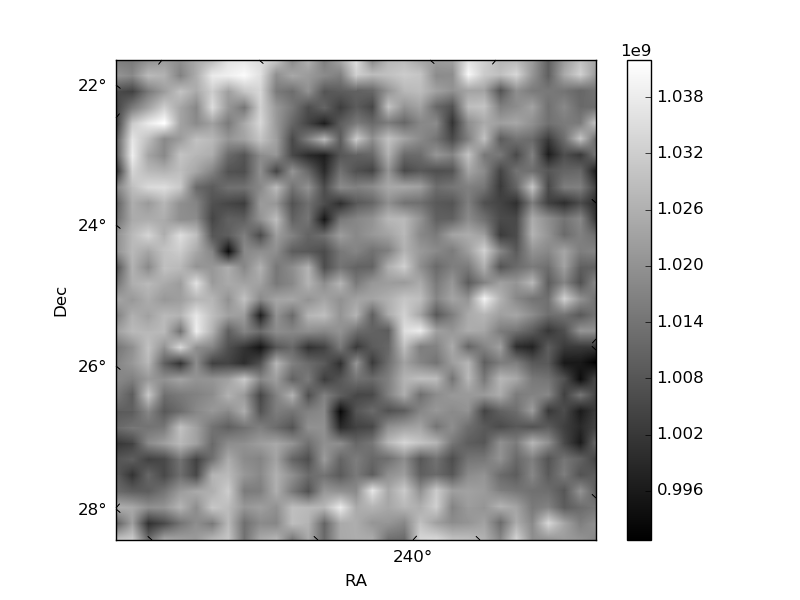
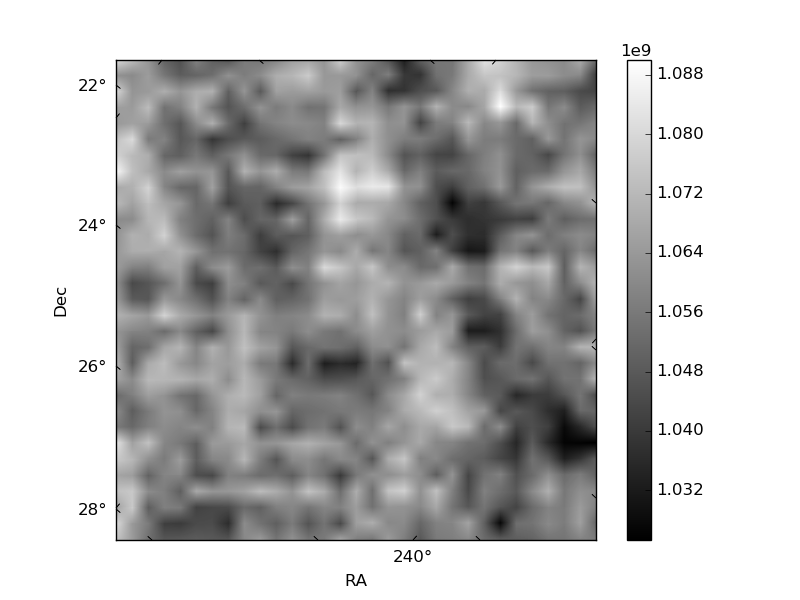
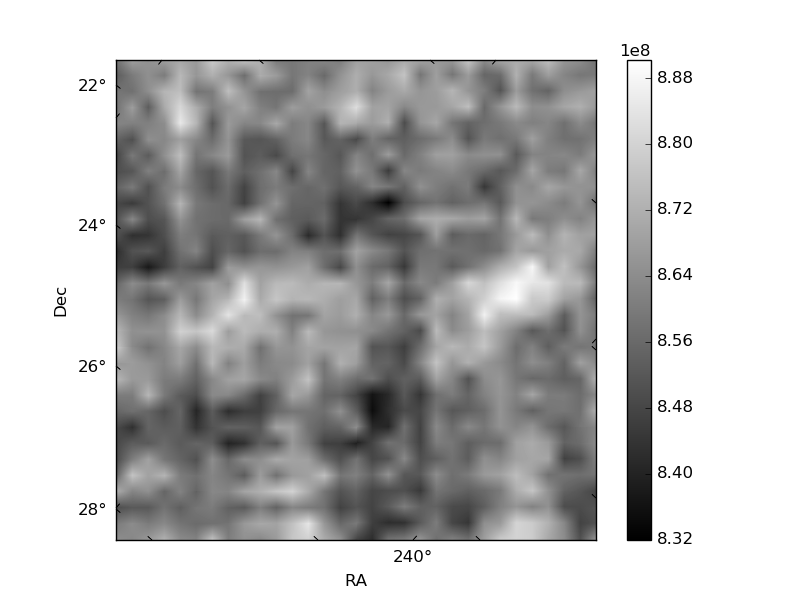
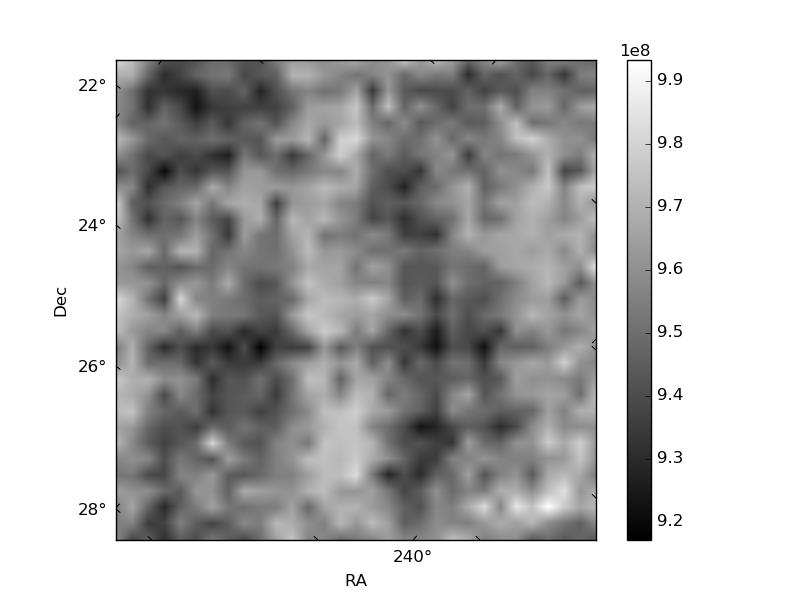
Histogram calculated using DETX and DETY for each event in the final _common_clean file
| Quadrant A | 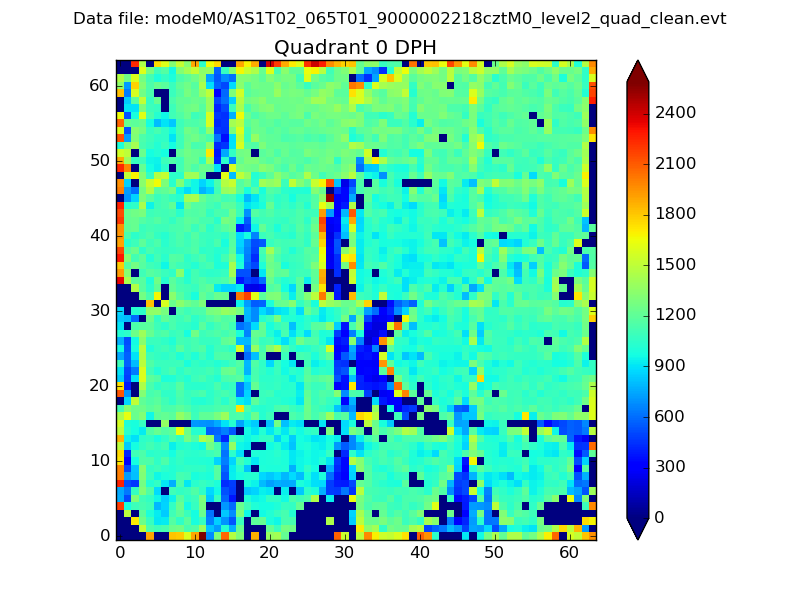 |
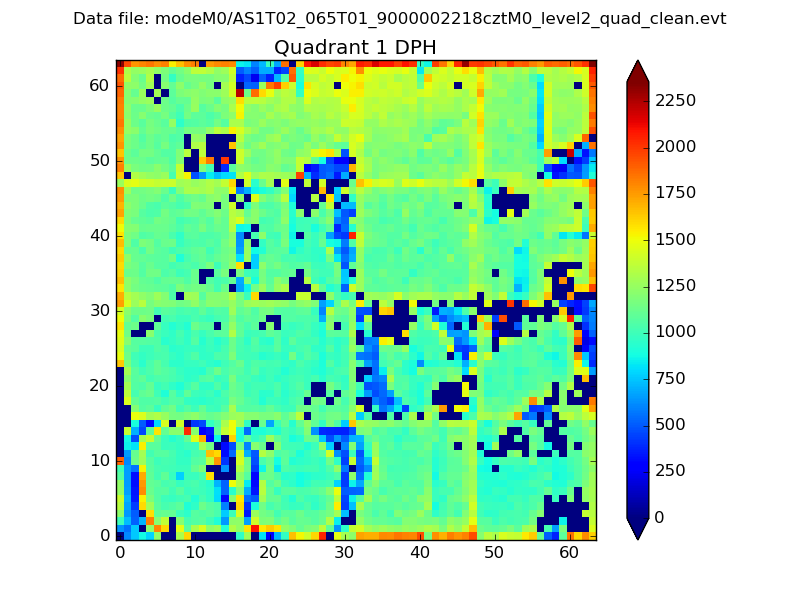 |
Quadrant B |
|---|---|---|---|
| Quadrant D | 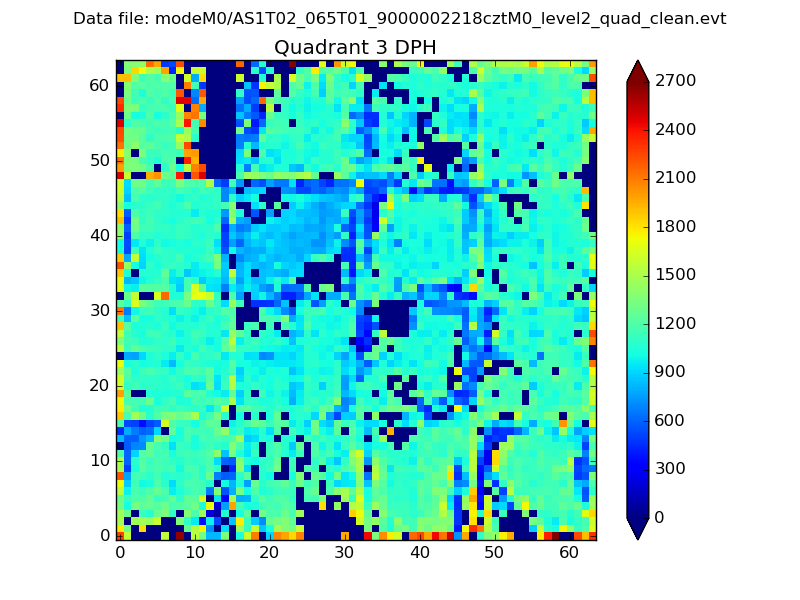 |
 |
Quadrant C |
| Plot type | Count rate plots | Images |
|---|---|---|
| Comparison with Poisson distribution Blue bars denote a histogram of data divided into 1 sec bins. Red curve is a Poisson curve with rate = median count rate of data. |
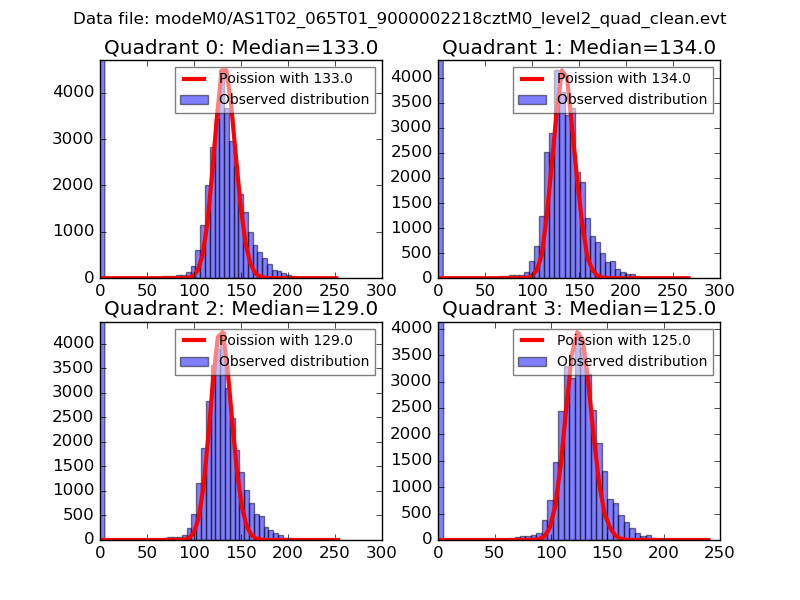 |
 |
| Quadrant-wise count rates Data is divided into 100 sec bins |
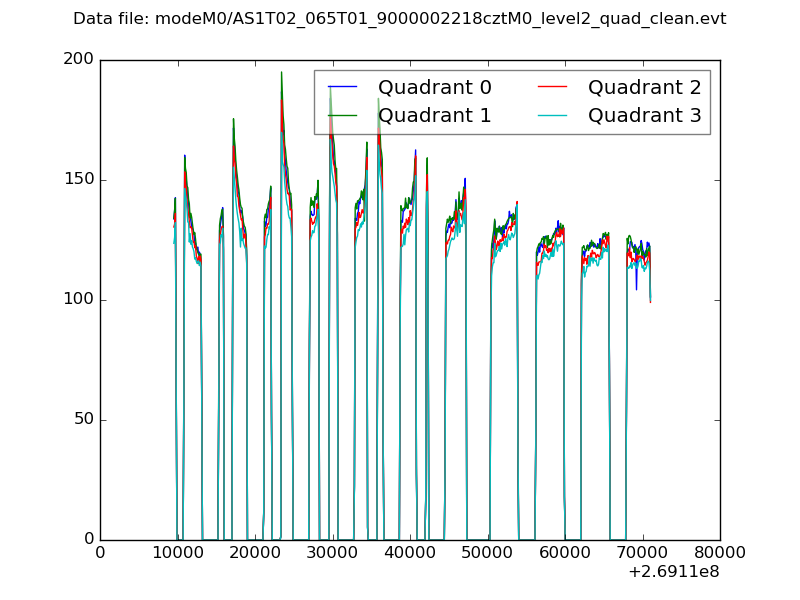 |
|
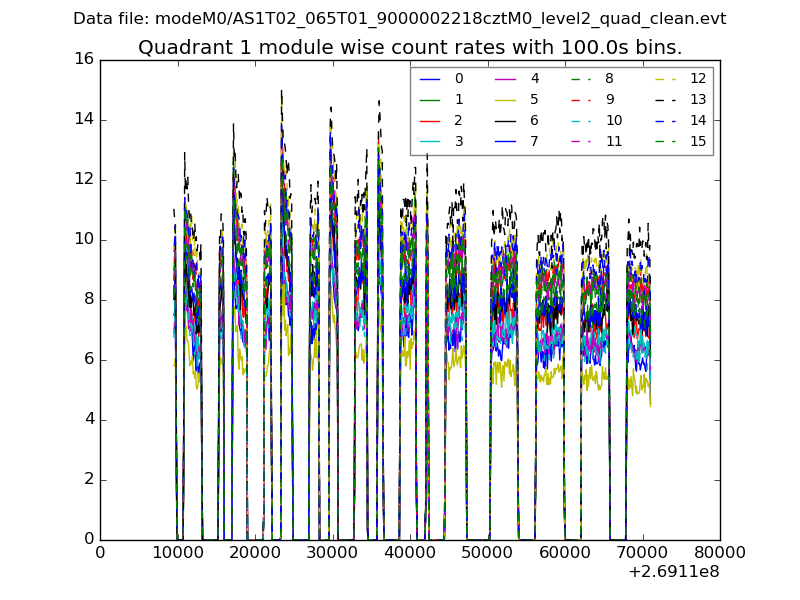
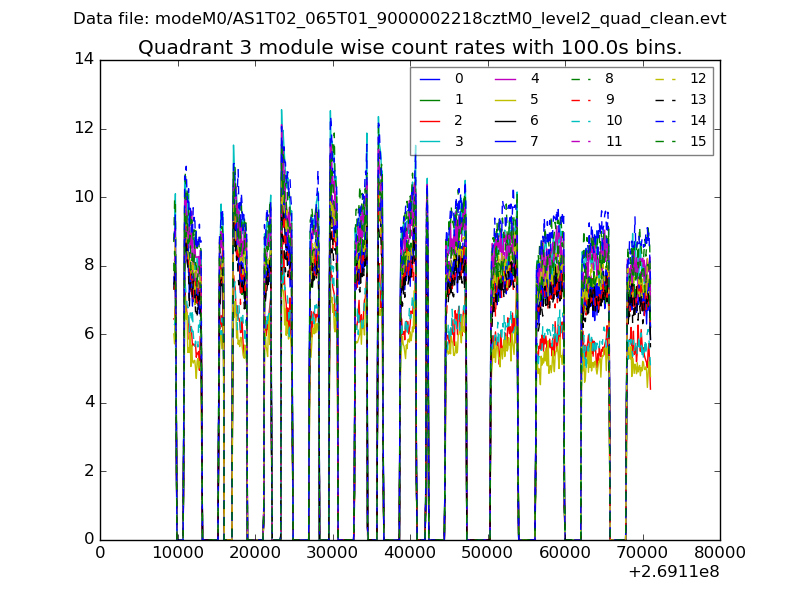
| Module-wise count rates for Quadrant A Data is divided into 100 sec bins |
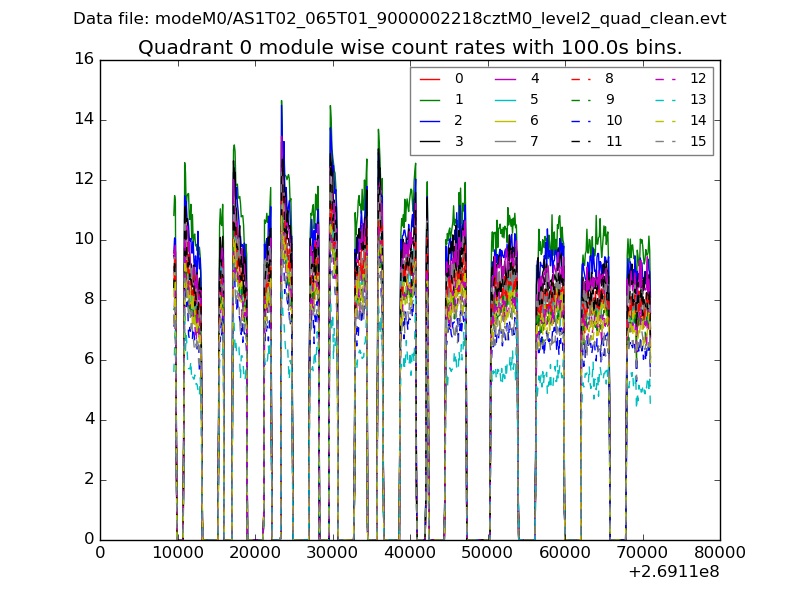 |
 |
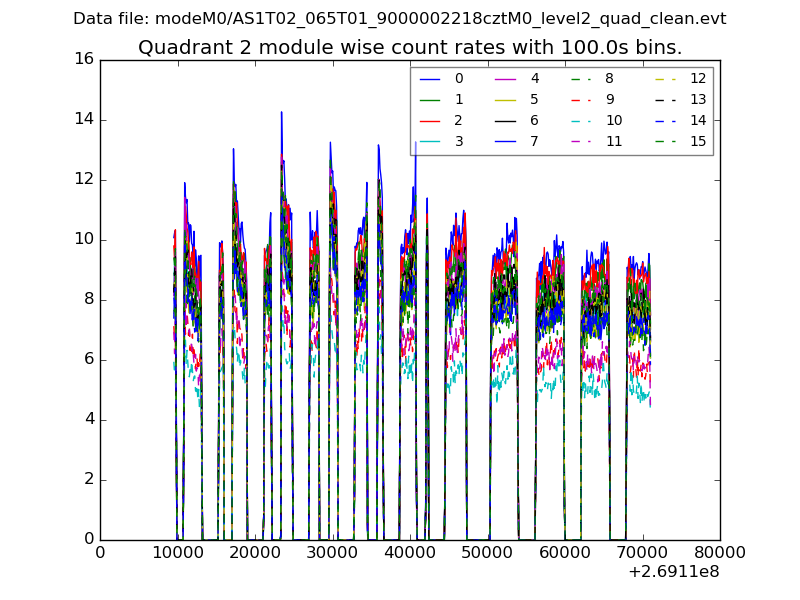
| Module-wise count rates for Quadrant B Data is divided into 100 sec bins |
 |
 |
| Module-wise count rates for Quadrant C Data is divided into 100 sec bins |
 |
 |
| Module-wise count rates for Quadrant D Data is divided into 100 sec bins |
 |
 |
| Parameter | Plot |
|---|---|
| CZT HV Monitor | 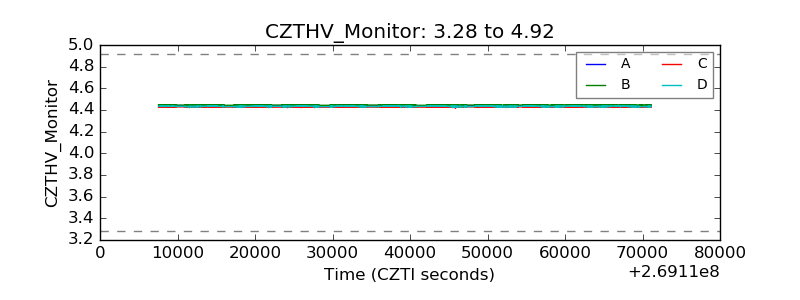 |
| D_VDD | 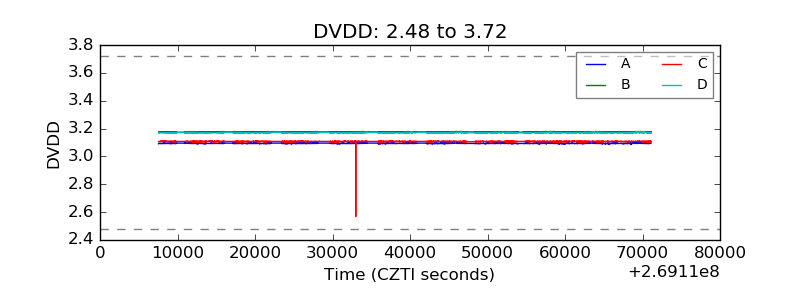 |
| Temperature 1 | 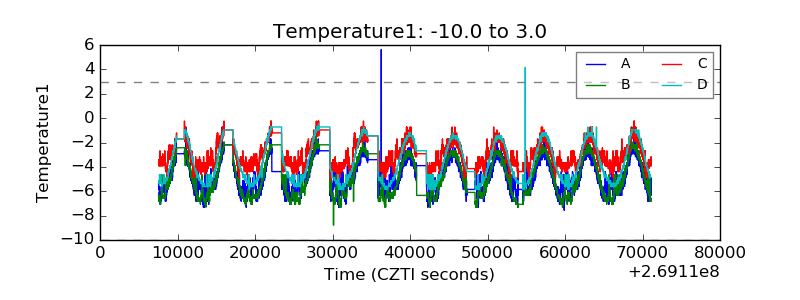 |
| Veto HV Monitor | 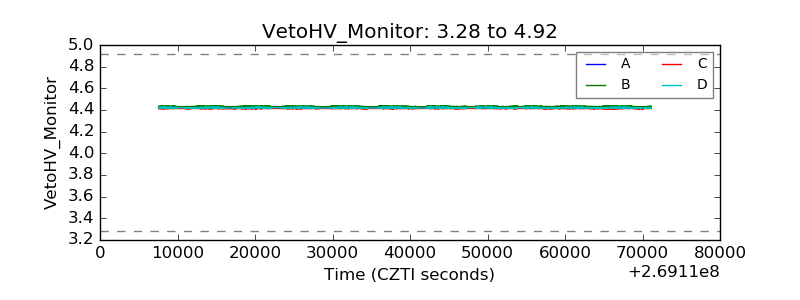 |
| Veto LLD | 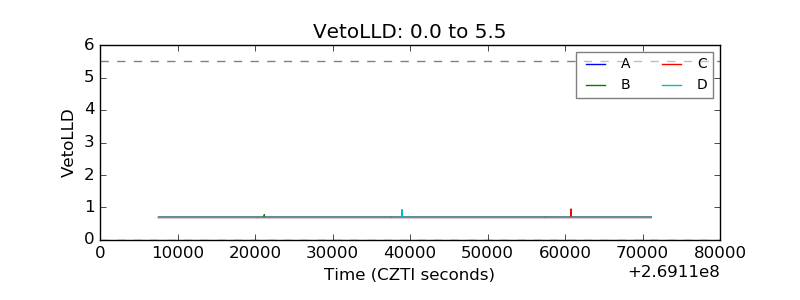 |
| Alpha Counter | 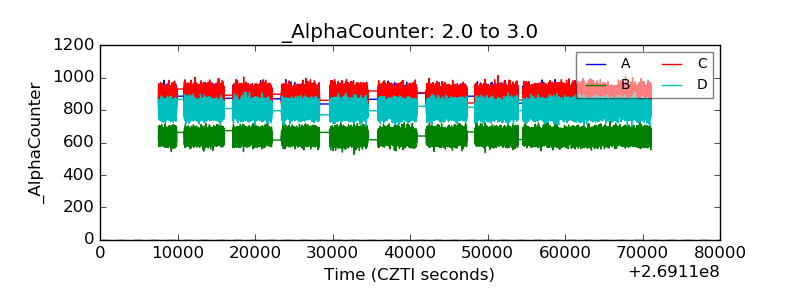 |
| _CPM_Rate | 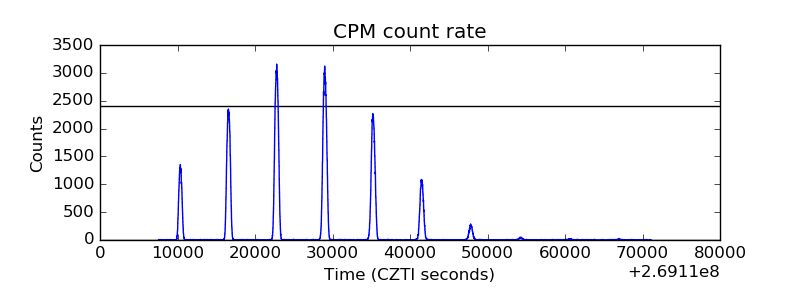 |
| CZT Counter | 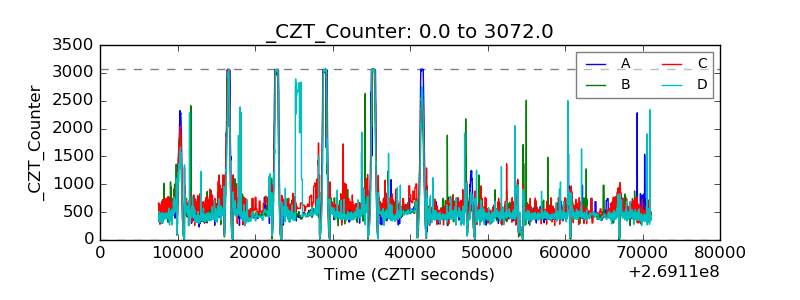 |
| +2.5 Volts monitor | 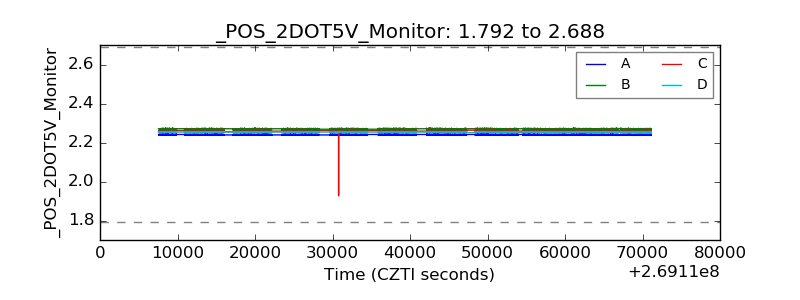 |
| +5 Volts monitor | 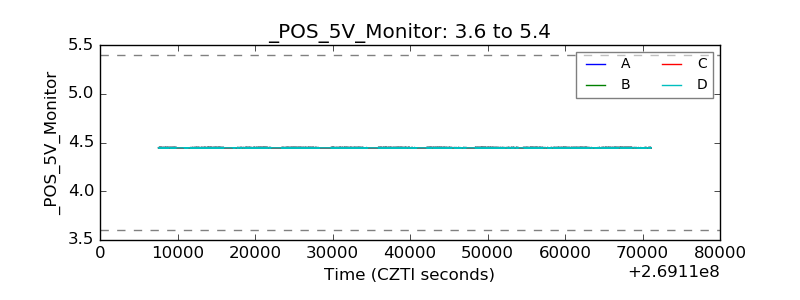 |
| _ROLL_ROT | 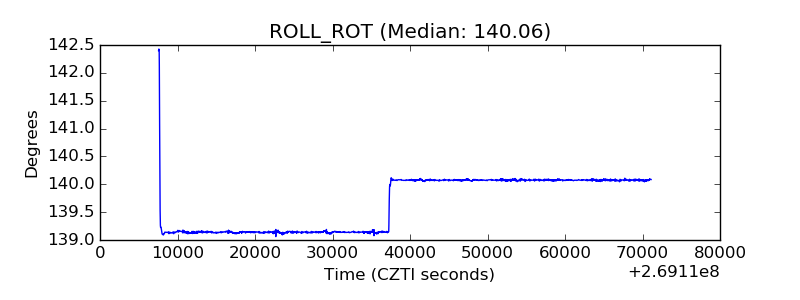 |
| _Roll_DEC | 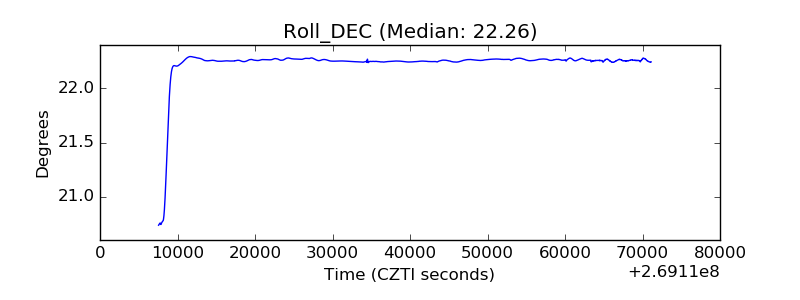 |
| _Roll_RA | 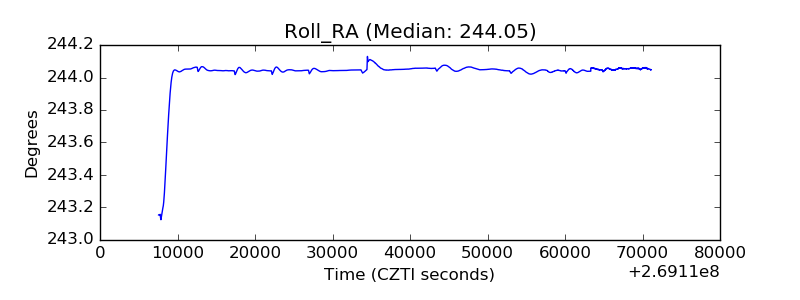 |
| Veto Counter | 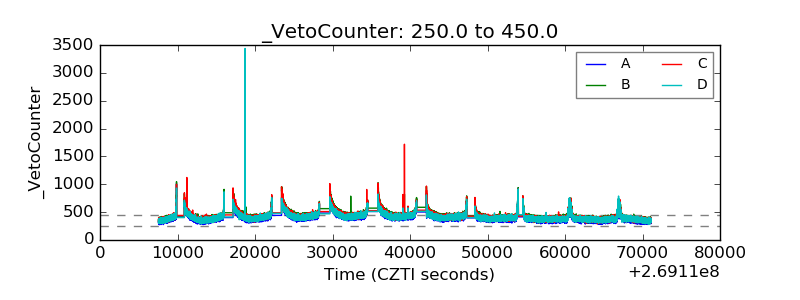 |