| Param | Original file | Final file |
|---|---|---|
| Filename | modeM0/AS1T02_065T01_9000002218_15077cztM0_level2.evt | modeM0/AS1T02_065T01_9000002218_15077cztM0_level2_quad_clean.evt |
| Size (bytes) | 261,737,280 | 38,304,000 |
| Size | 249.6 MB | 36.5 MB |
| Events in quadrant A | 1,758,422 | 230,468 |
| Events in quadrant B | 1,949,492 | 233,172 |
| Events in quadrant C | 2,187,965 | 224,418 |
| Events in quadrant D | 1,783,869 | 215,629 |
| Mode M0 | |||
|---|---|---|---|
| Quadrant | BADHDUFLAG | Total packets | Discarded packets |
| A | 0 | 7513 | 2 |
| B | 0 | 8080 | 1 |
| C | 0 | 8989 | 1 |
| D | 0 | 7783 | 1 |
| Mode M9 | |||
|---|---|---|---|
| Quadrant | BADHDUFLAG | Total packets | Discarded packets |
| A | 0 | 10 | 0 |
| B | 0 | 10 | 0 |
| C | 0 | 10 | 0 |
| D | 0 | 10 | 0 |
| Mode SS | |||
|---|---|---|---|
| Quadrant | BADHDUFLAG | Total packets | Discarded packets |
| A | 0 | 74 | 0 |
| B | 0 | 74 | 0 |
| C | 0 | 74 | 0 |
| D | 0 | 74 | 0 |
| Quadrant | Total seconds | Saturated seconds | Saturation percentage |
|---|---|---|---|
| A | 3613 | 40 | 1.107113% |
| B | 3613 | 50 | 1.383892% |
| C | 3613 | 38 | 1.051758% |
| D | 3613 | 49 | 1.356214% |
Noise dominated data is calculated using 1-second bins in cleaned event files. If a bin has >2000 counts, and if more than 50% of those come from <1% of pixels, then it is considered to be noise-dominated and hence unusable.
| Quadrant | # 1 sec bins | Bins with >0 counts | Bins with >2000 counts | High rate bins dominated by noise | Noise dominated (total time) | Noise dominated (detector-on time) | Marked lightcurve |
|---|---|---|---|---|---|---|---|
| A | 4624 | 3614 | 1 | 1 | 0.02% | 0.03% | 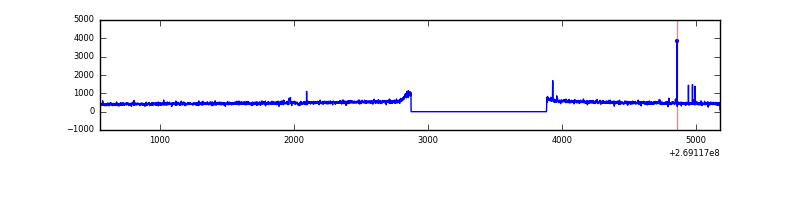 |
| B | 4624 | 3614 | 3 | 3 | 0.06% | 0.08% | 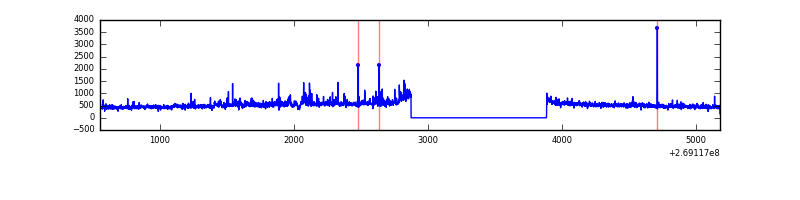 |
| C | 4624 | 3615 | 0 | 0 | 0.00% | 0.00% | 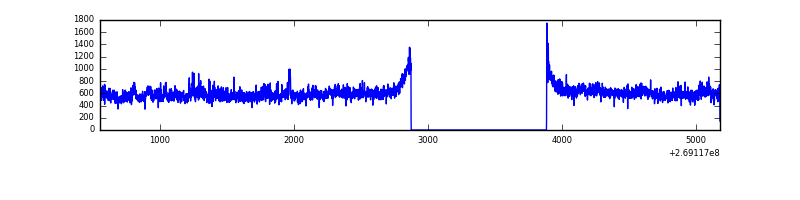 |
| D | 4624 | 3614 | 23 | 23 | 0.50% | 0.64% | 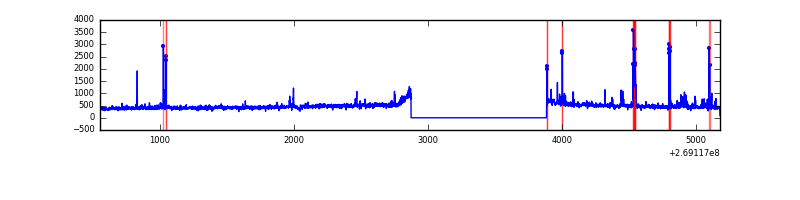 |
Top three noisy pixels from each quadrant. If the there are fewer than three noisy pixels in the level2.evt file, extra rows are filled as -1
| Pixel properties | Quadrant properties | ||||||
|---|---|---|---|---|---|---|---|
| Quadrant | DetID | PixID | Counts | Sigma | Mean | Median | Sigma |
| A | 13 | 248 | 12713 | 132.29 | 451 | 441 | 92.8 |
| A | 9 | 143 | 5094 | 50.16 | 451 | 441 | 92.8 |
| A | 13 | 252 | 5009 | 49.24 | 451 | 441 | 92.8 |
| B | 3 | 64 | 102885 | 1168.88 | 450 | 439 | 87.6 |
| B | 10 | 245 | 48372 | 546.9 | 450 | 439 | 87.6 |
| B | 4 | 80 | 12298 | 135.31 | 450 | 439 | 87.6 |
| C | 3 | 233 | 474277 | 4648.72 | 437 | 442 | 101.9 |
| C | 3 | 232 | 5313 | 47.79 | 437 | 442 | 101.9 |
| C | 13 | 61 | 3067 | 25.75 | 437 | 442 | 101.9 |
| D | 9 | 1 | 43622 | 403.58 | 435 | 422 | 107.0 |
| D | 2 | 120 | 33379 | 307.89 | 435 | 422 | 107.0 |
| D | 13 | 104 | 25921 | 238.21 | 435 | 422 | 107.0 |
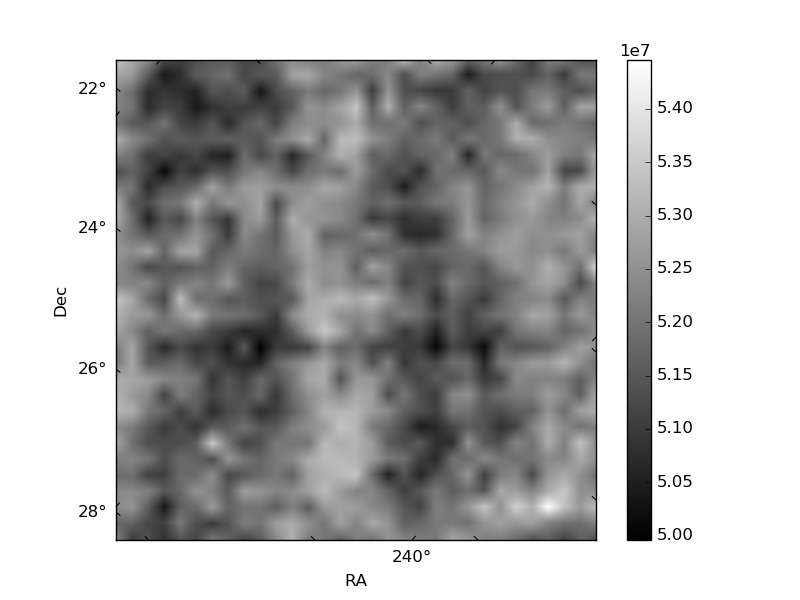
Histogram calculated using DETX and DETY for each event in the final _common_clean file
| Quadrant A | 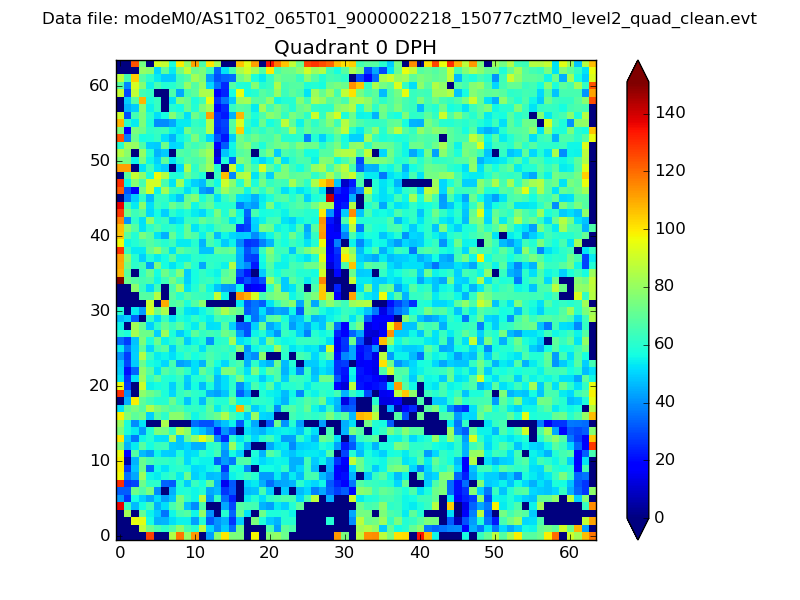 |
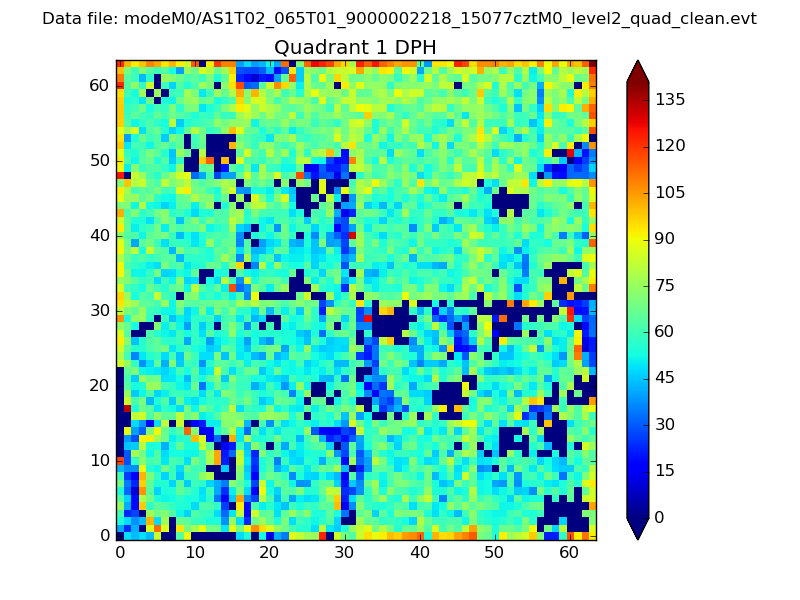 |
Quadrant B |
|---|---|---|---|
| Quadrant D |  |
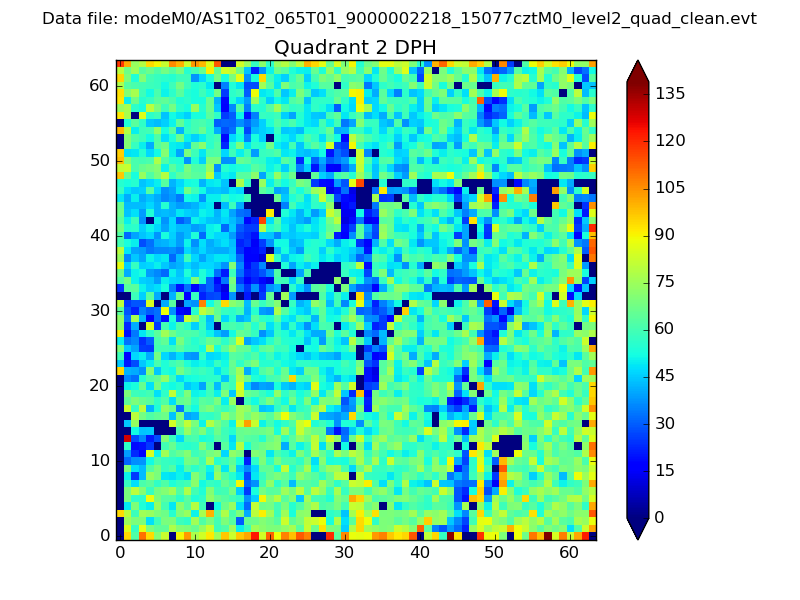 |
Quadrant C |
| Plot type | Count rate plots | Images |
|---|---|---|
| Comparison with Poisson distribution Blue bars denote a histogram of data divided into 1 sec bins. Red curve is a Poisson curve with rate = median count rate of data. |
 |
 |
| Quadrant-wise count rates Data is divided into 100 sec bins |
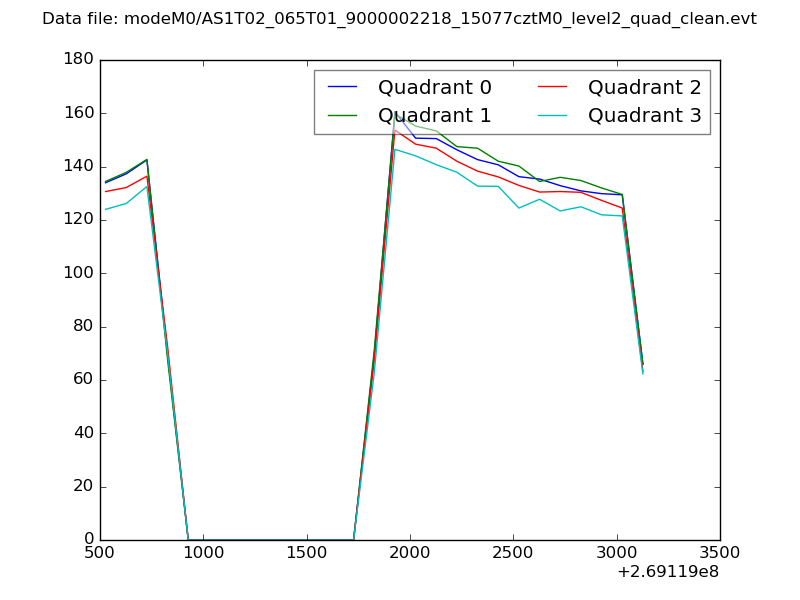 |
|
| Module-wise count rates for Quadrant A Data is divided into 100 sec bins |
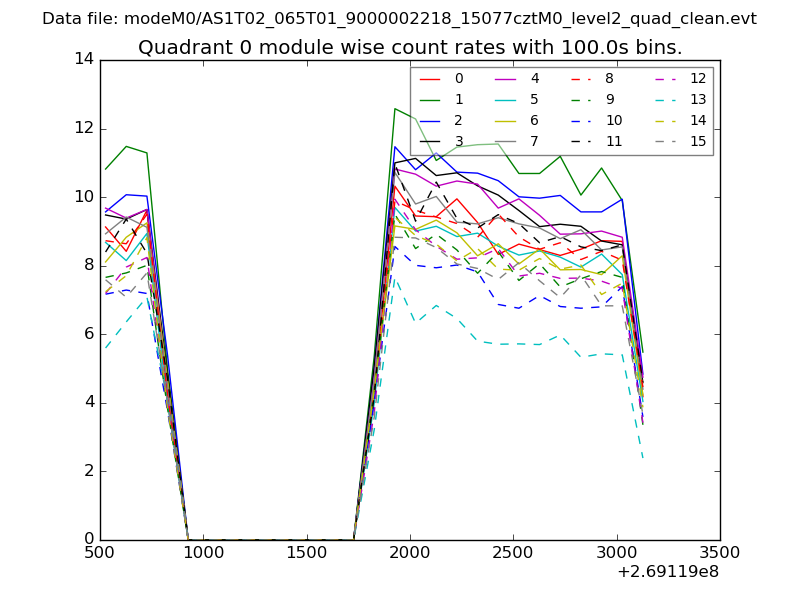 |
 |
| Module-wise count rates for Quadrant B Data is divided into 100 sec bins |
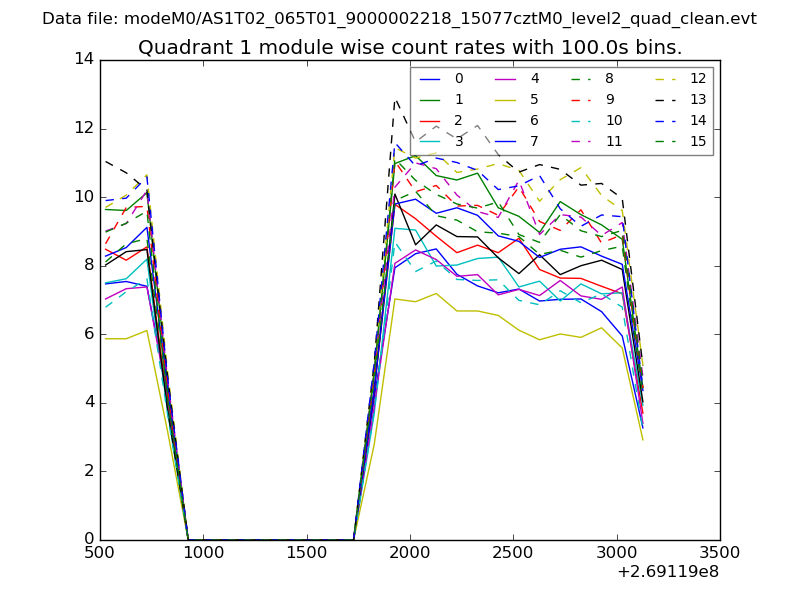 |
 |
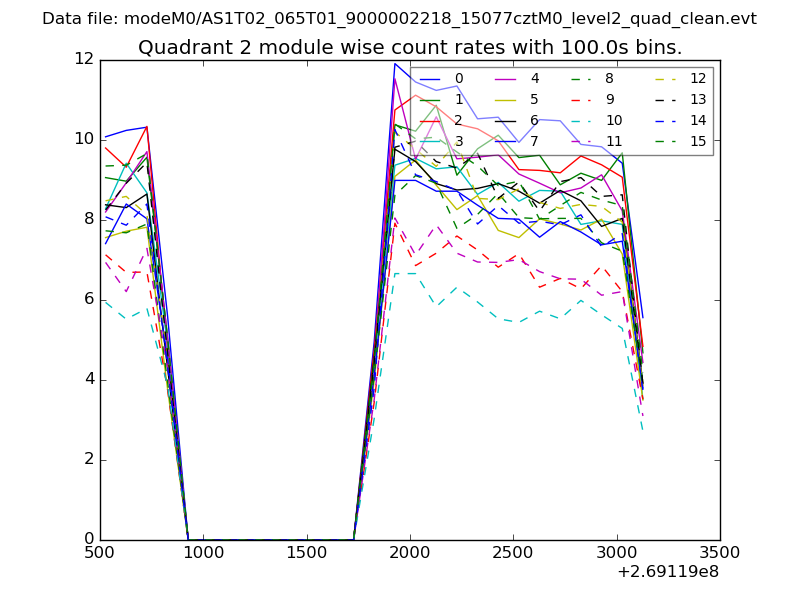
| Module-wise count rates for Quadrant C Data is divided into 100 sec bins |
 |
 |
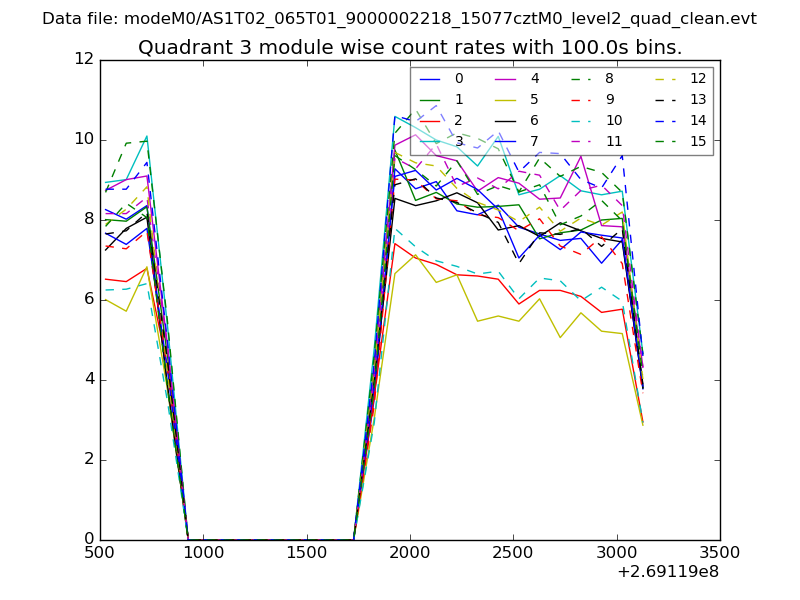
| Module-wise count rates for Quadrant D Data is divided into 100 sec bins |
 |
 |
| Parameter | Plot |
|---|---|
| CZT HV Monitor | 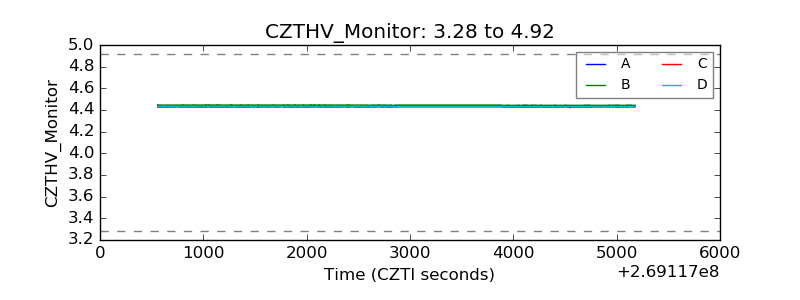 |
| D_VDD | 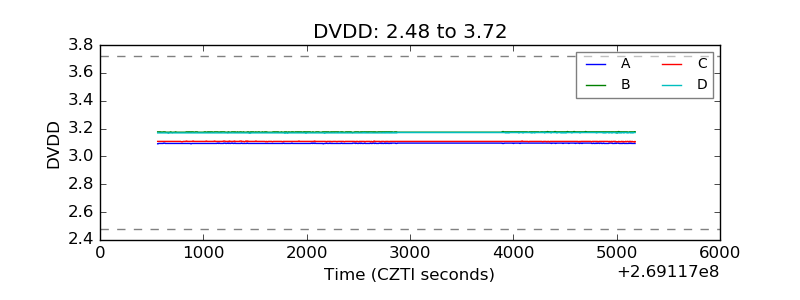 |
| Temperature 1 | 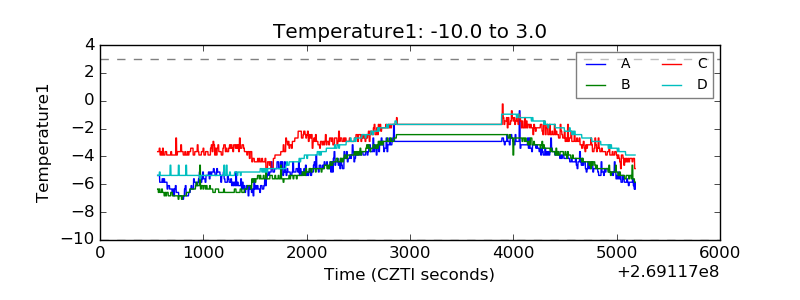 |
| Veto HV Monitor | 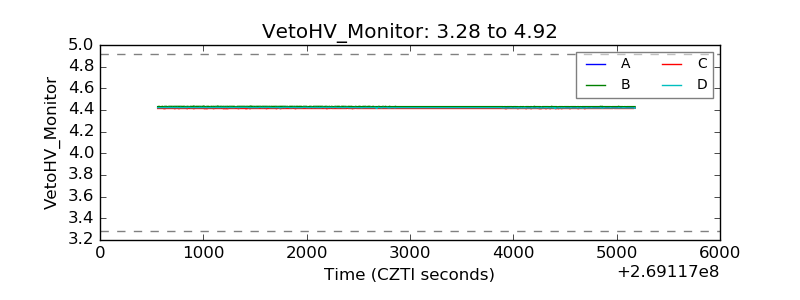 |
| Veto LLD | 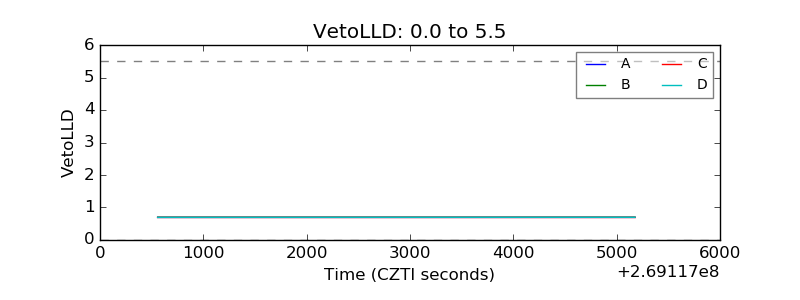 |
| Alpha Counter | 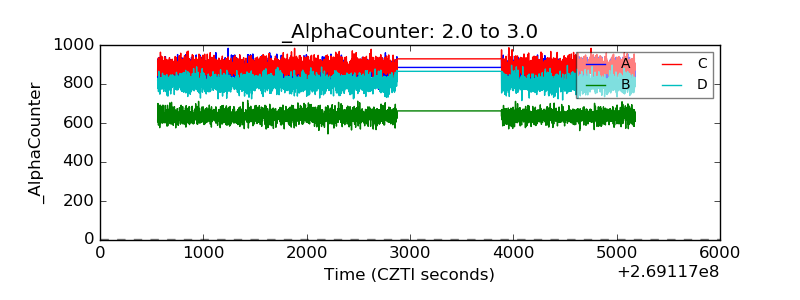 |
| _CPM_Rate | 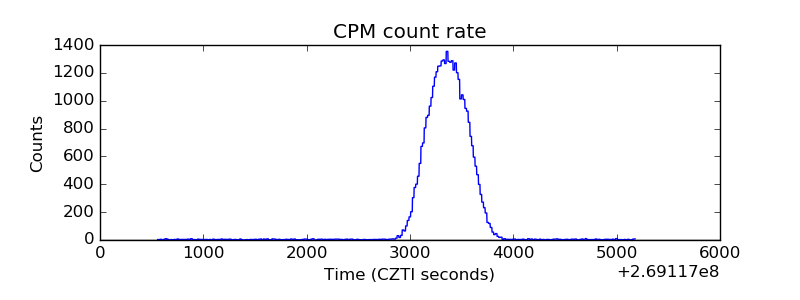 |
| CZT Counter | 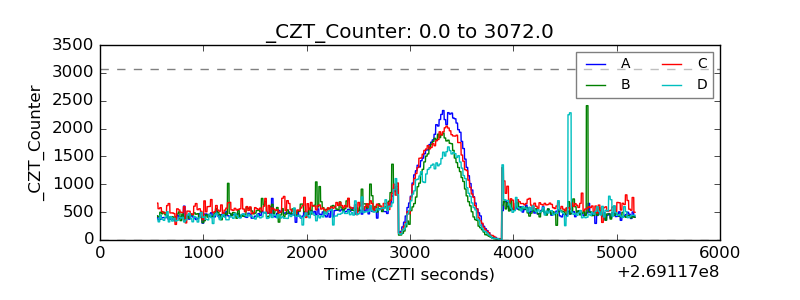 |
| +2.5 Volts monitor |  |
| +5 Volts monitor |  |
| _ROLL_ROT | 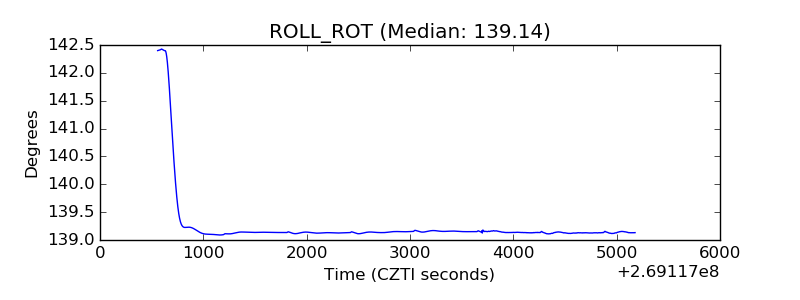 |
| _Roll_DEC | 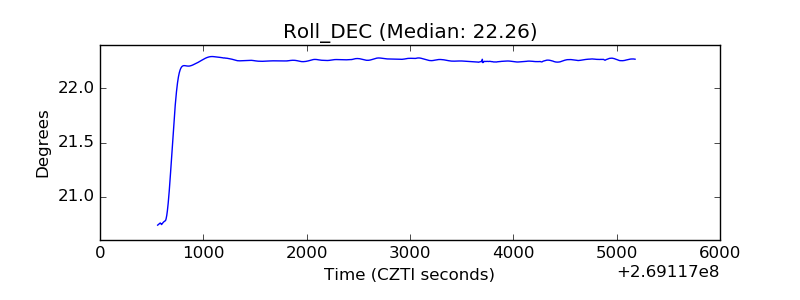 |
| _Roll_RA | 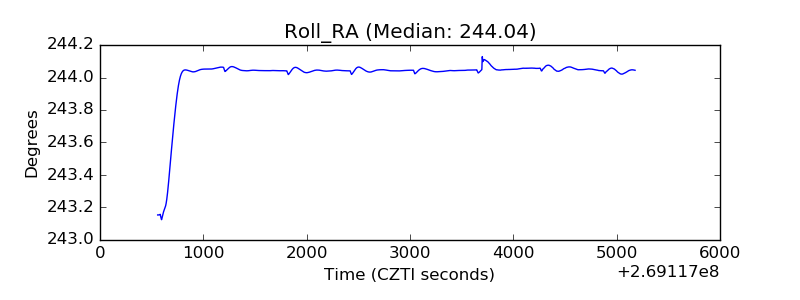 |
| Veto Counter | 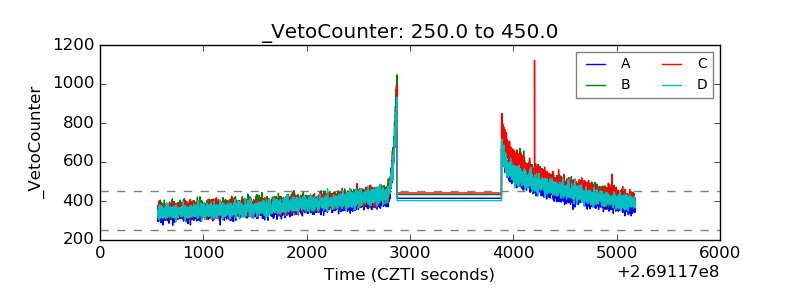 |