| Param | Original file | Final file |
|---|---|---|
| Filename | modeM0/AS1T02_065T01_9000002218_15078cztM0_level2.evt | modeM0/AS1T02_065T01_9000002218_15078cztM0_level2_quad_clean.evt |
| Size (bytes) | 455,673,600 | 90,083,520 |
| Size | 434.6 MB | 85.9 MB |
| Events in quadrant A | 3,000,763 | 580,405 |
| Events in quadrant B | 3,206,562 | 589,714 |
| Events in quadrant C | 4,018,810 | 566,443 |
| Events in quadrant D | 3,138,750 | 544,322 |
| Mode M0 | |||
|---|---|---|---|
| Quadrant | BADHDUFLAG | Total packets | Discarded packets |
| A | 0 | 13198 | 3 |
| B | 0 | 13668 | 2 |
| C | 0 | 16484 | 2 |
| D | 0 | 13847 | 2 |
| Mode M9 | |||
|---|---|---|---|
| Quadrant | BADHDUFLAG | Total packets | Discarded packets |
| A | 0 | 15 | 0 |
| B | 0 | 15 | 0 |
| C | 0 | 15 | 0 |
| D | 0 | 16 | 0 |
| Mode SS | |||
|---|---|---|---|
| Quadrant | BADHDUFLAG | Total packets | Discarded packets |
| A | 0 | 132 | 0 |
| B | 0 | 132 | 0 |
| C | 0 | 132 | 0 |
| D | 0 | 132 | 0 |
| Quadrant | Total seconds | Saturated seconds | Saturation percentage |
|---|---|---|---|
| A | 6402 | 30 | 0.468604% |
| B | 6402 | 46 | 0.718525% |
| C | 6402 | 32 | 0.499844% |
| D | 6402 | 49 | 0.765386% |
Noise dominated data is calculated using 1-second bins in cleaned event files. If a bin has >2000 counts, and if more than 50% of those come from <1% of pixels, then it is considered to be noise-dominated and hence unusable.
| Quadrant | # 1 sec bins | Bins with >0 counts | Bins with >2000 counts | High rate bins dominated by noise | Noise dominated (total time) | Noise dominated (detector-on time) | Marked lightcurve |
|---|---|---|---|---|---|---|---|
| A | 7553 | 6404 | 1 | 1 | 0.01% | 0.02% | 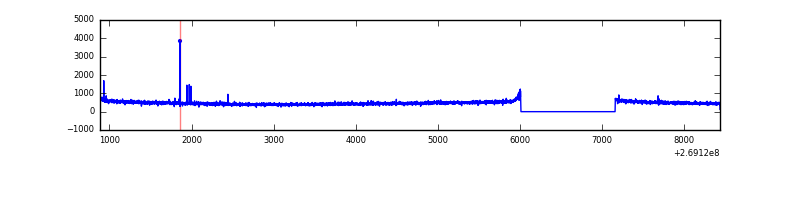 |
| B | 7553 | 6404 | 4 | 4 | 0.05% | 0.06% | 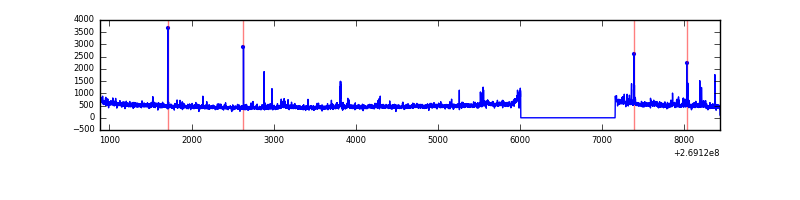 |
| C | 7553 | 6403 | 1 | 1 | 0.01% | 0.02% | 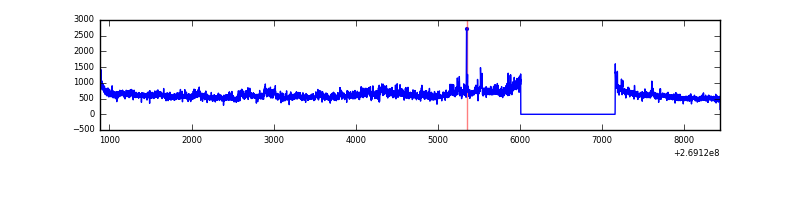 |
| D | 7553 | 6404 | 45 | 45 | 0.60% | 0.70% | 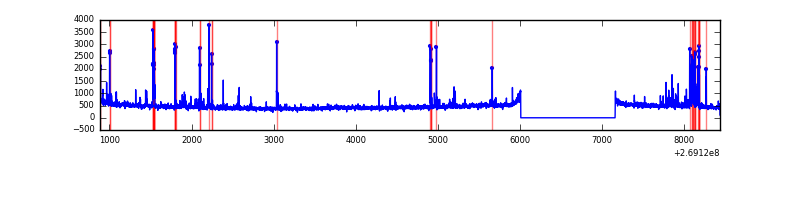 |
Top three noisy pixels from each quadrant. If the there are fewer than three noisy pixels in the level2.evt file, extra rows are filled as -1
| Pixel properties | Quadrant properties | ||||||
|---|---|---|---|---|---|---|---|
| Quadrant | DetID | PixID | Counts | Sigma | Mean | Median | Sigma |
| A | 13 | 248 | 13227 | 79.91 | 773 | 758 | 156.0 |
| A | 0 | 226 | 6958 | 39.73 | 773 | 758 | 156.0 |
| A | 12 | 194 | 5838 | 32.56 | 773 | 758 | 156.0 |
| B | 3 | 64 | 57409 | 385.01 | 777 | 757 | 147.1 |
| B | 10 | 245 | 51679 | 346.07 | 777 | 757 | 147.1 |
| B | 3 | 209 | 19686 | 128.64 | 777 | 757 | 147.1 |
| C | 3 | 233 | 1074792 | 6182.69 | 753 | 757 | 173.7 |
| C | 3 | 232 | 6080 | 30.64 | 753 | 757 | 173.7 |
| C | 13 | 61 | 5381 | 26.62 | 753 | 757 | 173.7 |
| D | 9 | 1 | 145589 | 794.17 | 748 | 727 | 182.4 |
| D | 2 | 120 | 51812 | 280.06 | 748 | 727 | 182.4 |
| D | 13 | 249 | 35514 | 190.71 | 748 | 727 | 182.4 |
Histogram calculated using DETX and DETY for each event in the final _common_clean file
| Quadrant A |  |
 |
Quadrant B |
|---|---|---|---|
| Quadrant D | 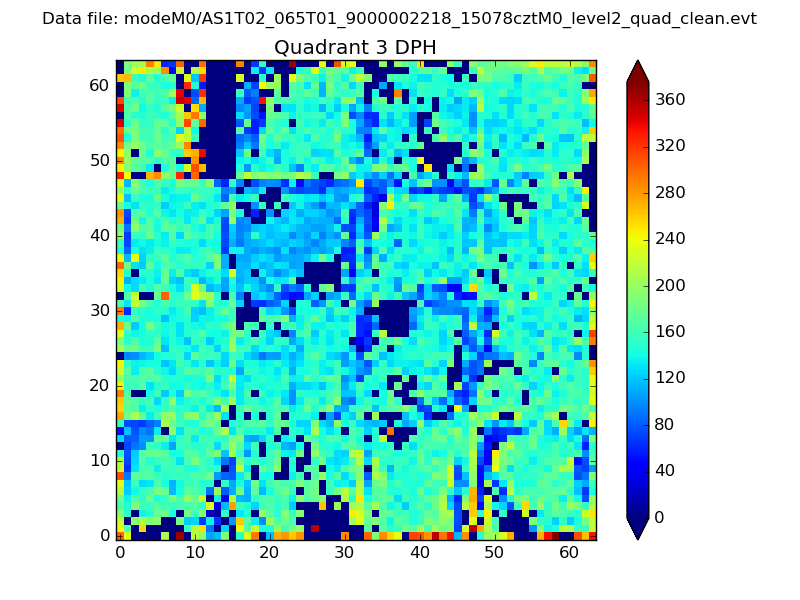 |
 |
Quadrant C |
| Plot type | Count rate plots | Images |
|---|---|---|
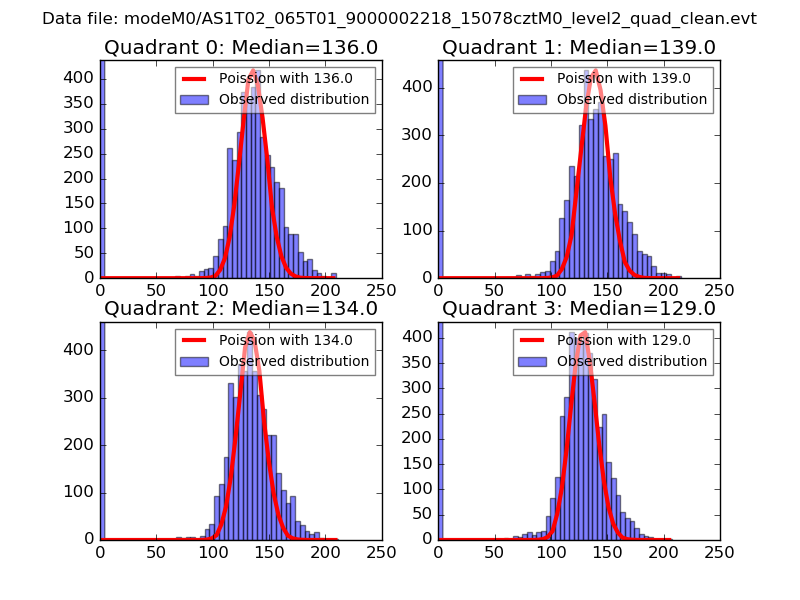
| Comparison with Poisson distribution Blue bars denote a histogram of data divided into 1 sec bins. Red curve is a Poisson curve with rate = median count rate of data. |
 |
 |
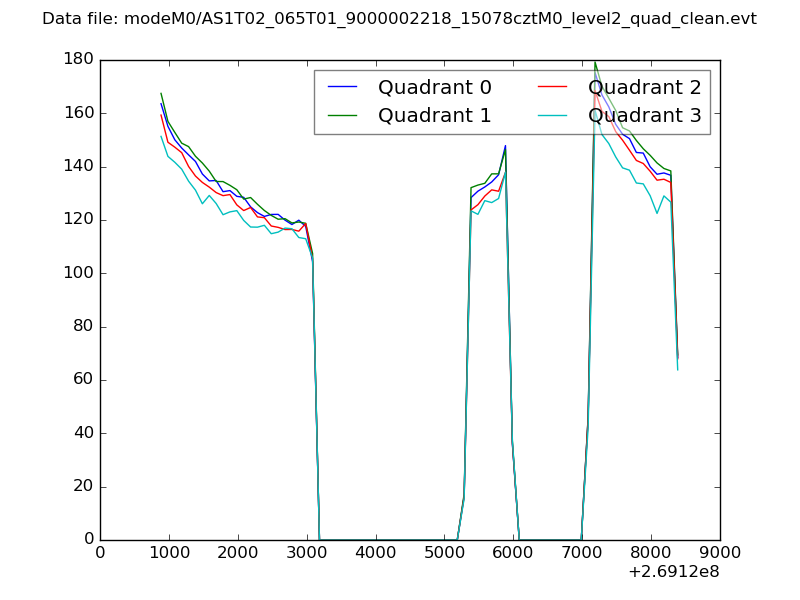
| Quadrant-wise count rates Data is divided into 100 sec bins |
 |
|
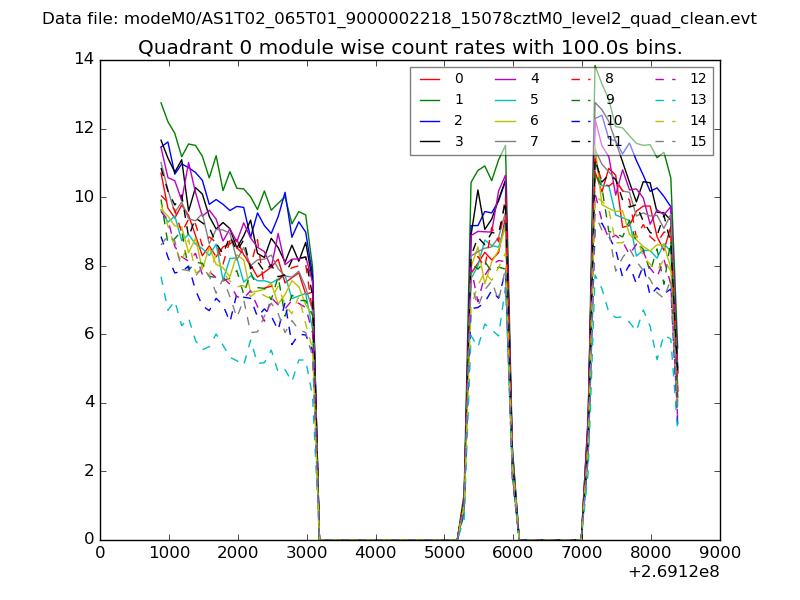
| Module-wise count rates for Quadrant A Data is divided into 100 sec bins |
 |
 |
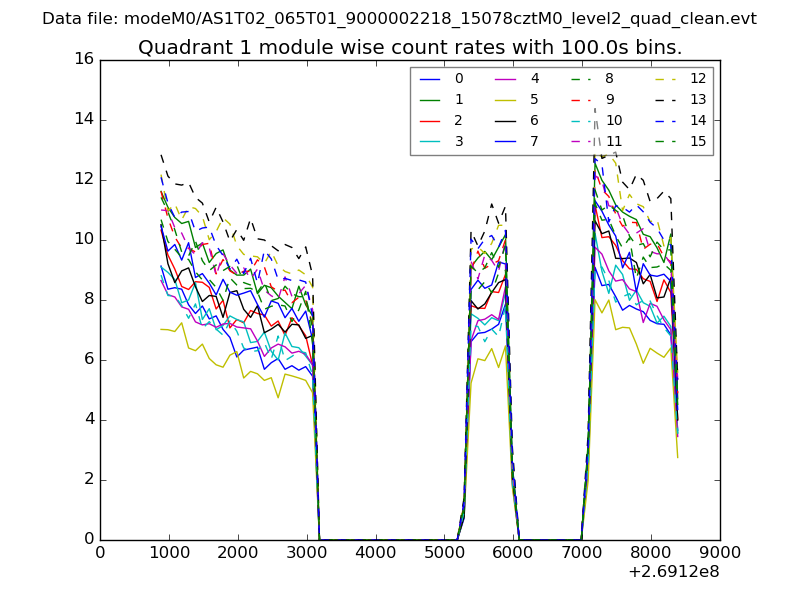
| Module-wise count rates for Quadrant B Data is divided into 100 sec bins |
 |
 |
| Module-wise count rates for Quadrant C Data is divided into 100 sec bins |
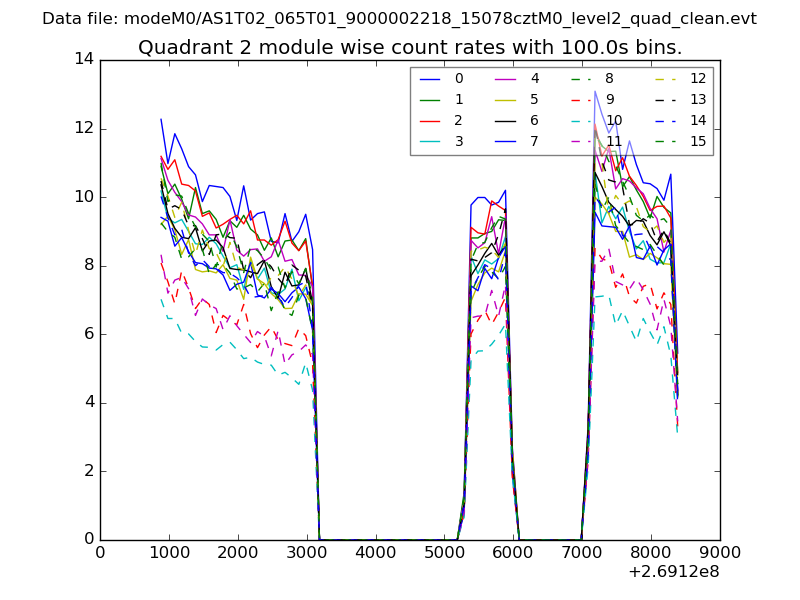 |
 |
| Module-wise count rates for Quadrant D Data is divided into 100 sec bins |
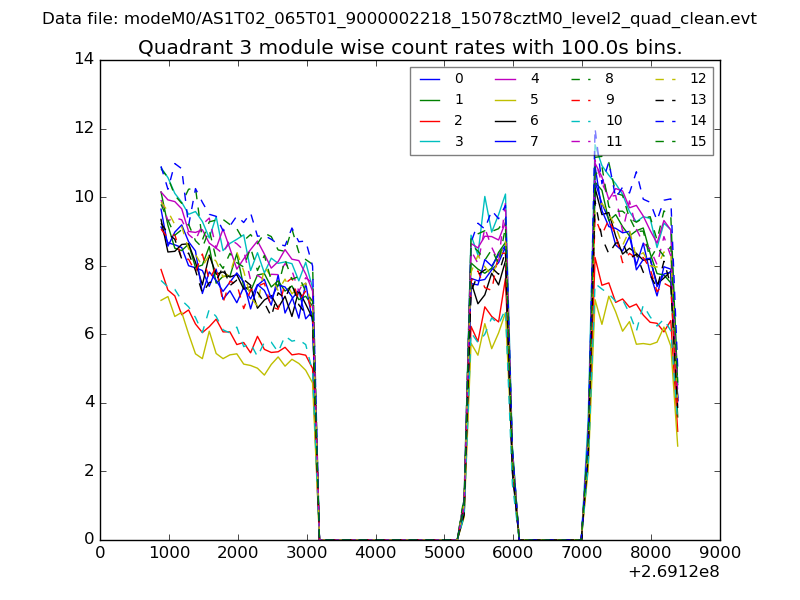 |
 |
| Parameter | Plot |
|---|---|
| CZT HV Monitor | 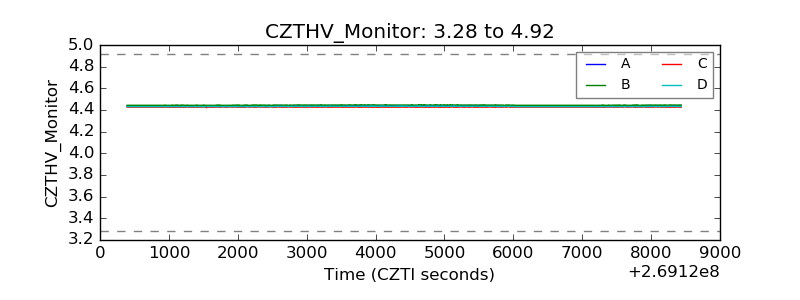 |
| D_VDD | 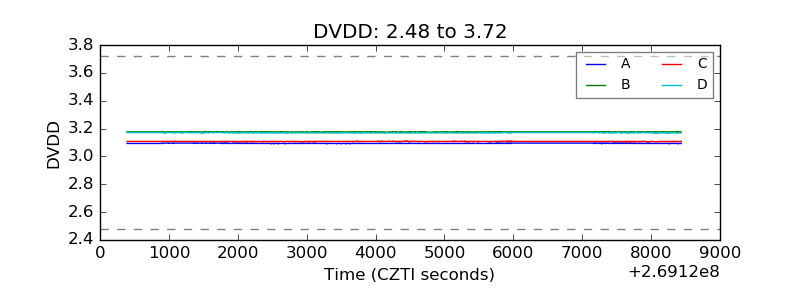 |
| Temperature 1 | 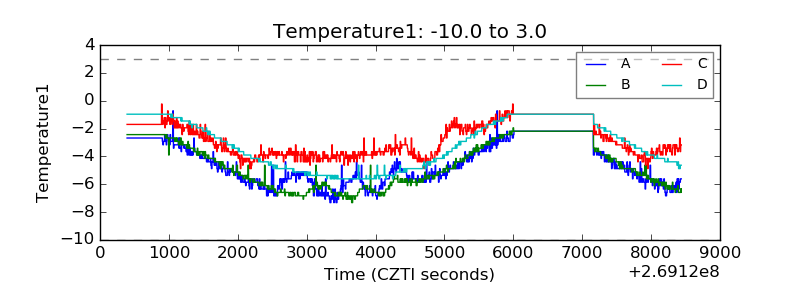 |
| Veto HV Monitor | 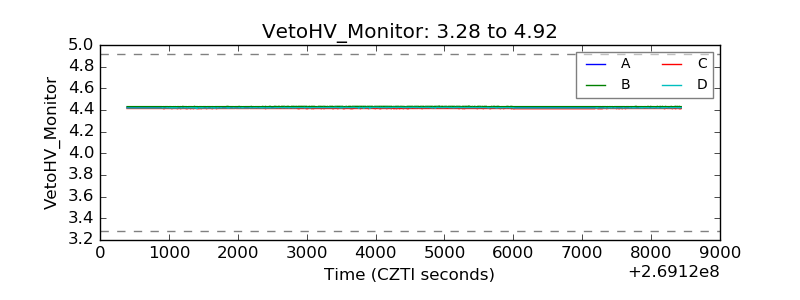 |
| Veto LLD |  |
| Alpha Counter | 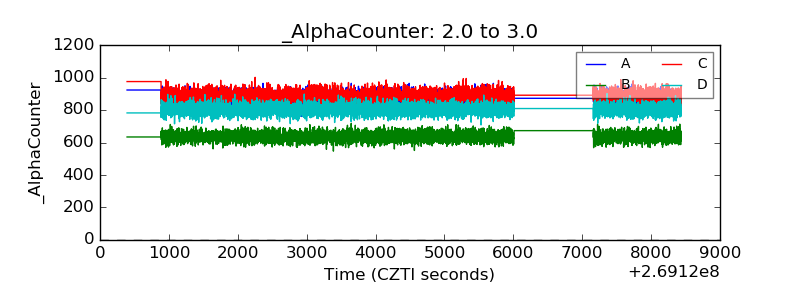 |
| _CPM_Rate | 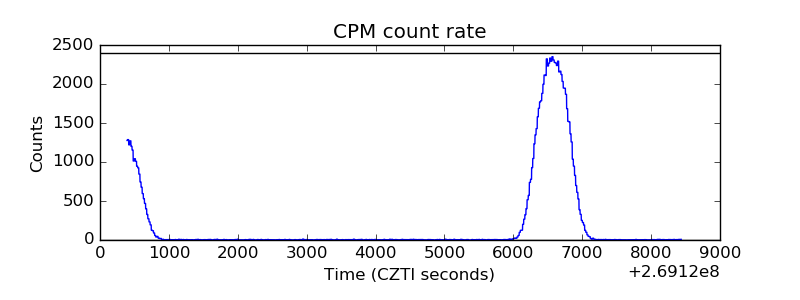 |
| CZT Counter | 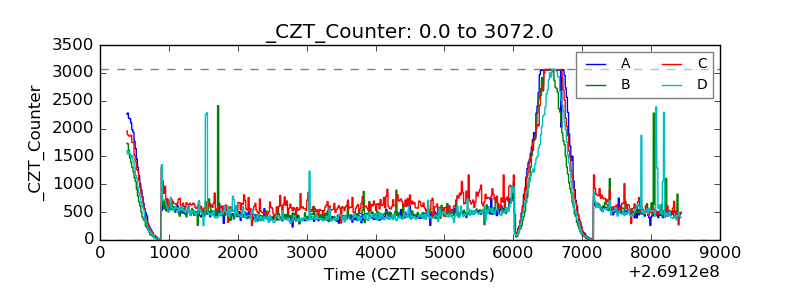 |
| +2.5 Volts monitor |  |
| +5 Volts monitor |  |
| _ROLL_ROT | 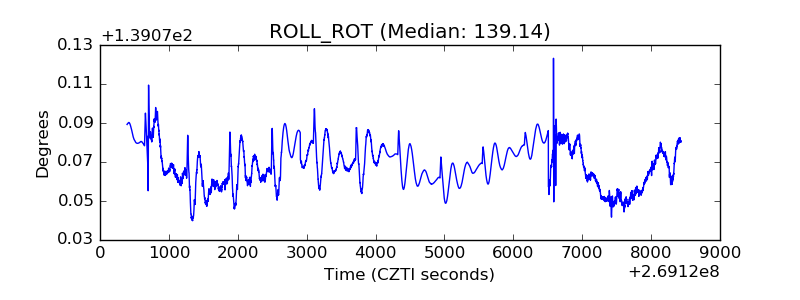 |
| _Roll_DEC | 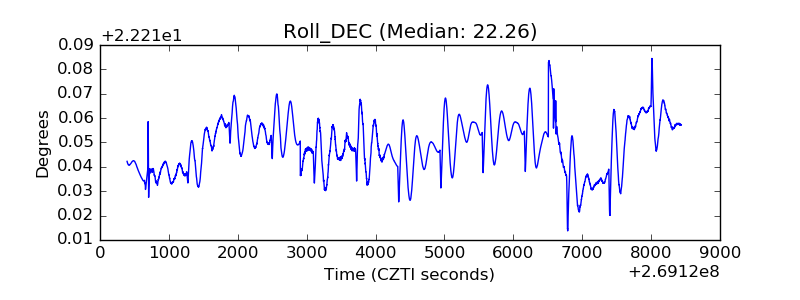 |
| _Roll_RA | 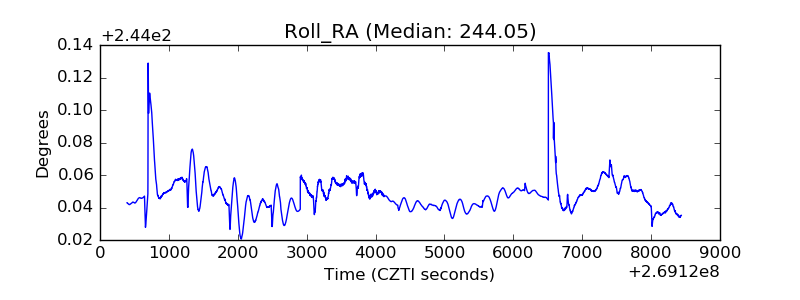 |
| Veto Counter | 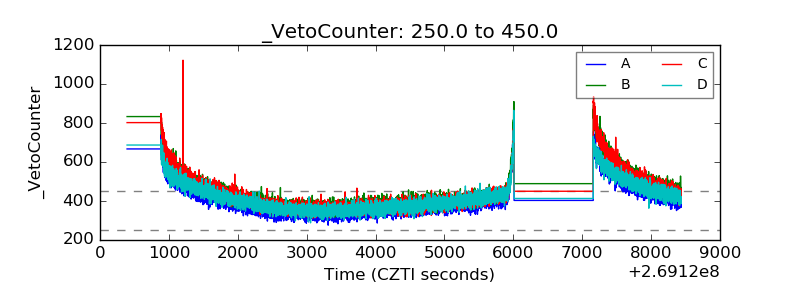 |