| Param | Original file | Final file |
|---|---|---|
| Filename | modeM0/AS1T02_065T01_9000002218_15086cztM0_level2.evt | modeM0/AS1T02_065T01_9000002218_15086cztM0_level2_quad_clean.evt |
| Size (bytes) | 528,451,200 | 82,454,400 |
| Size | 504.0 MB | 78.6 MB |
| Events in quadrant A | 3,699,769 | 499,125 |
| Events in quadrant B | 4,025,428 | 500,787 |
| Events in quadrant C | 4,101,282 | 485,637 |
| Events in quadrant D | 3,651,133 | 472,085 |
| Mode M0 | |||
|---|---|---|---|
| Quadrant | BADHDUFLAG | Total packets | Discarded packets |
| A | 0 | 16106 | 3 |
| B | 0 | 16767 | 2 |
| C | 0 | 16486 | 2 |
| D | 0 | 16424 | 2 |
| Mode M9 | |||
|---|---|---|---|
| Quadrant | BADHDUFLAG | Total packets | Discarded packets |
| A | 0 | 3 | 0 |
| B | 0 | 3 | 0 |
| C | 0 | 3 | 0 |
| D | 0 | 4 | 0 |
| Mode SS | |||
|---|---|---|---|
| Quadrant | BADHDUFLAG | Total packets | Discarded packets |
| A | 0 | 156 | 0 |
| B | 0 | 156 | 0 |
| C | 0 | 156 | 0 |
| D | 0 | 156 | 0 |
| Quadrant | Total seconds | Saturated seconds | Saturation percentage |
|---|---|---|---|
| A | 7754 | 279 | 3.598143% |
| B | 7754 | 344 | 4.436420% |
| C | 7754 | 228 | 2.940418% |
| D | 7754 | 267 | 3.443384% |
Noise dominated data is calculated using 1-second bins in cleaned event files. If a bin has >2000 counts, and if more than 50% of those come from <1% of pixels, then it is considered to be noise-dominated and hence unusable.
| Quadrant | # 1 sec bins | Bins with >0 counts | Bins with >2000 counts | High rate bins dominated by noise | Noise dominated (total time) | Noise dominated (detector-on time) | Marked lightcurve |
|---|---|---|---|---|---|---|---|
| A | 7910 | 7755 | 0 | 0 | 0.00% | 0.00% | 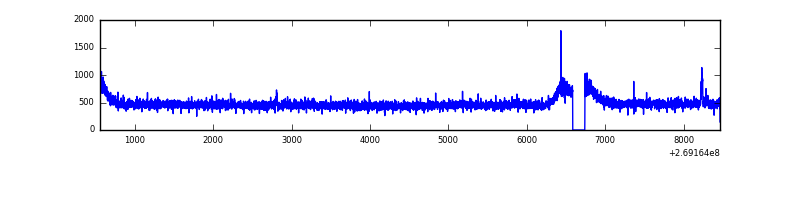 |
| B | 7910 | 7755 | 29 | 29 | 0.37% | 0.37% | 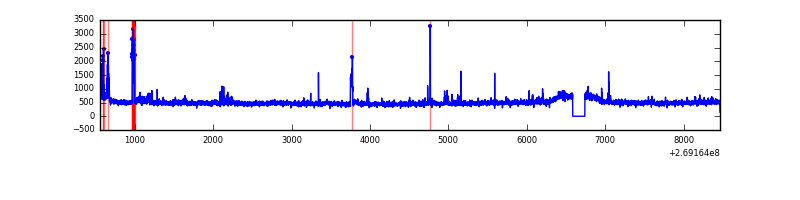 |
| C | 7910 | 7756 | 0 | 0 | 0.00% | 0.00% | 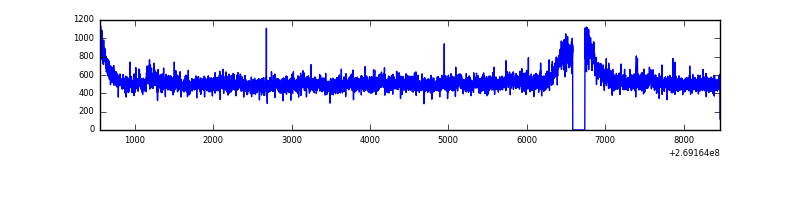 |
| D | 7910 | 7755 | 38 | 38 | 0.48% | 0.49% | 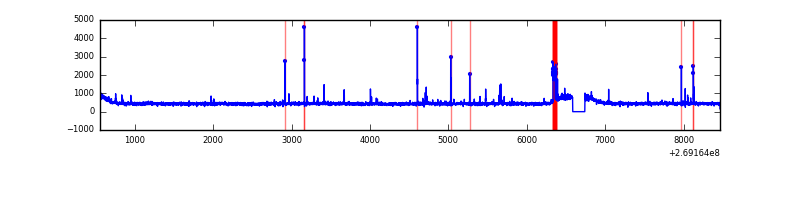 |
Top three noisy pixels from each quadrant. If the there are fewer than three noisy pixels in the level2.evt file, extra rows are filled as -1
| Pixel properties | Quadrant properties | ||||||
|---|---|---|---|---|---|---|---|
| Quadrant | DetID | PixID | Counts | Sigma | Mean | Median | Sigma |
| A | 12 | 189 | 41084 | 205.58 | 952 | 929 | 195.3 |
| A | 0 | 226 | 8332 | 37.9 | 952 | 929 | 195.3 |
| A | 12 | 194 | 6915 | 30.65 | 952 | 929 | 195.3 |
| B | 10 | 245 | 179760 | 974.97 | 945 | 919 | 183.4 |
| B | 3 | 64 | 68952 | 370.89 | 945 | 919 | 183.4 |
| B | 0 | 214 | 30000 | 158.54 | 945 | 919 | 183.4 |
| C | 3 | 233 | 495445 | 2297.52 | 922 | 925 | 215.2 |
| C | 13 | 61 | 6720 | 26.92 | 922 | 925 | 215.2 |
| C | 7 | 220 | 5422 | 20.89 | 922 | 925 | 215.2 |
| D | 10 | 70 | 100976 | 443.53 | 920 | 890 | 225.7 |
| D | 2 | 234 | 26792 | 114.78 | 920 | 890 | 225.7 |
| D | 2 | 120 | 21775 | 92.55 | 920 | 890 | 225.7 |
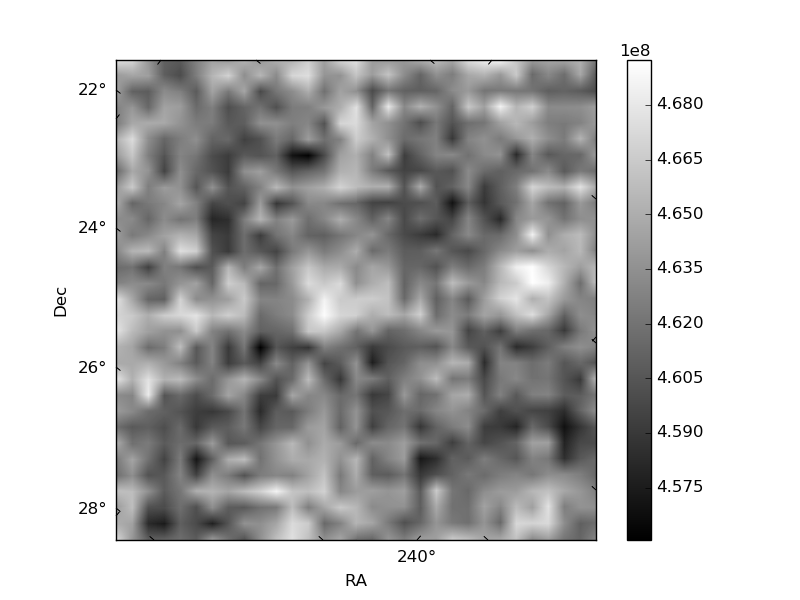
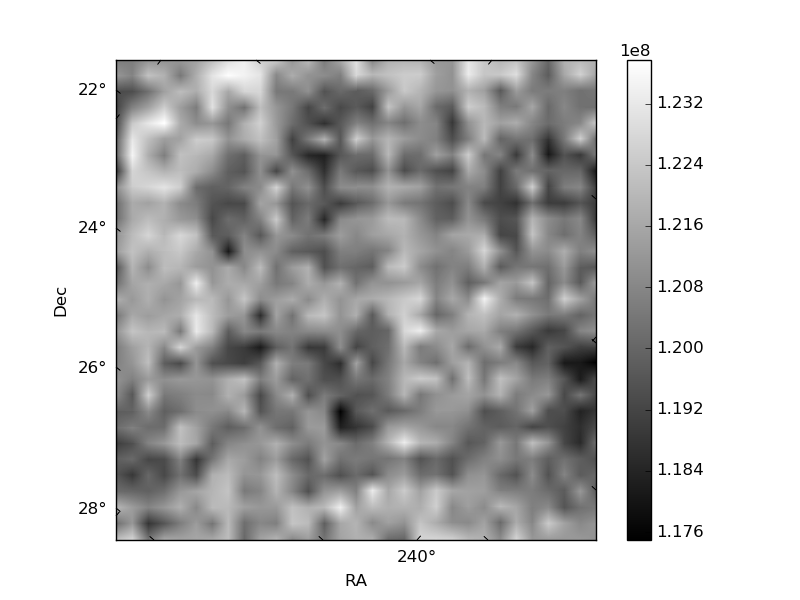
Histogram calculated using DETX and DETY for each event in the final _common_clean file
| Quadrant A | 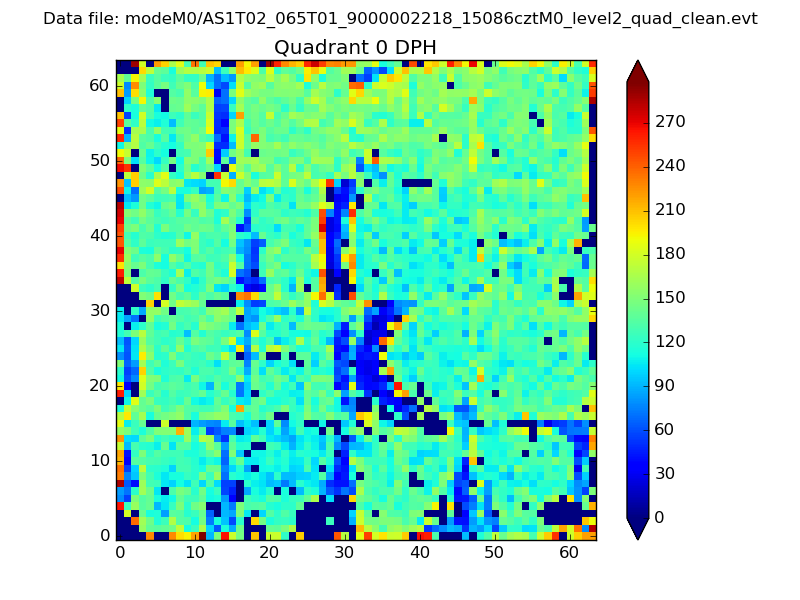 |
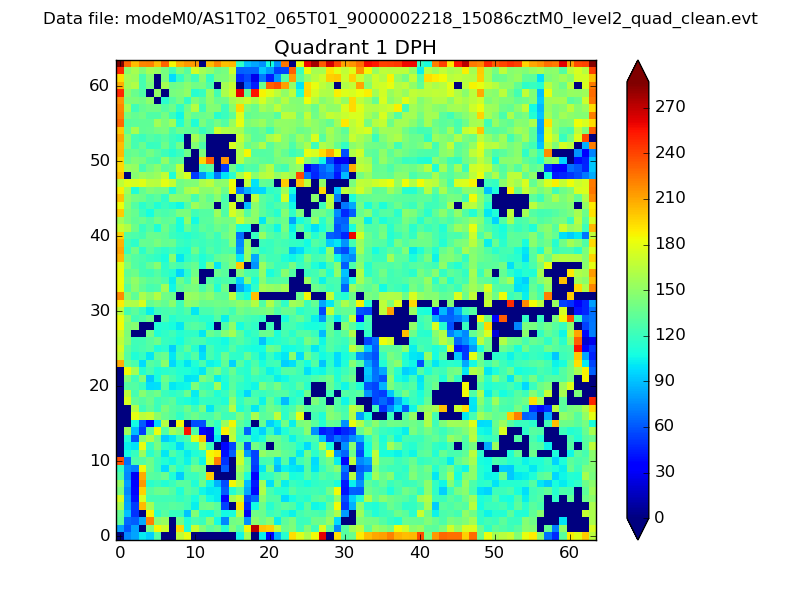 |
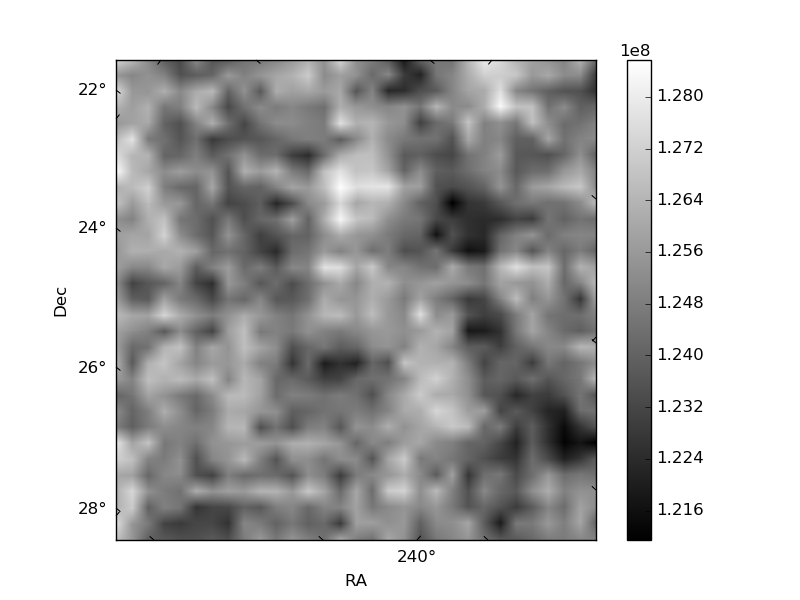
Quadrant B |
|---|---|---|---|
| Quadrant D | 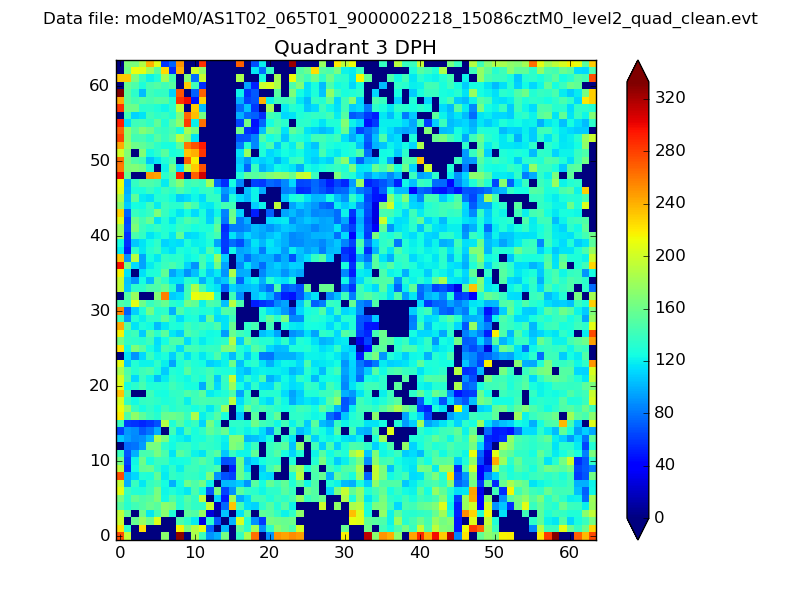 |
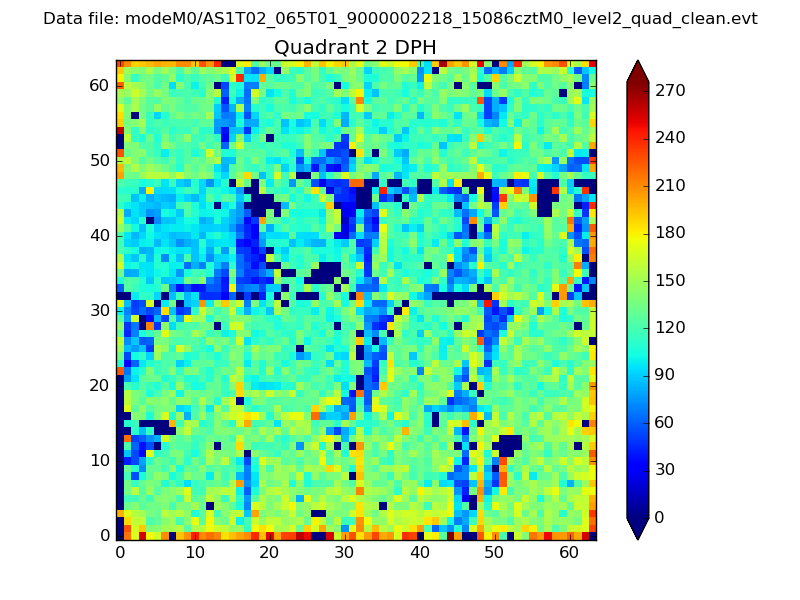 |
Quadrant C |
| Plot type | Count rate plots | Images |
|---|---|---|
| Comparison with Poisson distribution Blue bars denote a histogram of data divided into 1 sec bins. Red curve is a Poisson curve with rate = median count rate of data. |
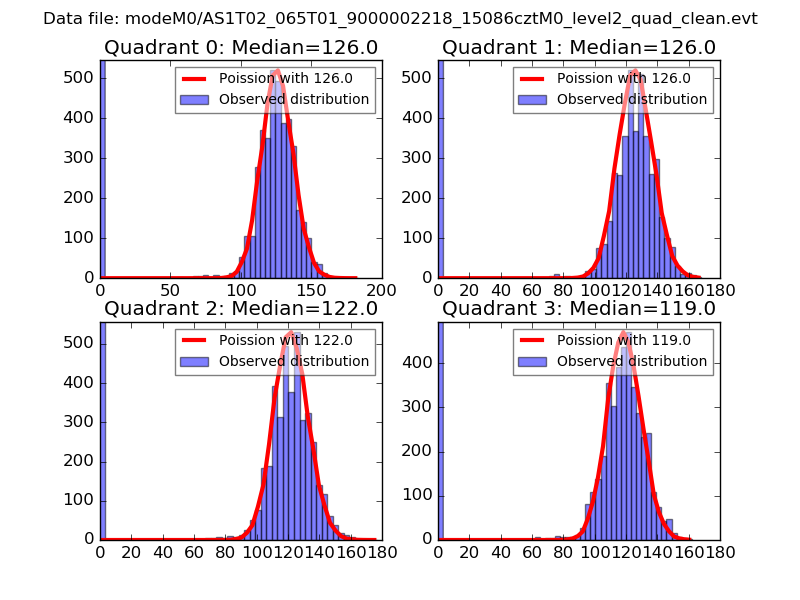 |
 |
| Quadrant-wise count rates Data is divided into 100 sec bins |
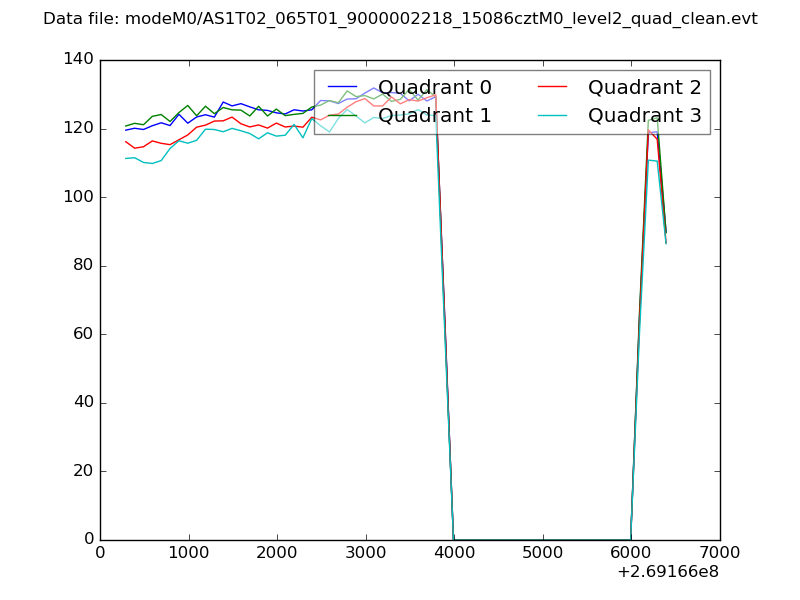 |
|
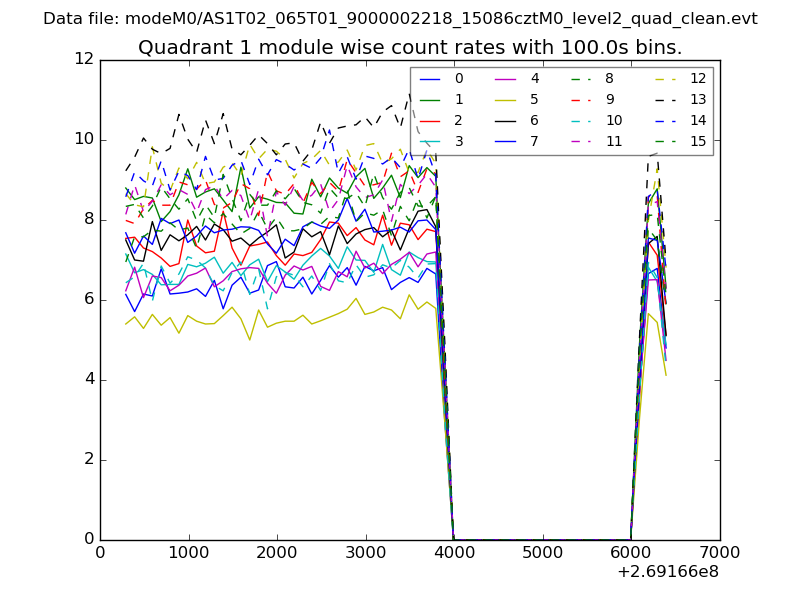
| Module-wise count rates for Quadrant A Data is divided into 100 sec bins |
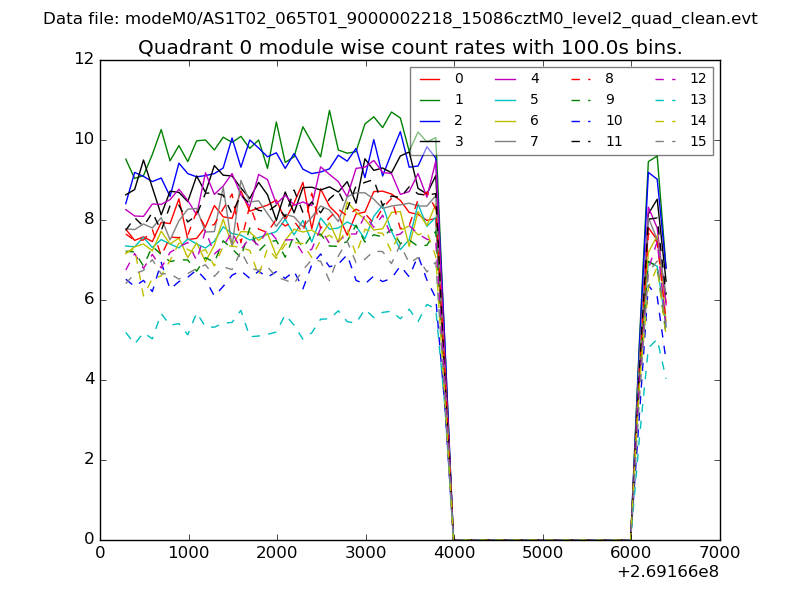 |
 |
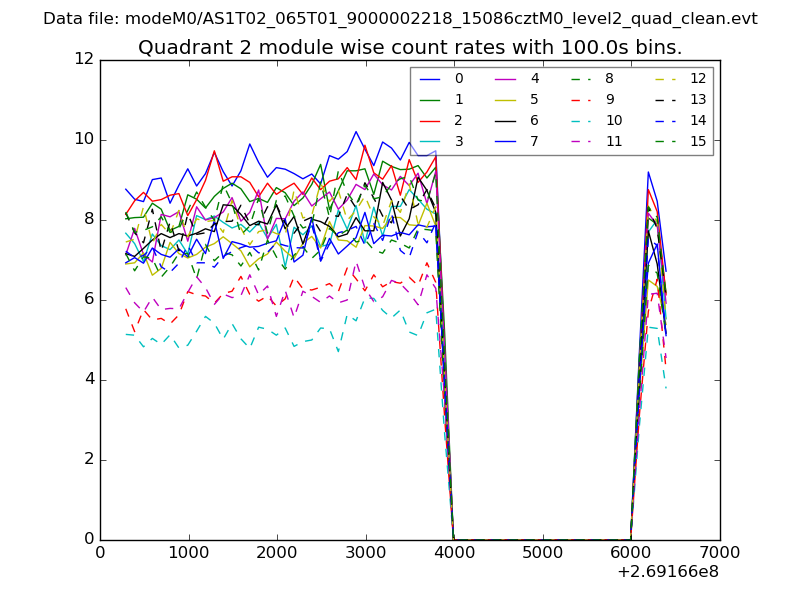
| Module-wise count rates for Quadrant B Data is divided into 100 sec bins |
 |
 |
| Module-wise count rates for Quadrant C Data is divided into 100 sec bins |
 |
 |
| Module-wise count rates for Quadrant D Data is divided into 100 sec bins |
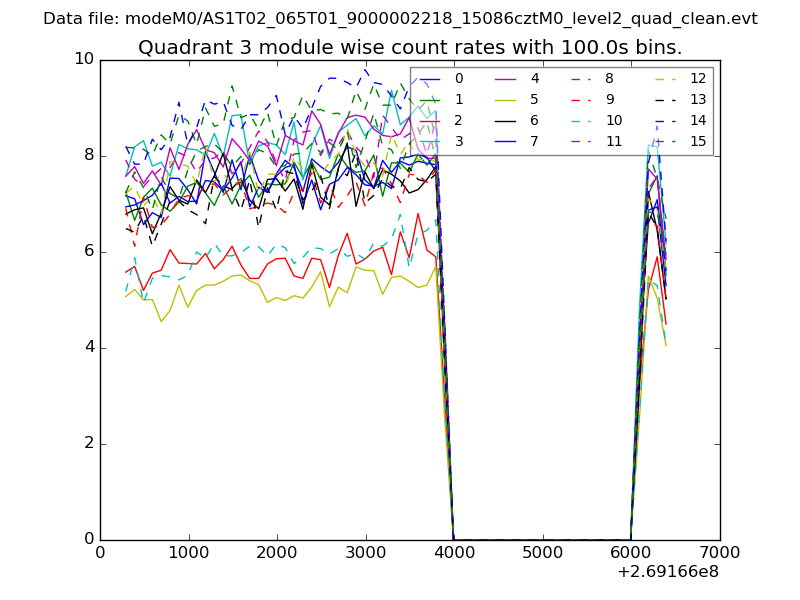 |
 |
| Parameter | Plot |
|---|---|
| CZT HV Monitor | 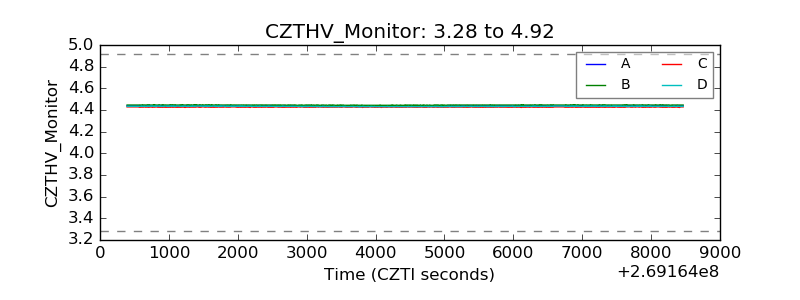 |
| D_VDD | 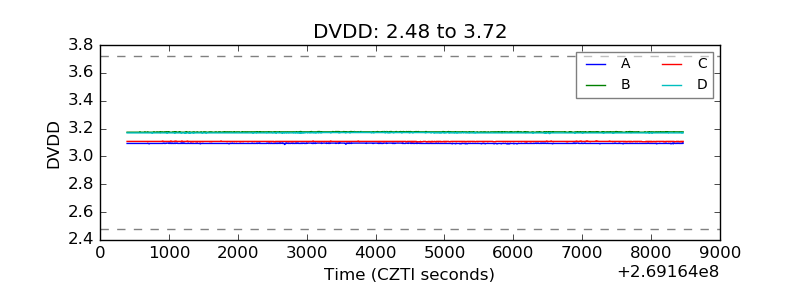 |
| Temperature 1 |  |
| Veto HV Monitor | 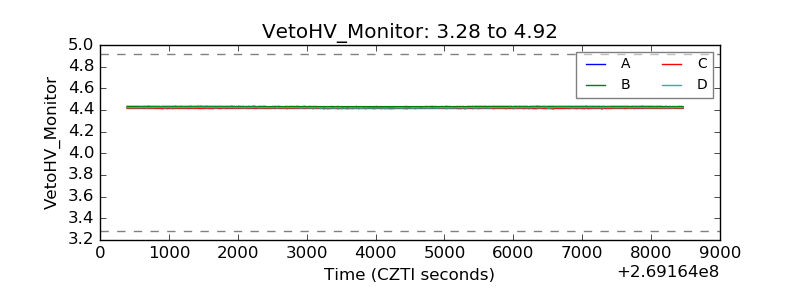 |
| Veto LLD | 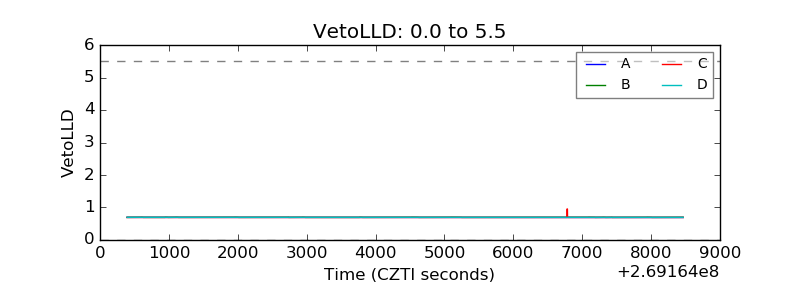 |
| Alpha Counter | 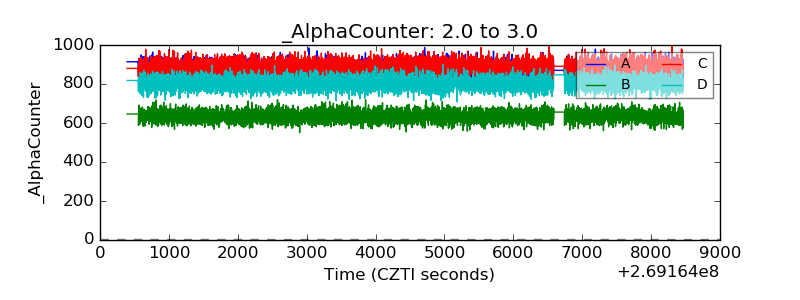 |
| _CPM_Rate | 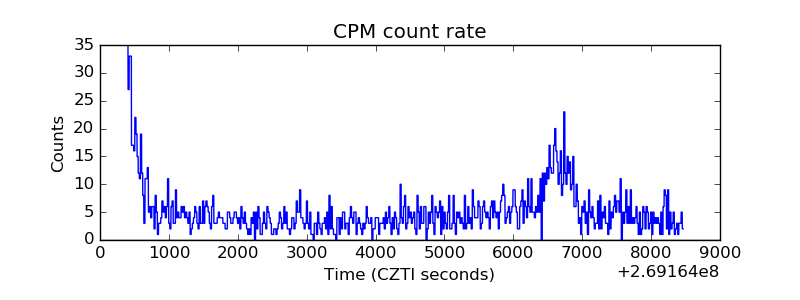 |
| CZT Counter | 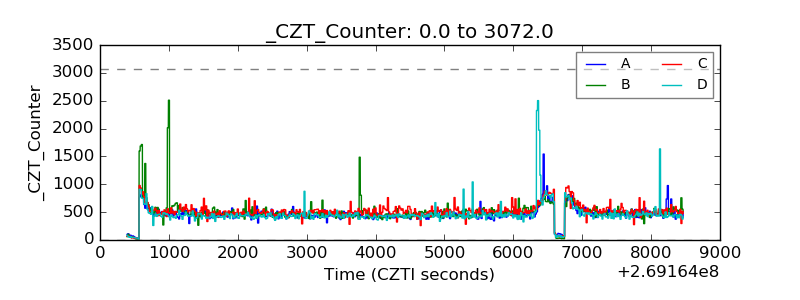 |
| +2.5 Volts monitor |  |
| +5 Volts monitor |  |
| _ROLL_ROT | 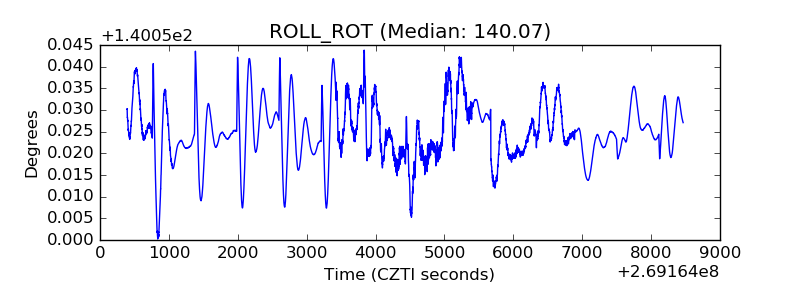 |
| _Roll_DEC |  |
| _Roll_RA | 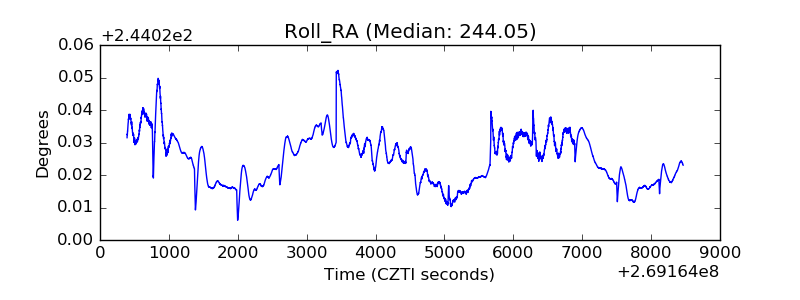 |
| Veto Counter | 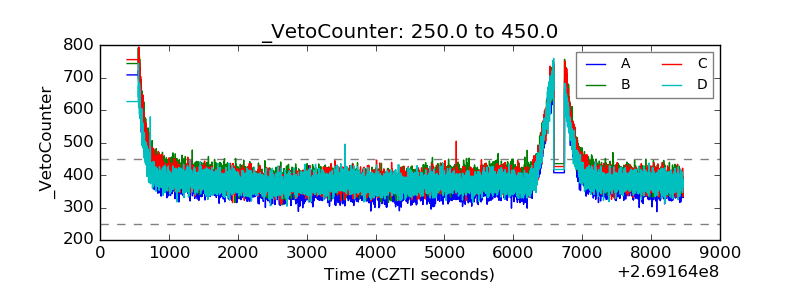 |