| Param | Original file | Final file |
|---|---|---|
| Filename | modeM0/AS1T02_065T01_9000002218_15087cztM0_level2.evt | modeM0/AS1T02_065T01_9000002218_15087cztM0_level2_quad_clean.evt |
| Size (bytes) | 501,053,760 | 87,295,680 |
| Size | 477.8 MB | 83.3 MB |
| Events in quadrant A | 3,618,512 | 540,549 |
| Events in quadrant B | 3,732,141 | 545,023 |
| Events in quadrant C | 3,932,340 | 526,924 |
| Events in quadrant D | 3,385,333 | 512,884 |
| Mode M0 | |||
|---|---|---|---|
| Quadrant | BADHDUFLAG | Total packets | Discarded packets |
| A | 0 | 15549 | 2 |
| B | 0 | 15758 | 1 |
| C | 0 | 16046 | 1 |
| D | 0 | 15402 | 1 |
| Mode M9 | |||
|---|---|---|---|
| Quadrant | BADHDUFLAG | Total packets | Discarded packets |
| A | 0 | 1 | 0 |
| B | 0 | 1 | 0 |
| C | 0 | 1 | 0 |
| D | 0 | 1 | 0 |
| Mode SS | |||
|---|---|---|---|
| Quadrant | BADHDUFLAG | Total packets | Discarded packets |
| A | 0 | 152 | 0 |
| B | 0 | 152 | 0 |
| C | 0 | 152 | 0 |
| D | 0 | 152 | 0 |
| Quadrant | Total seconds | Saturated seconds | Saturation percentage |
|---|---|---|---|
| A | 7441 | 171 | 2.298078% |
| B | 7441 | 174 | 2.338395% |
| C | 7441 | 140 | 1.881468% |
| D | 7441 | 149 | 2.002419% |
Noise dominated data is calculated using 1-second bins in cleaned event files. If a bin has >2000 counts, and if more than 50% of those come from <1% of pixels, then it is considered to be noise-dominated and hence unusable.
| Quadrant | # 1 sec bins | Bins with >0 counts | Bins with >2000 counts | High rate bins dominated by noise | Noise dominated (total time) | Noise dominated (detector-on time) | Marked lightcurve |
|---|---|---|---|---|---|---|---|
| A | 7607 | 7443 | 0 | 0 | 0.00% | 0.00% | 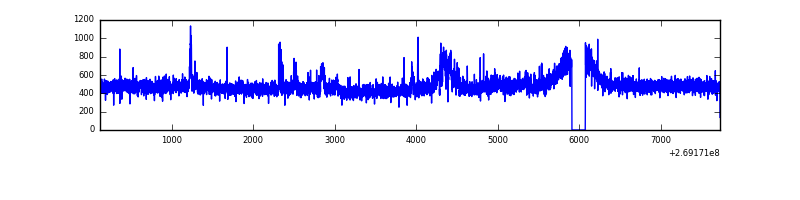 |
| B | 7607 | 7443 | 1 | 1 | 0.01% | 0.01% | 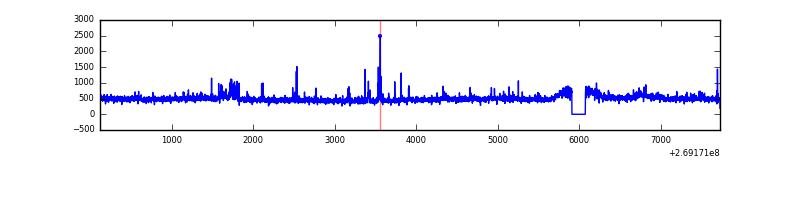 |
| C | 7607 | 7443 | 0 | 0 | 0.00% | 0.00% | 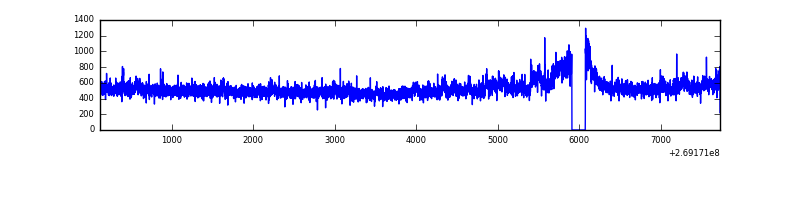 |
| D | 7607 | 7442 | 12 | 12 | 0.16% | 0.16% | 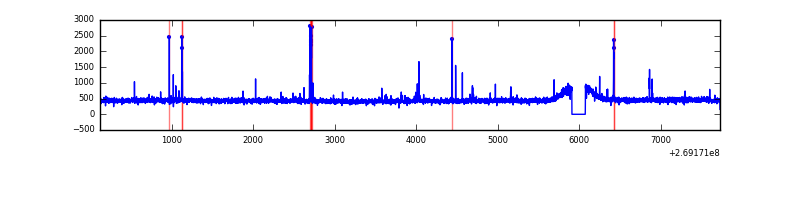 |
Top three noisy pixels from each quadrant. If the there are fewer than three noisy pixels in the level2.evt file, extra rows are filled as -1
| Pixel properties | Quadrant properties | ||||||
|---|---|---|---|---|---|---|---|
| Quadrant | DetID | PixID | Counts | Sigma | Mean | Median | Sigma |
| A | 12 | 189 | 169049 | 916.59 | 897 | 875 | 183.5 |
| A | 0 | 226 | 7956 | 38.59 | 897 | 875 | 183.5 |
| A | 12 | 194 | 6574 | 31.06 | 897 | 875 | 183.5 |
| B | 3 | 64 | 148739 | 851.73 | 895 | 870 | 173.6 |
| B | 3 | 209 | 24127 | 133.96 | 895 | 870 | 173.6 |
| B | 12 | 111 | 21031 | 116.13 | 895 | 870 | 173.6 |
| C | 3 | 233 | 542231 | 2675.51 | 867 | 872 | 202.3 |
| C | 13 | 61 | 6281 | 26.73 | 867 | 872 | 202.3 |
| C | 3 | 232 | 3239 | 11.7 | 867 | 872 | 202.3 |
| D | 2 | 234 | 28183 | 128.94 | 868 | 840 | 212.1 |
| D | 7 | 38 | 25050 | 114.17 | 868 | 840 | 212.1 |
| D | 13 | 104 | 17519 | 78.66 | 868 | 840 | 212.1 |
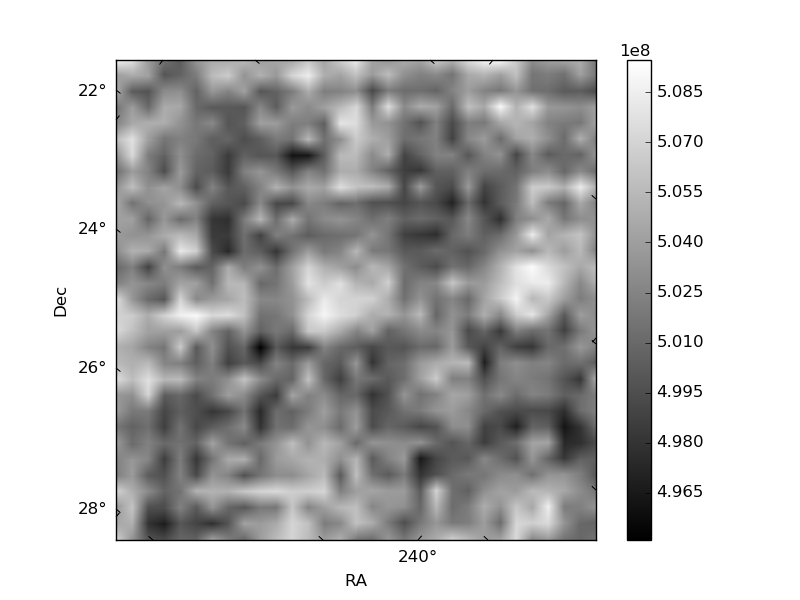
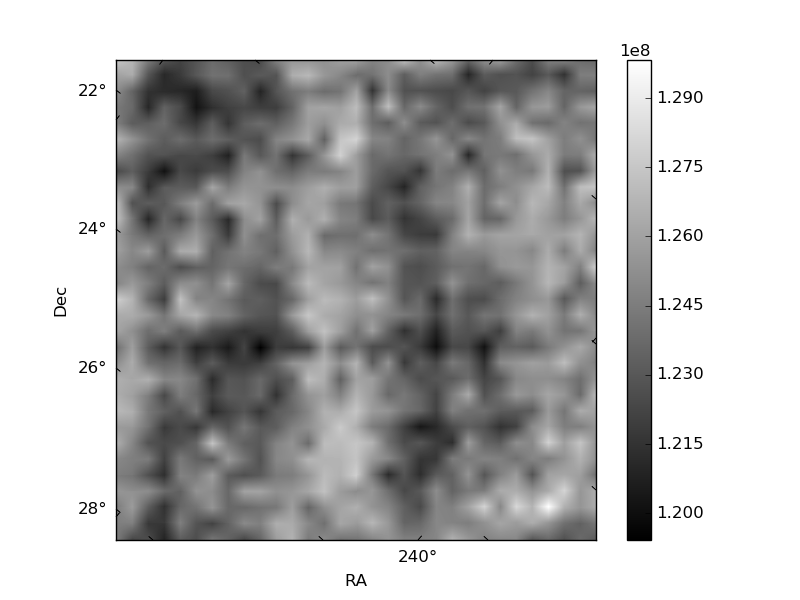
Histogram calculated using DETX and DETY for each event in the final _common_clean file
| Quadrant A | 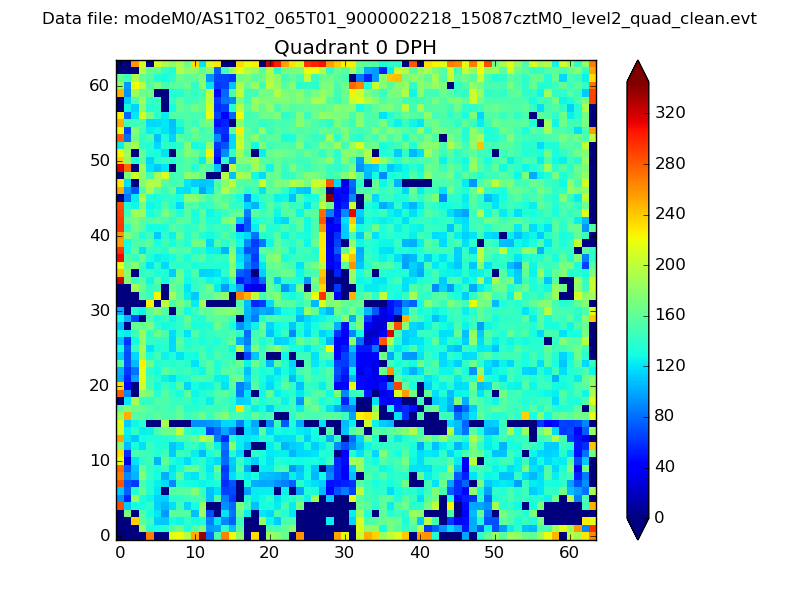 |
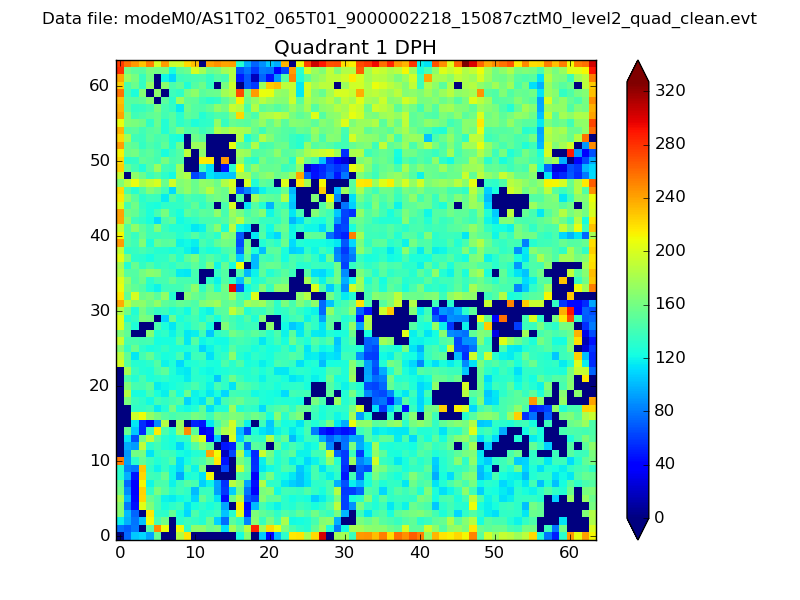 |
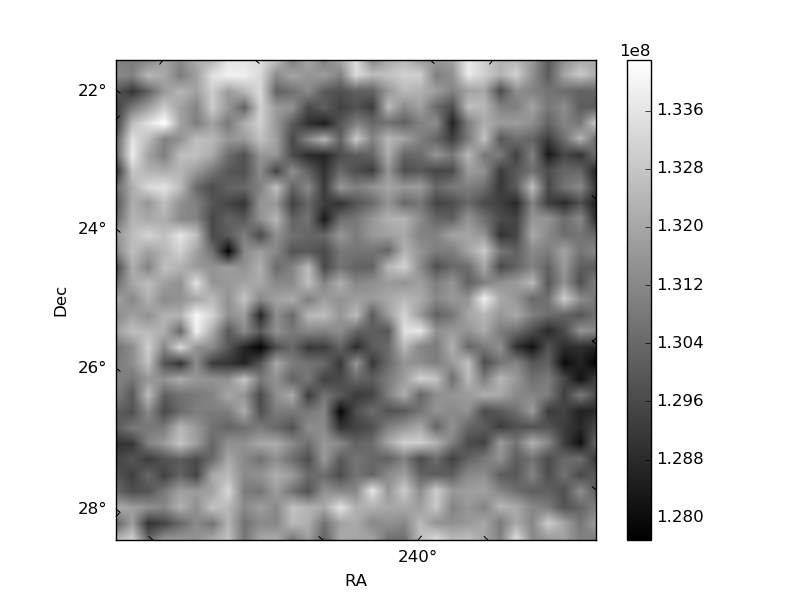
Quadrant B |
|---|---|---|---|
| Quadrant D | 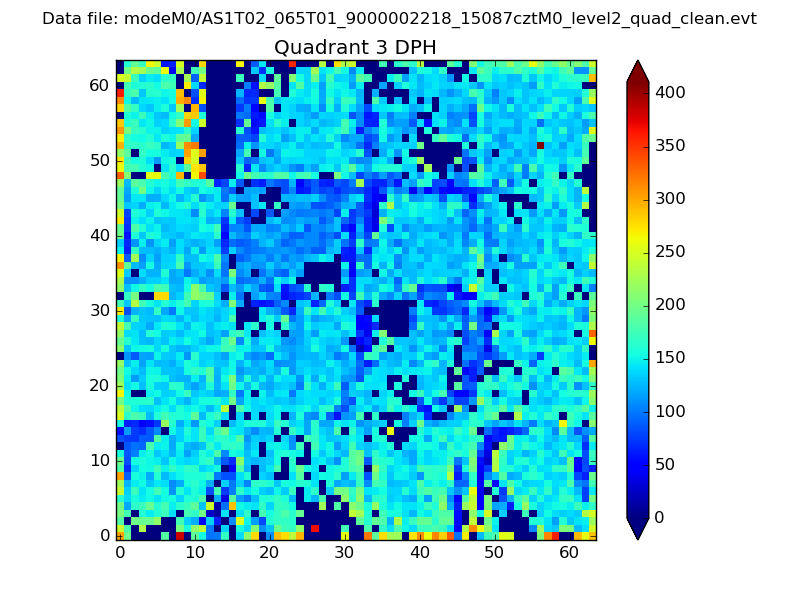 |
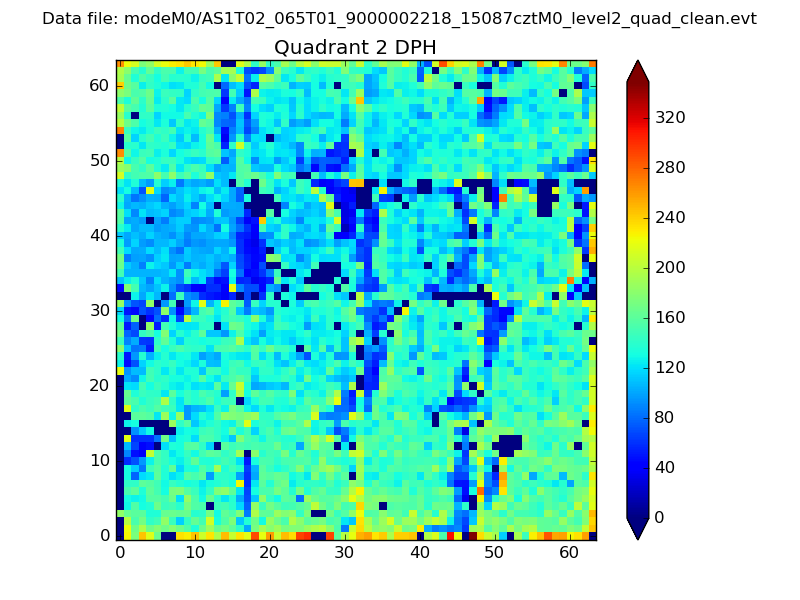 |
Quadrant C |
| Plot type | Count rate plots | Images |
|---|---|---|
| Comparison with Poisson distribution Blue bars denote a histogram of data divided into 1 sec bins. Red curve is a Poisson curve with rate = median count rate of data. |
 |
 |
| Quadrant-wise count rates Data is divided into 100 sec bins |
 |
|
| Module-wise count rates for Quadrant A Data is divided into 100 sec bins |
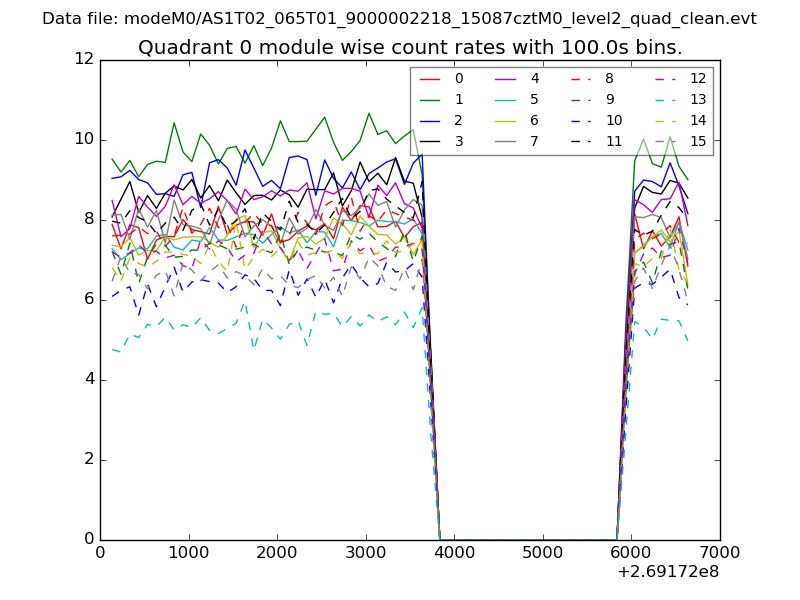 |
 |
| Module-wise count rates for Quadrant B Data is divided into 100 sec bins |
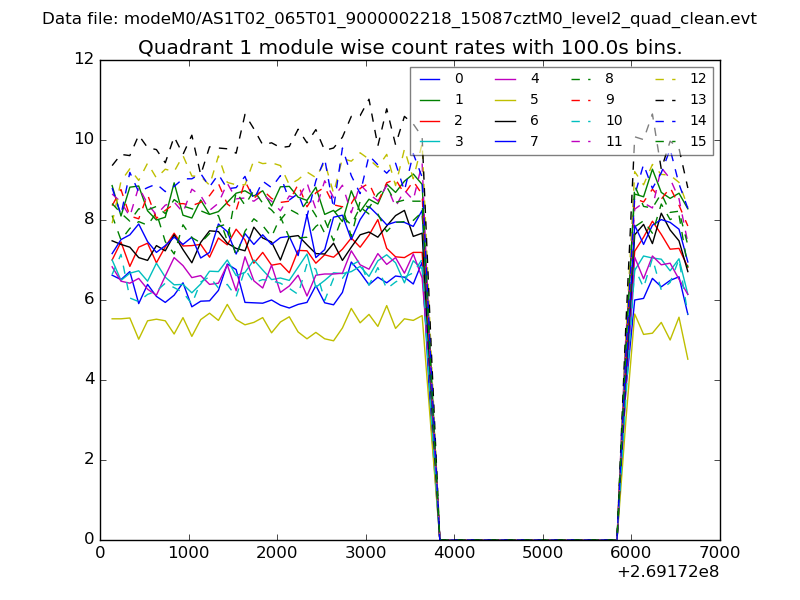 |
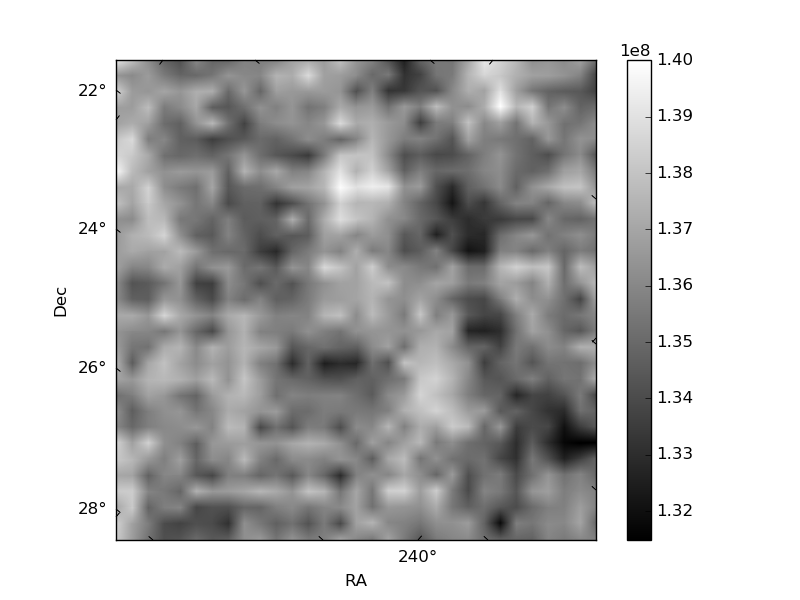 |
| Module-wise count rates for Quadrant C Data is divided into 100 sec bins |
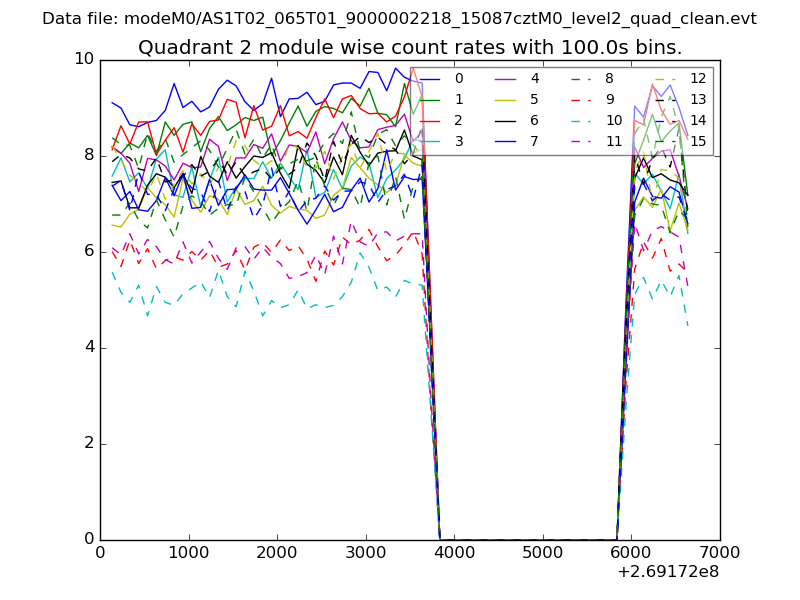 |
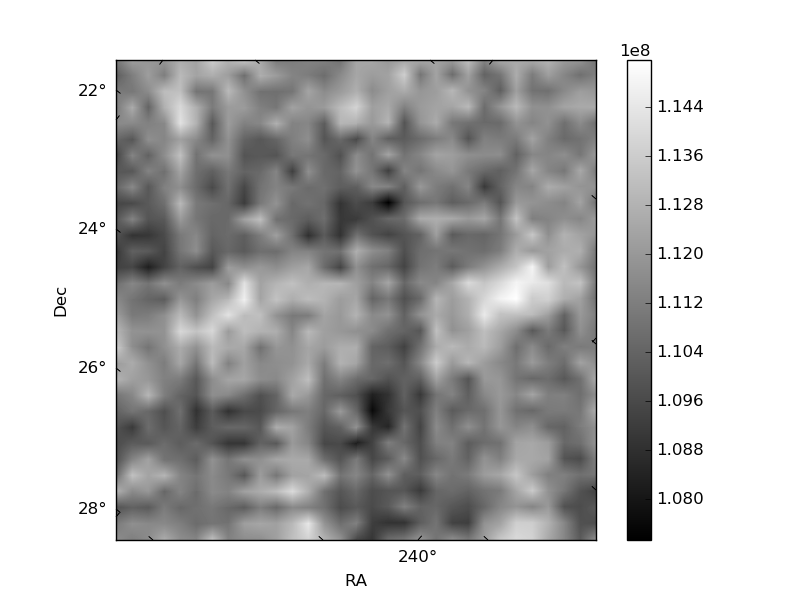 |
| Module-wise count rates for Quadrant D Data is divided into 100 sec bins |
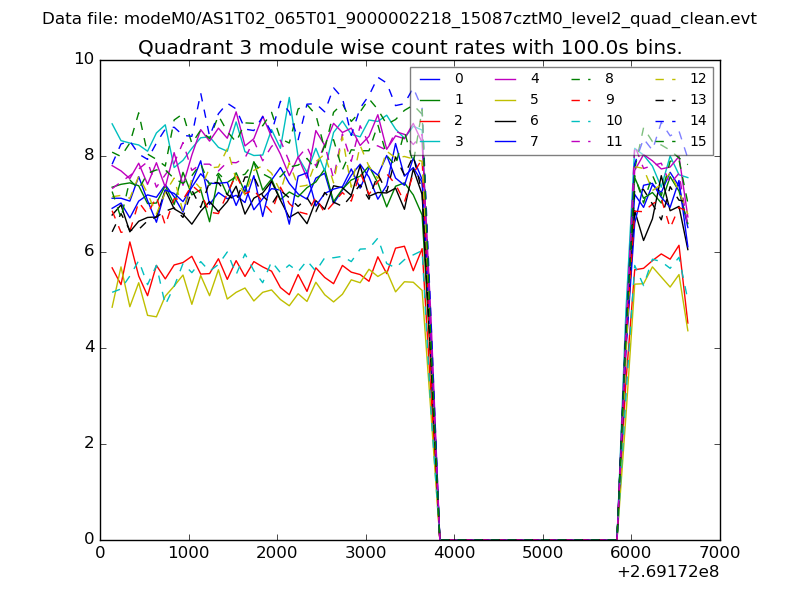 |
 |
| Parameter | Plot |
|---|---|
| CZT HV Monitor | 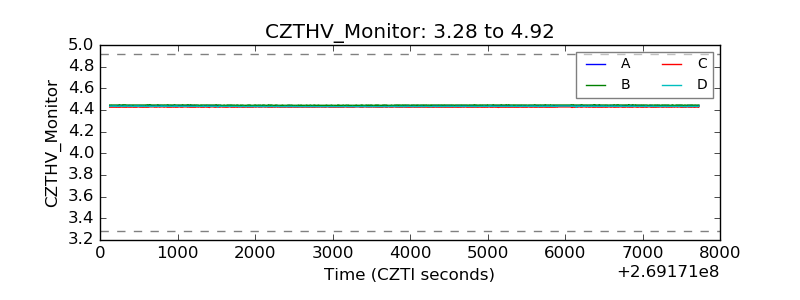 |
| D_VDD | 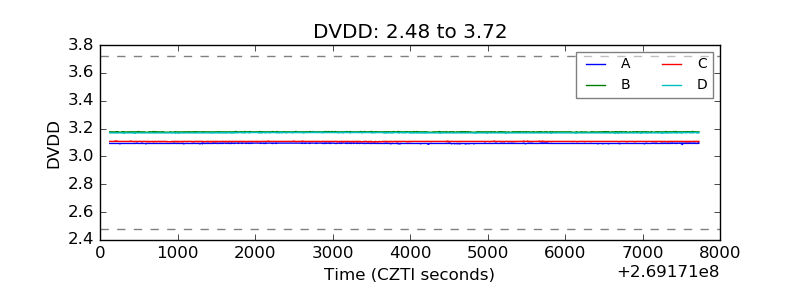 |
| Temperature 1 | 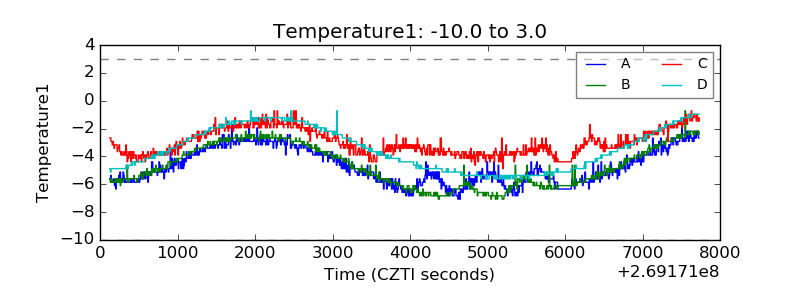 |
| Veto HV Monitor | 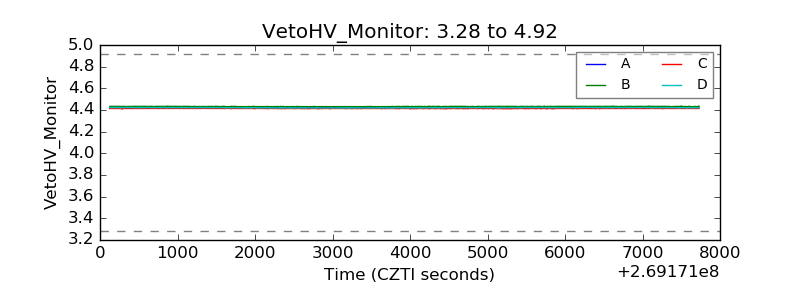 |
| Veto LLD | 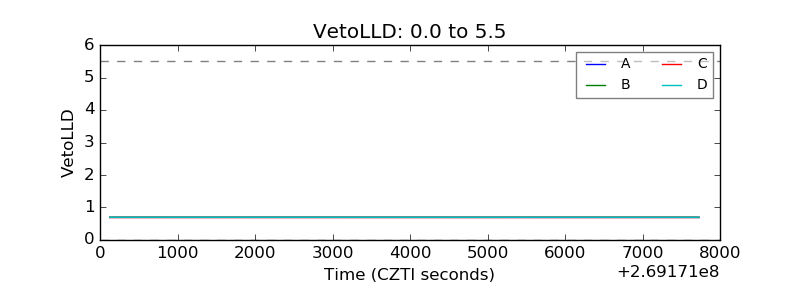 |
| Alpha Counter |  |
| _CPM_Rate | 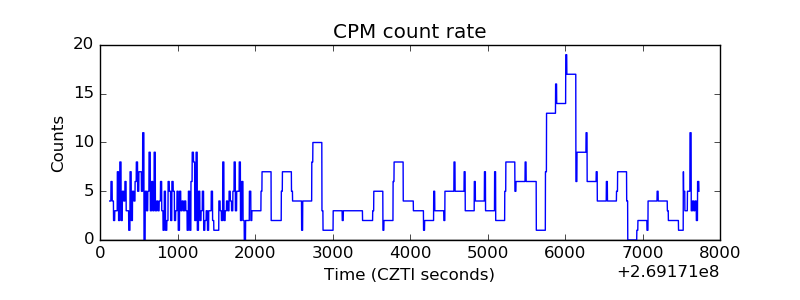 |
| CZT Counter | 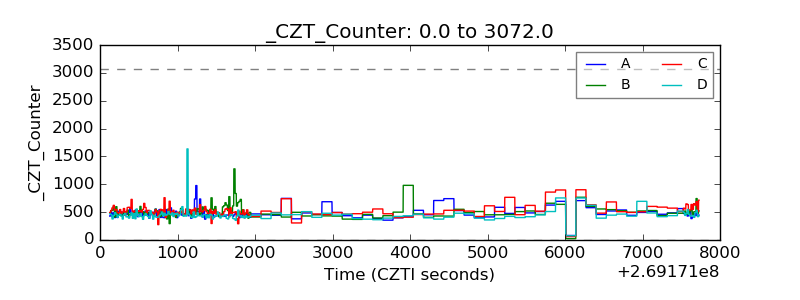 |
| +2.5 Volts monitor |  |
| +5 Volts monitor |  |
| _ROLL_ROT | 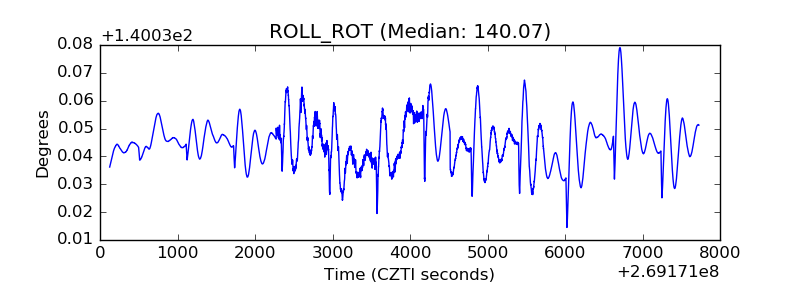 |
| _Roll_DEC | 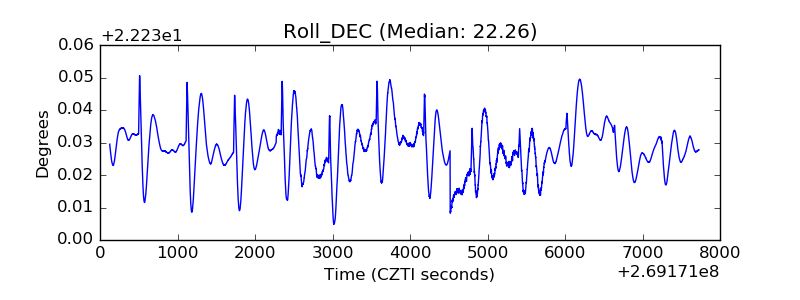 |
| _Roll_RA | 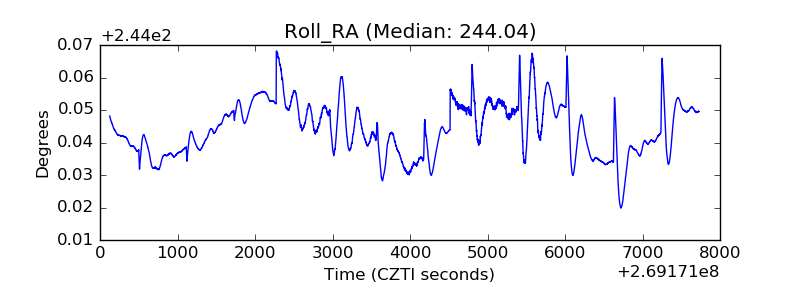 |
| Veto Counter | 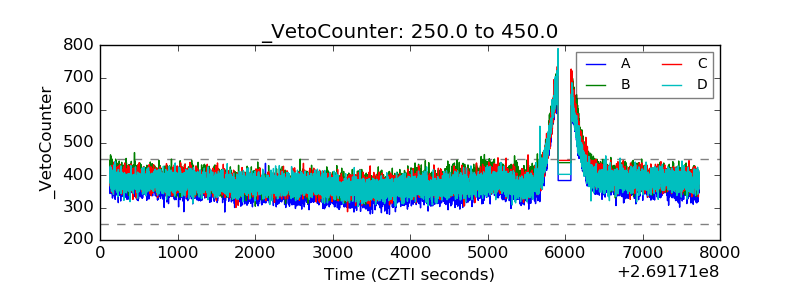 |