| Param | Original file | Final file |
|---|---|---|
| Filename | modeM0/AS1G08_028T01_9000002220cztM0_level2.fits | modeM0/AS1G08_028T01_9000002220cztM0_level2_quad_clean.evt |
| Size (bytes) | 856,077,120 | 731,373,120 |
| Size | 816.4 MB | 697.5 MB |
| Events in quadrant A | 5,237,226 | 4,230,381 |
| Events in quadrant B | 5,028,320 | 4,247,596 |
| Events in quadrant C | 5,095,984 | 3,933,140 |
| Events in quadrant D | 4,471,066 | 3,644,649 |
| Mode M0 | |||
|---|---|---|---|
| Quadrant | BADHDUFLAG | Total packets | Discarded packets |
| A | 0 | 183744 | 0 |
| B | 0 | 207943 | 0 |
| C | 0 | 196708 | 0 |
| D | 0 | 190933 | 0 |
| Mode SS | |||
|---|---|---|---|
| Quadrant | BADHDUFLAG | Total packets | Discarded packets |
| A | 0 | 1802 | 0 |
| B | 0 | 1802 | 0 |
| C | 0 | 1802 | 0 |
| D | 0 | 1802 | 0 |
| Mode M9 | |||
|---|---|---|---|
| Quadrant | BADHDUFLAG | Total packets | Discarded packets |
| A | 0 | 136 | 0 |
| B | 0 | 136 | 0 |
| C | 0 | 136 | 0 |
| D | 0 | 136 | 0 |
| Quadrant | Total seconds | Saturated seconds | Saturation percentage |
|---|---|---|---|
| A | 88887 | 1263 | 1.420905% |
| B | 88887 | 2912 | 3.276070% |
| C | 88887 | 1435 | 1.614409% |
| D | 88887 | 1723 | 1.938416% |
Noise dominated data is calculated using 1-second bins in cleaned event files. If a bin has >2000 counts, and if more than 50% of those come from <1% of pixels, then it is considered to be noise-dominated and hence unusable.
| Quadrant | # 1 sec bins | Bins with >0 counts | Bins with >2000 counts | High rate bins dominated by noise | Noise dominated (total time) | Noise dominated (detector-on time) | Marked lightcurve |
|---|---|---|---|---|---|---|---|
| A | 102442 | 88877 | 0 | 0 | 0.00% | 0.00% |  |
| B | 102442 | 88871 | 0 | 0 | 0.00% | 0.00% | 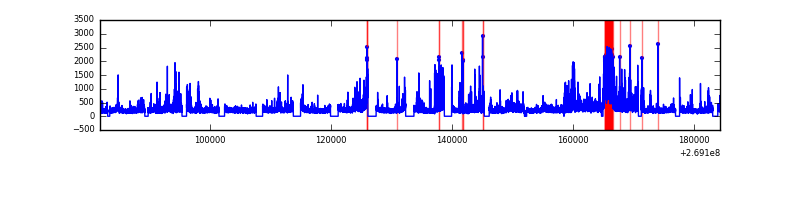 |
| C | 102442 | 88875 | 0 | 0 | 0.00% | 0.00% | 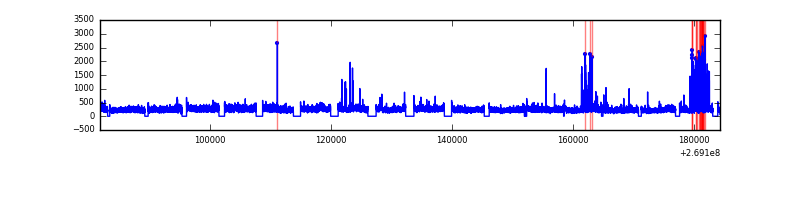 |
| D | 102442 | 88809 | 0 | 0 | 0.00% | 0.00% | 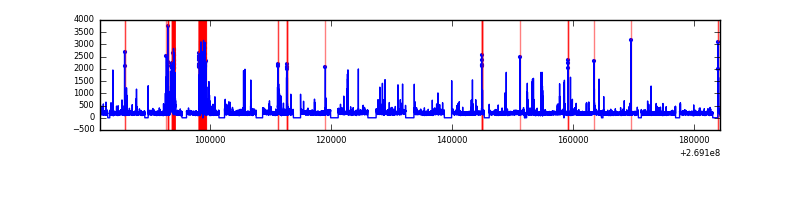 |
Top three noisy pixels from each quadrant. If the there are fewer than three noisy pixels in the level2.evt file, extra rows are filled as -1
| Pixel properties | Quadrant properties | ||||||
|---|---|---|---|---|---|---|---|
| Quadrant | DetID | PixID | Counts | Sigma | Mean | Median | Sigma |
| A | 0 | 29 | 4831 | 10.52 | 1361 | 1272 | 338.5 |
| A | 7 | 110 | 4183 | 8.6 | 1361 | 1272 | 338.5 |
| A | 15 | 236 | 3908 | 7.79 | 1361 | 1272 | 338.5 |
| B | 2 | 9 | 4353 | 11.61 | 1322 | 1255 | 266.8 |
| B | 3 | 17 | 3383 | 7.98 | 1322 | 1255 | 266.8 |
| B | 5 | 232 | 3353 | 7.86 | 1322 | 1255 | 266.8 |
| C | 1 | 81 | 3840 | 7.37 | 1346 | 1249 | 351.5 |
| C | 1 | 80 | 3808 | 7.28 | 1346 | 1249 | 351.5 |
| C | 12 | 241 | 3699 | 6.97 | 1346 | 1249 | 351.5 |
| D | 6 | 231 | 3149 | 5.83 | 1272 | 1151 | 342.4 |
| D | 7 | 3 | 3074 | 5.61 | 1272 | 1151 | 342.4 |
| D | 10 | 189 | 3047 | 5.54 | 1272 | 1151 | 342.4 |
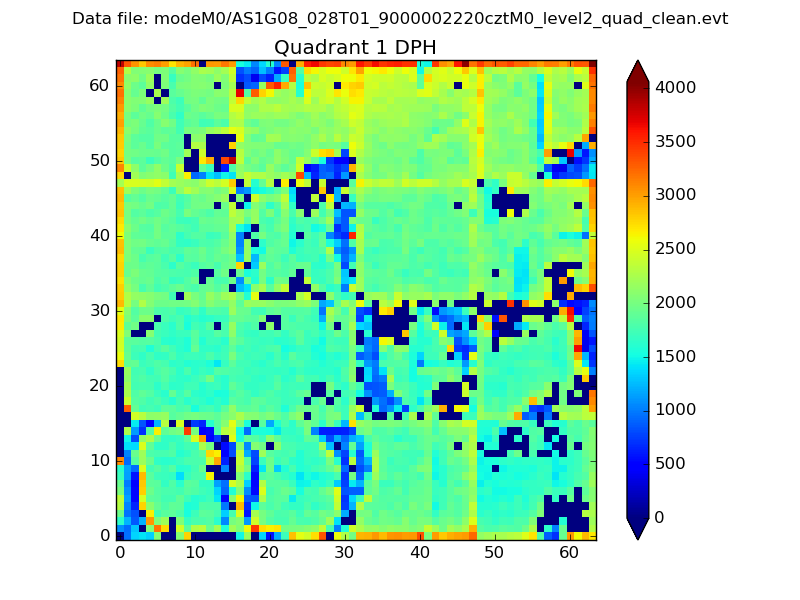
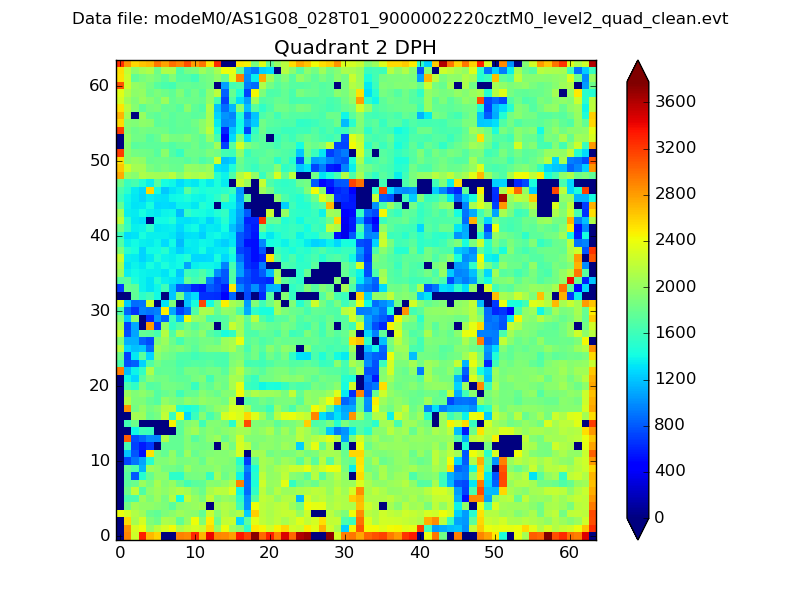
Histogram calculated using DETX and DETY for each event in the final _common_clean file
| Quadrant A |  |
 |
Quadrant B |
|---|---|---|---|
| Quadrant D |  |
 |
Quadrant C |
| Plot type | Count rate plots | Images |
|---|---|---|
| Comparison with Poisson distribution Blue bars denote a histogram of data divided into 1 sec bins. Red curve is a Poisson curve with rate = median count rate of data. |
 |
 |
| Quadrant-wise count rates Data is divided into 100 sec bins |
 |
|
| Module-wise count rates for Quadrant A Data is divided into 100 sec bins |
 |
 |
| Module-wise count rates for Quadrant B Data is divided into 100 sec bins |
 |
 |
| Module-wise count rates for Quadrant C Data is divided into 100 sec bins |
 |
 |
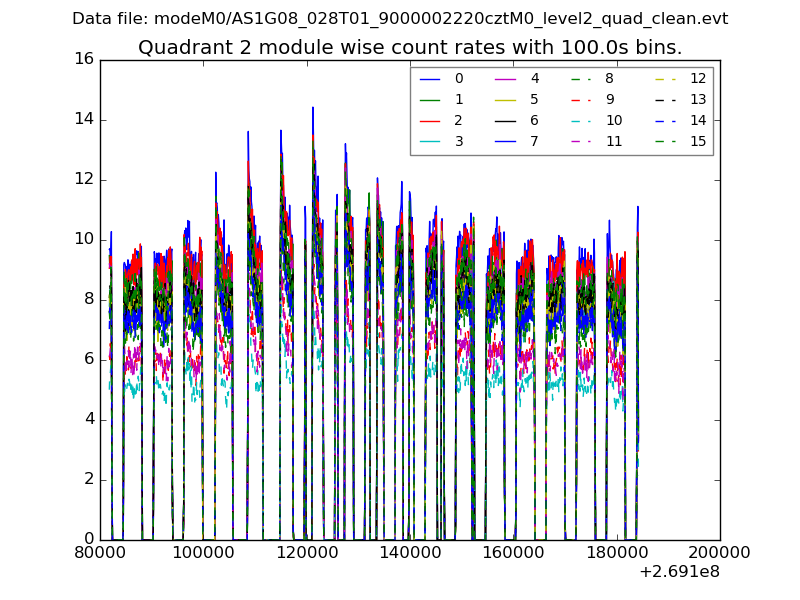
| Module-wise count rates for Quadrant D Data is divided into 100 sec bins |
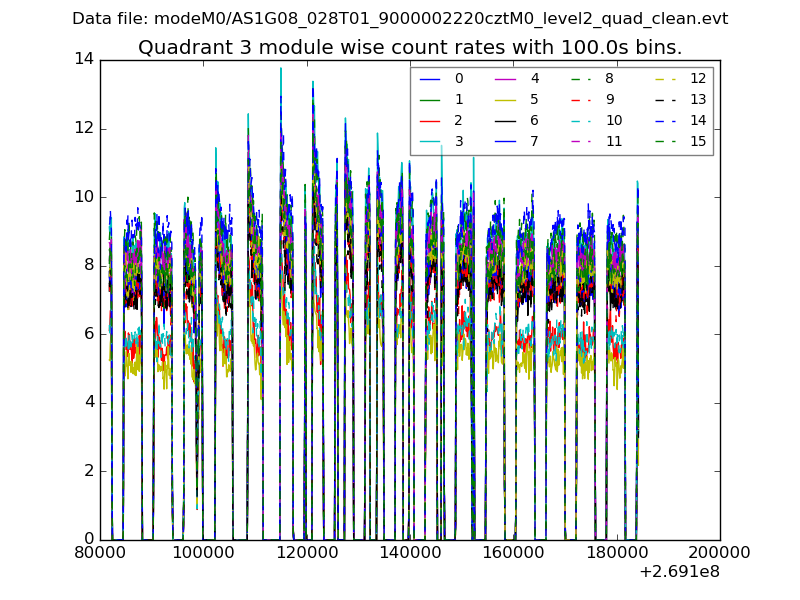 |
 |
| Parameter | Plot |
|---|---|
| CZT HV Monitor | 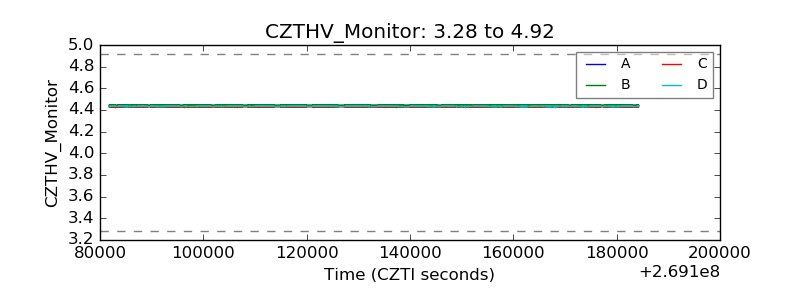 |
| D_VDD | 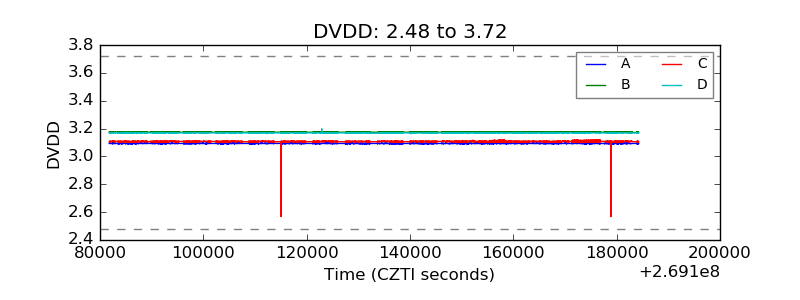 |
| Temperature 1 |  |
| Veto HV Monitor | 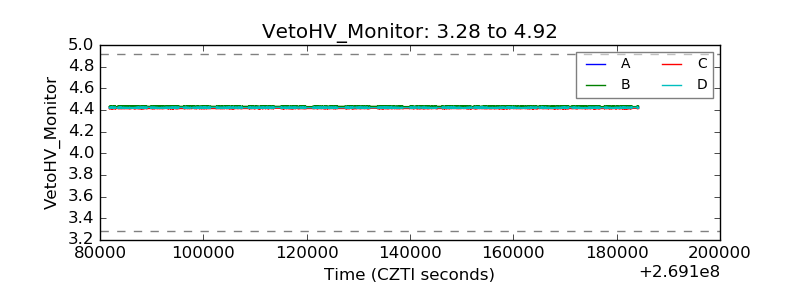 |
| Veto LLD | 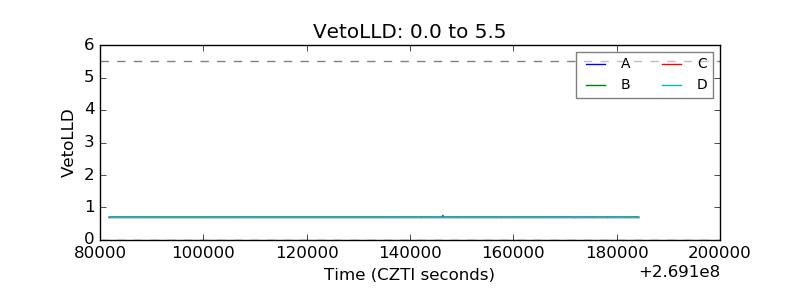 |
| Alpha Counter |  |
| _CPM_Rate | 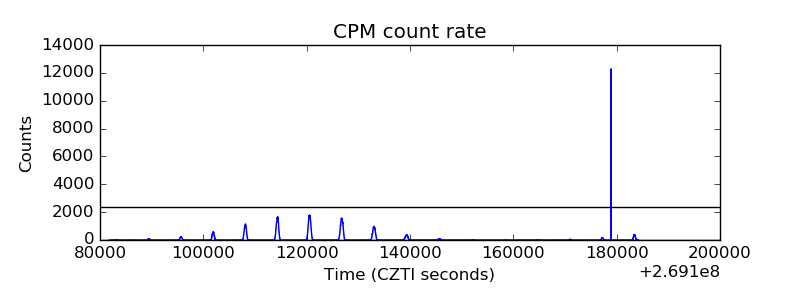 |
| CZT Counter |  |
| +2.5 Volts monitor |  |
| +5 Volts monitor | 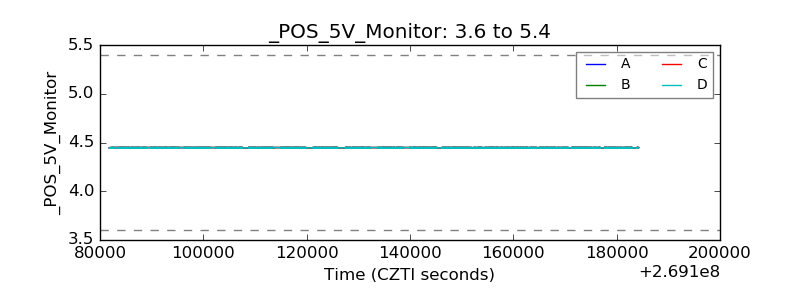 |
| _ROLL_ROT | 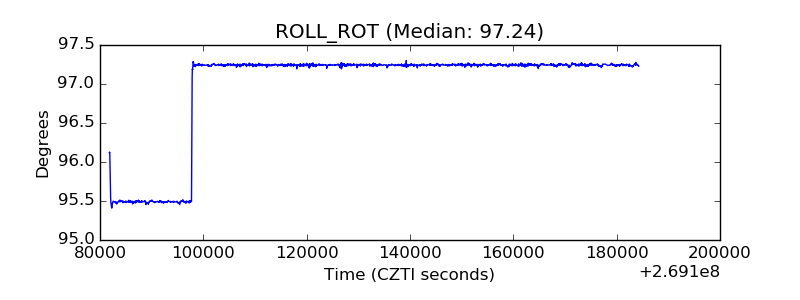 |
| _Roll_DEC |  |
| _Roll_RA | 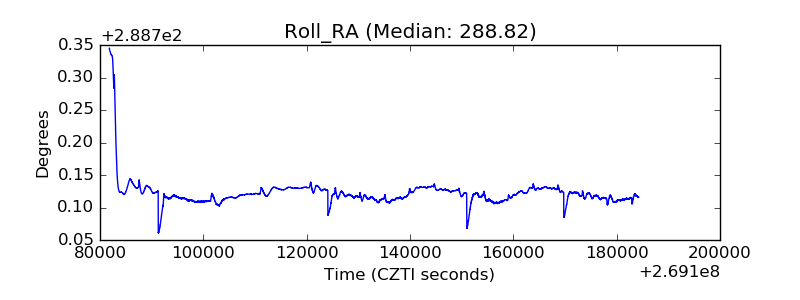 |
| Veto Counter | 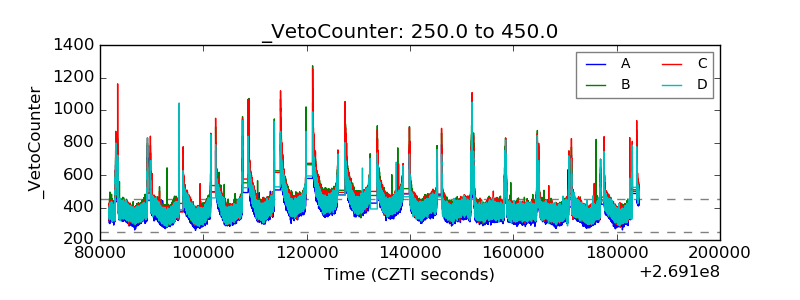 |