| Param | Original file | Final file |
|---|---|---|
| Filename | modeM0/AS1G08_028T01_9000002220_15088cztM0_level2.evt | modeM0/AS1G08_028T01_9000002220_15088cztM0_level2_quad_clean.evt |
| Size (bytes) | 200,733,120 | 22,043,520 |
| Size | 191.4 MB | 21.0 MB |
| Events in quadrant A | 1,413,963 | 118,227 |
| Events in quadrant B | 1,523,750 | 119,627 |
| Events in quadrant C | 1,564,968 | 114,543 |
| Events in quadrant D | 1,382,568 | 112,654 |
| Mode M0 | |||
|---|---|---|---|
| Quadrant | BADHDUFLAG | Total packets | Discarded packets |
| A | 0 | 5913 | 2 |
| B | 0 | 6229 | 1 |
| C | 0 | 6287 | 1 |
| D | 0 | 6057 | 1 |
| Mode SS | |||
|---|---|---|---|
| Quadrant | BADHDUFLAG | Total packets | Discarded packets |
| A | 0 | 56 | 0 |
| B | 0 | 56 | 0 |
| C | 0 | 56 | 0 |
| D | 0 | 56 | 0 |
| Mode M9 | |||
|---|---|---|---|
| Quadrant | BADHDUFLAG | Total packets | Discarded packets |
| A | 0 | 4 | 0 |
| B | 0 | 4 | 0 |
| C | 0 | 4 | 0 |
| D | 0 | 4 | 0 |
| Quadrant | Total seconds | Saturated seconds | Saturation percentage |
|---|---|---|---|
| A | 2832 | 117 | 4.131356% |
| B | 2832 | 142 | 5.014124% |
| C | 2832 | 108 | 3.813559% |
| D | 2832 | 116 | 4.096045% |
Noise dominated data is calculated using 1-second bins in cleaned event files. If a bin has >2000 counts, and if more than 50% of those come from <1% of pixels, then it is considered to be noise-dominated and hence unusable.
| Quadrant | # 1 sec bins | Bins with >0 counts | Bins with >2000 counts | High rate bins dominated by noise | Noise dominated (total time) | Noise dominated (detector-on time) | Marked lightcurve |
|---|---|---|---|---|---|---|---|
| A | 3188 | 2833 | 0 | 0 | 0.00% | 0.00% | 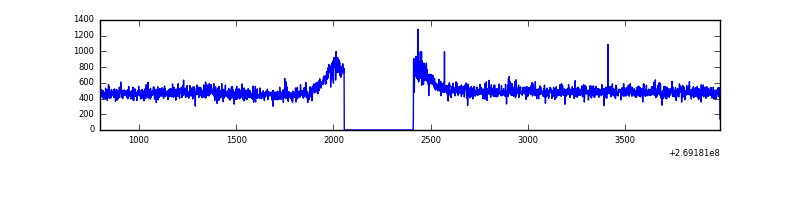 |
| B | 3188 | 2833 | 1 | 1 | 0.03% | 0.04% | 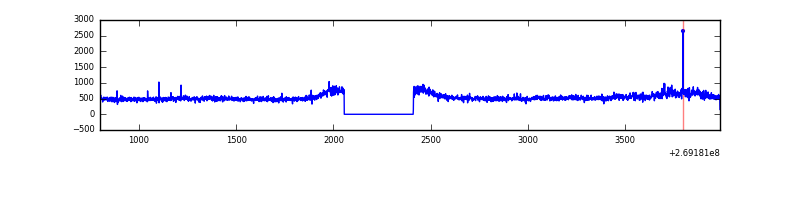 |
| C | 3188 | 2833 | 0 | 0 | 0.00% | 0.00% | 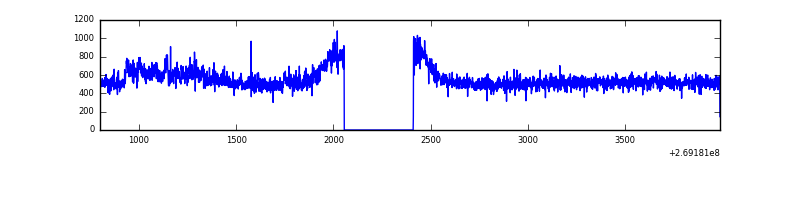 |
| D | 3188 | 2833 | 9 | 9 | 0.28% | 0.32% | 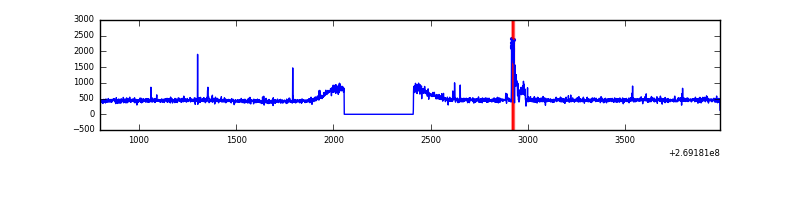 |
Top three noisy pixels from each quadrant. If the there are fewer than three noisy pixels in the level2.evt file, extra rows are filled as -1
| Pixel properties | Quadrant properties | ||||||
|---|---|---|---|---|---|---|---|
| Quadrant | DetID | PixID | Counts | Sigma | Mean | Median | Sigma |
| A | 12 | 189 | 3659 | 42.81 | 366 | 358 | 77.1 |
| A | 0 | 226 | 3219 | 37.1 | 366 | 358 | 77.1 |
| A | 3 | 137 | 2806 | 31.75 | 366 | 358 | 77.1 |
| B | 3 | 64 | 96417 | 1314.75 | 364 | 354 | 73.1 |
| B | 12 | 111 | 8950 | 117.65 | 364 | 354 | 73.1 |
| B | 11 | 111 | 7773 | 101.54 | 364 | 354 | 73.1 |
| C | 3 | 233 | 194924 | 2330.48 | 350 | 351 | 83.5 |
| C | 7 | 247 | 3379 | 36.27 | 350 | 351 | 83.5 |
| C | 13 | 61 | 2487 | 25.58 | 350 | 351 | 83.5 |
| D | 13 | 104 | 52134 | 592.21 | 351 | 339 | 87.5 |
| D | 2 | 234 | 9864 | 108.91 | 351 | 339 | 87.5 |
| D | 14 | 226 | 3505 | 36.2 | 351 | 339 | 87.5 |
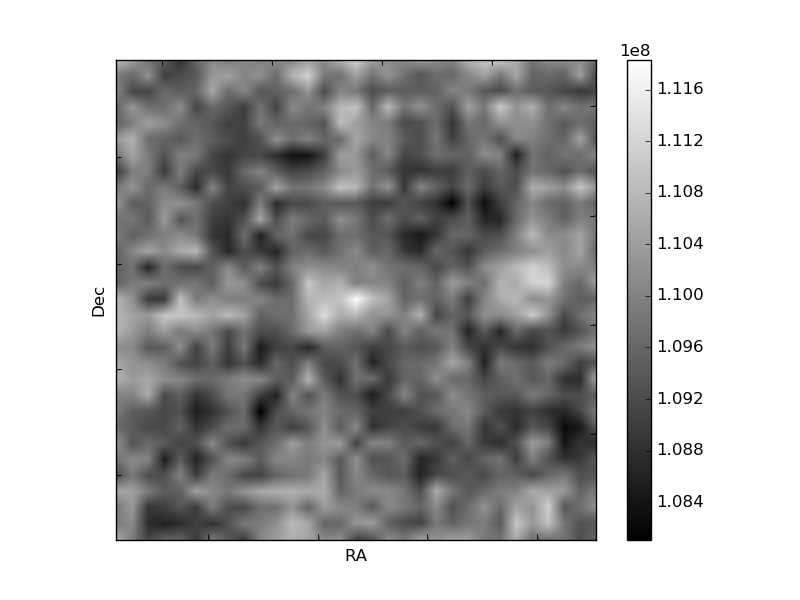
Histogram calculated using DETX and DETY for each event in the final _common_clean file
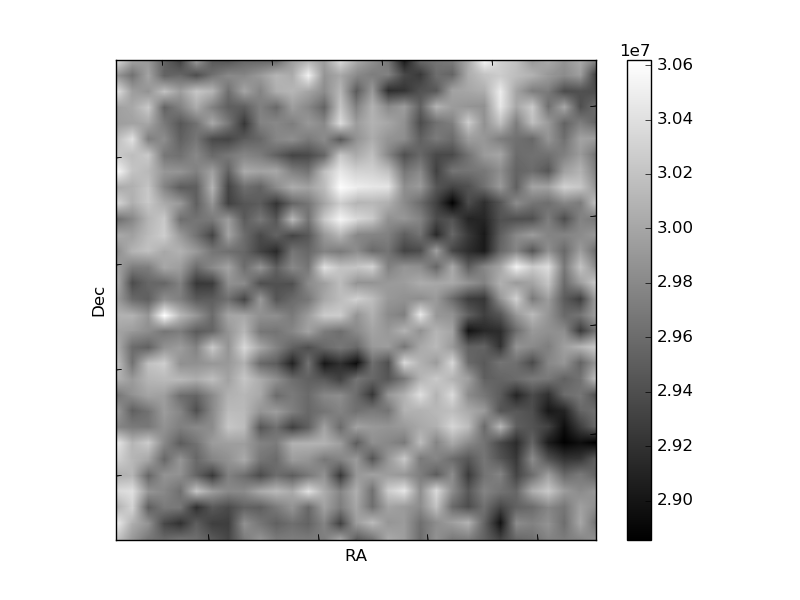
| Quadrant A | 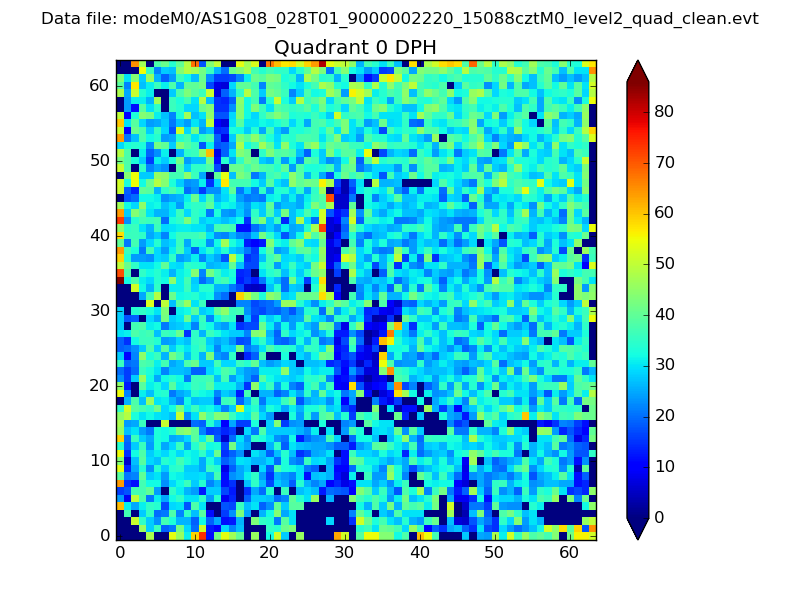 |
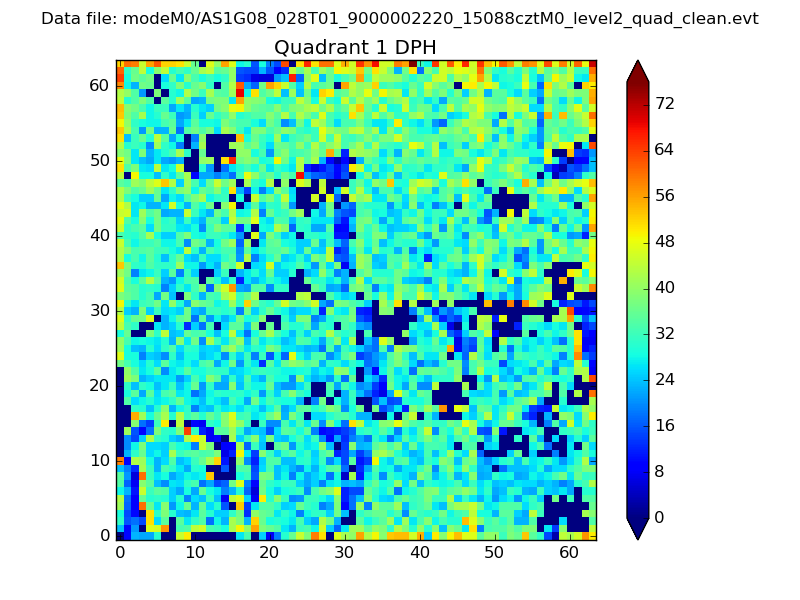 |
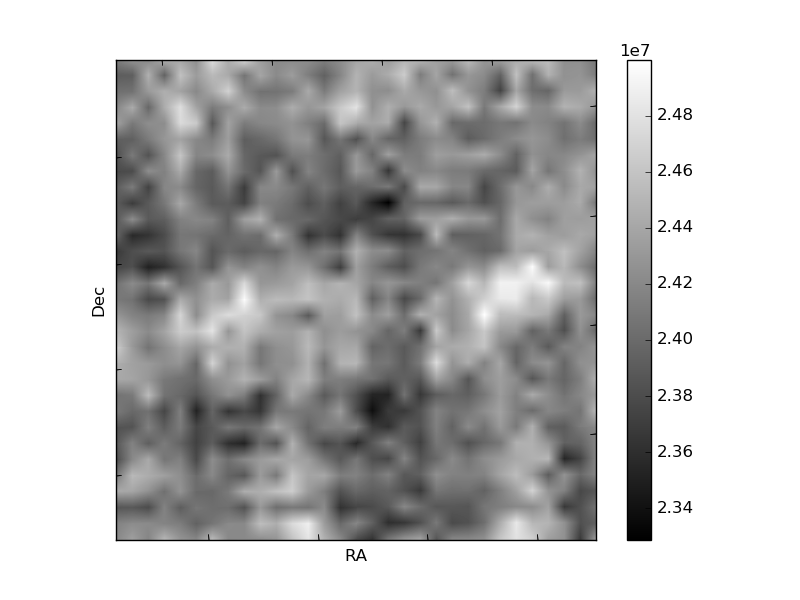
Quadrant B |
|---|---|---|---|
| Quadrant D | 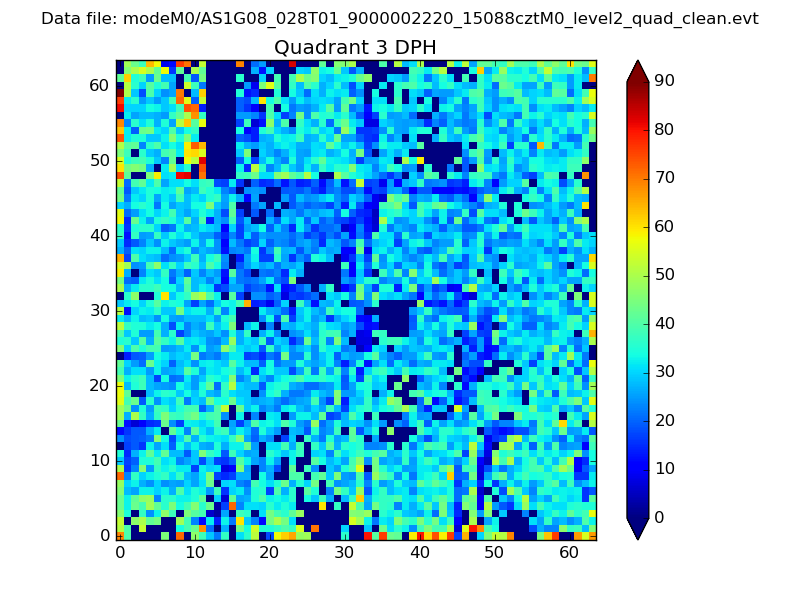 |
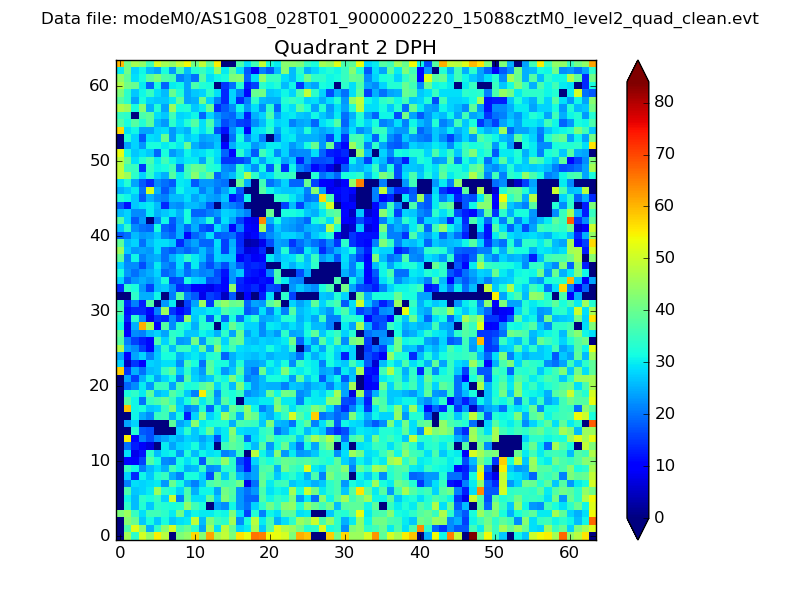 |
Quadrant C |
| Plot type | Count rate plots | Images |
|---|---|---|
| Comparison with Poisson distribution Blue bars denote a histogram of data divided into 1 sec bins. Red curve is a Poisson curve with rate = median count rate of data. |
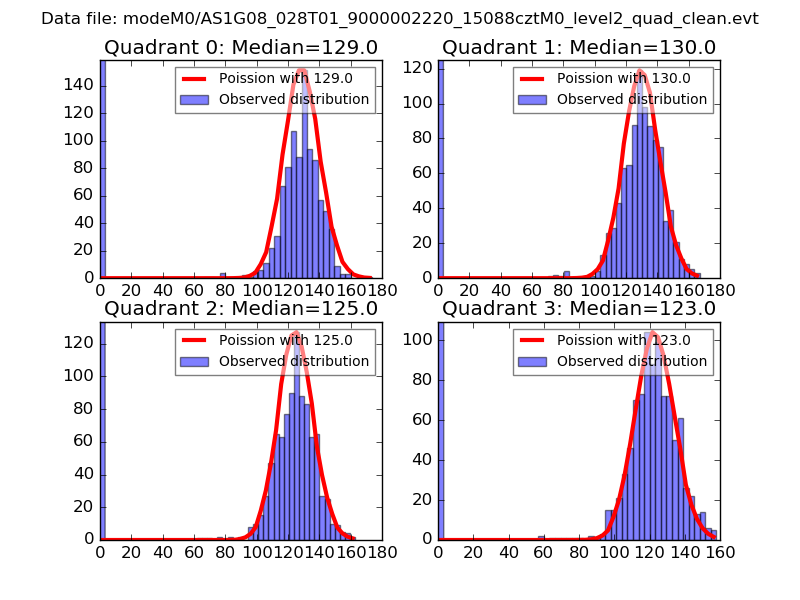 |
 |
| Quadrant-wise count rates Data is divided into 100 sec bins |
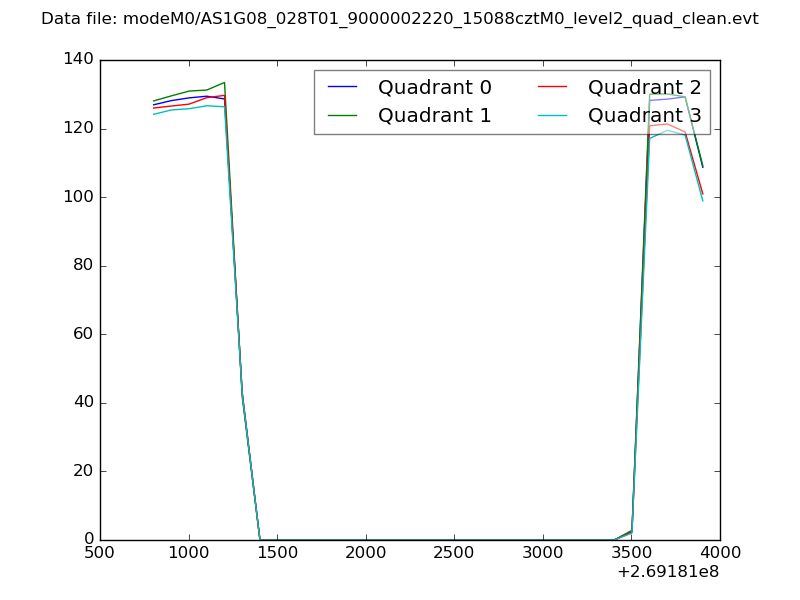 |
|
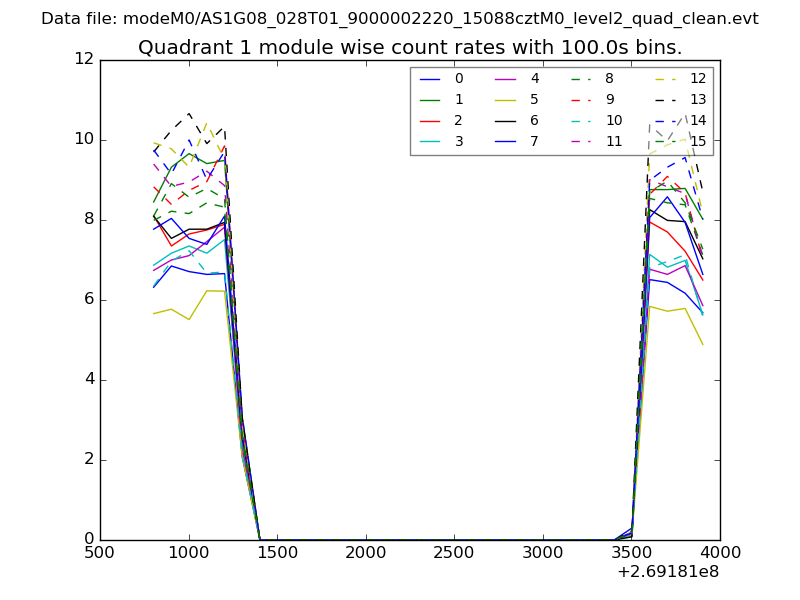
| Module-wise count rates for Quadrant A Data is divided into 100 sec bins |
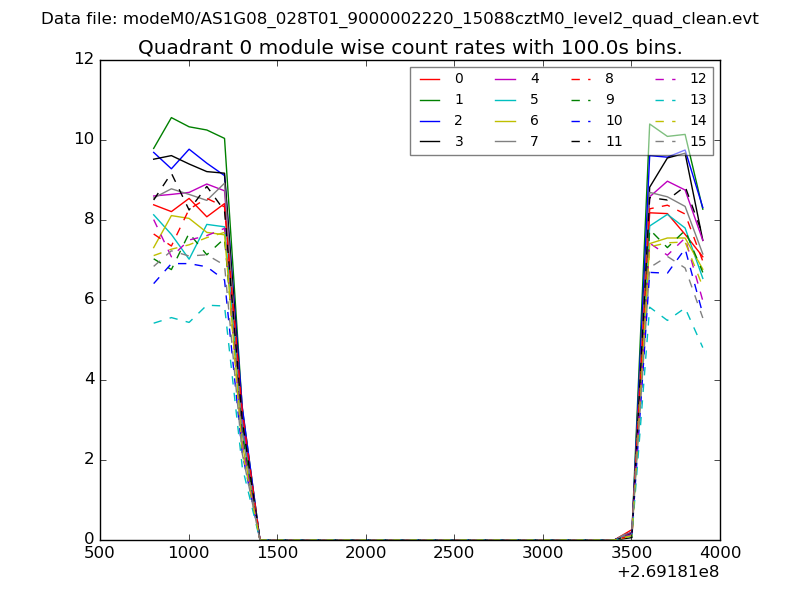 |
 |
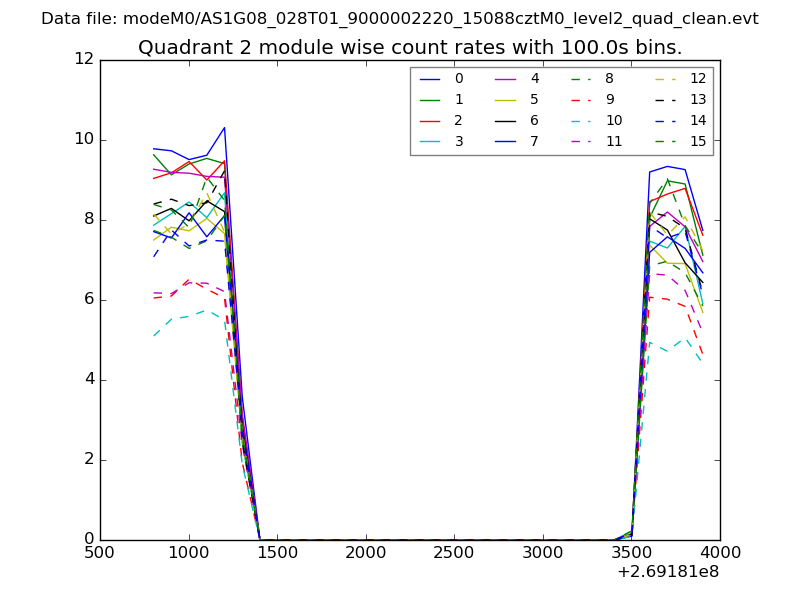
| Module-wise count rates for Quadrant B Data is divided into 100 sec bins |
 |
 |
| Module-wise count rates for Quadrant C Data is divided into 100 sec bins |
 |
 |
| Module-wise count rates for Quadrant D Data is divided into 100 sec bins |
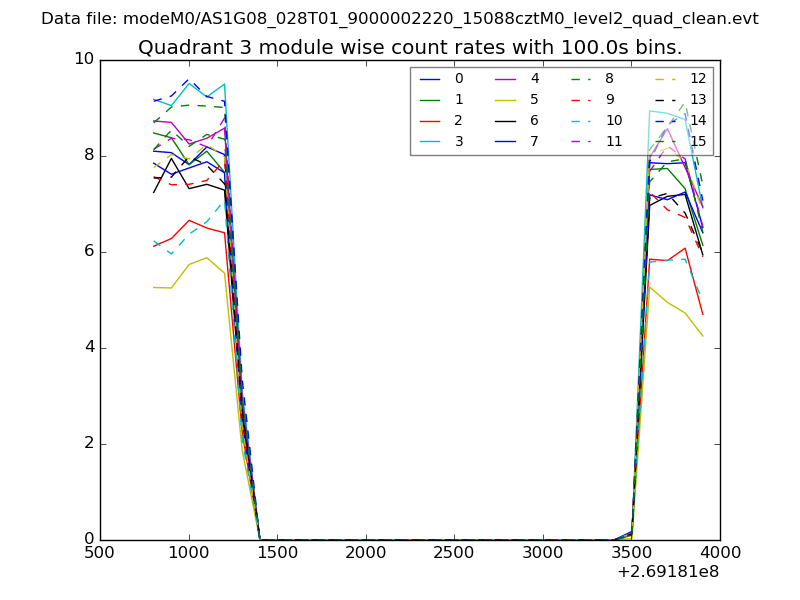 |
 |
| Parameter | Plot |
|---|---|
| CZT HV Monitor | 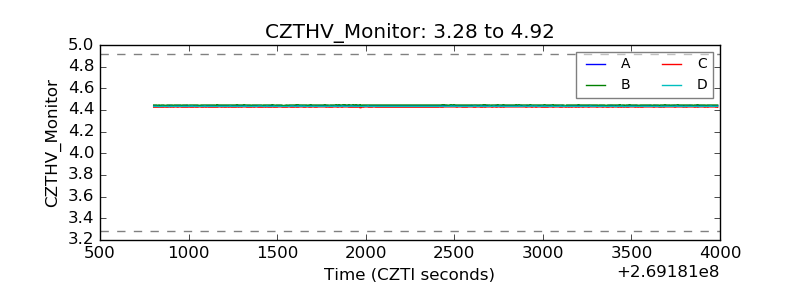 |
| D_VDD | 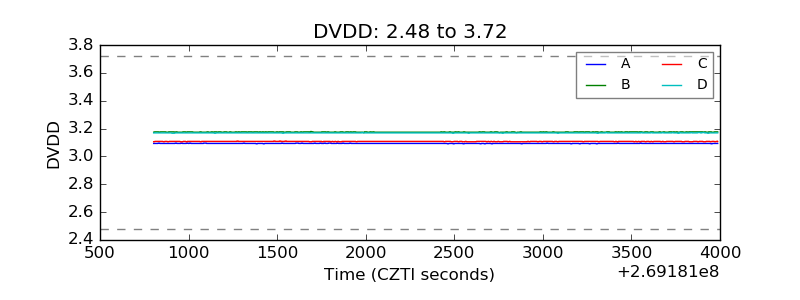 |
| Temperature 1 | 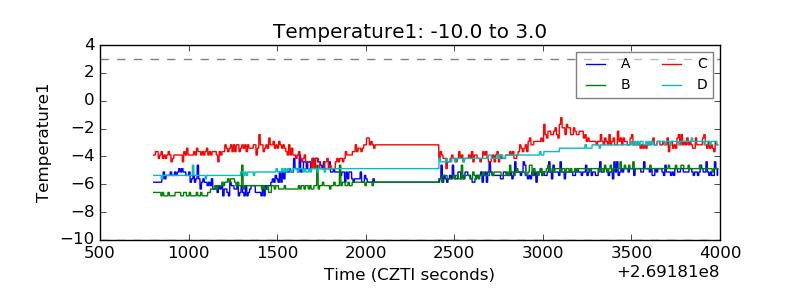 |
| Veto HV Monitor |  |
| Veto LLD | 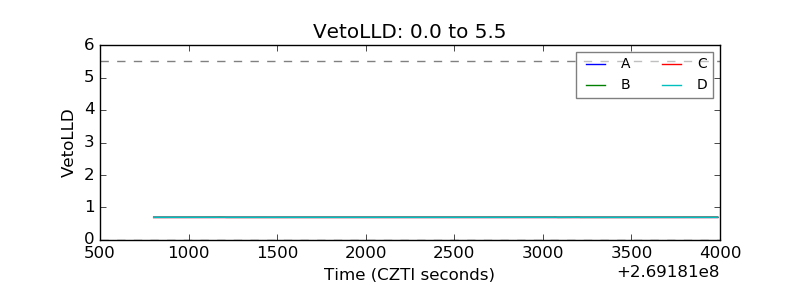 |
| Alpha Counter | 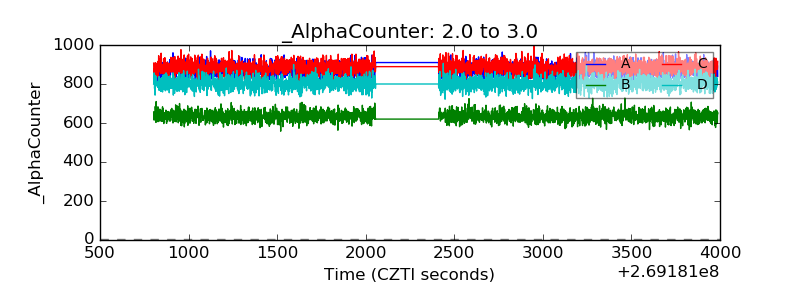 |
| _CPM_Rate | 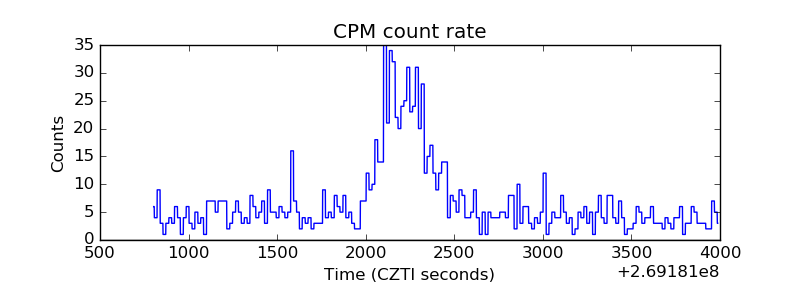 |
| CZT Counter | 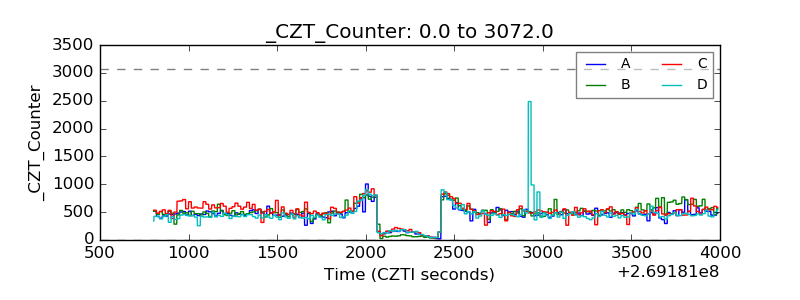 |
| +2.5 Volts monitor |  |
| +5 Volts monitor |  |
| _ROLL_ROT | 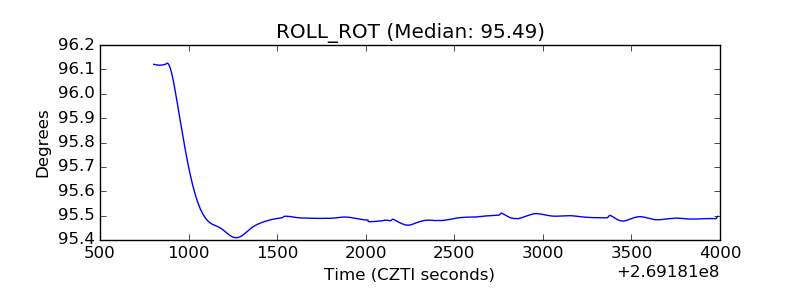 |
| _Roll_DEC | 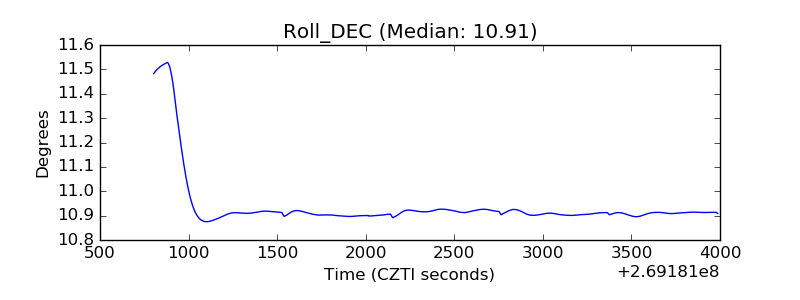 |
| _Roll_RA | 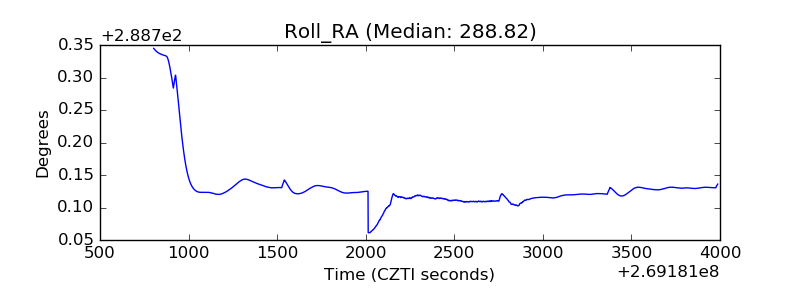 |
| Veto Counter | 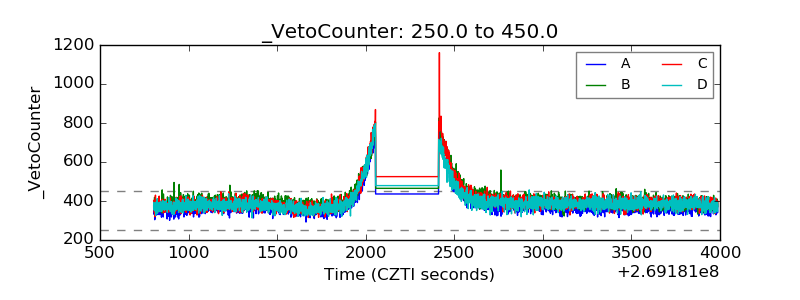 |