| Param | Original file | Final file |
|---|---|---|
| Filename | modeM0/AS1G08_028T01_9000002220_15090cztM0_level2.evt | modeM0/AS1G08_028T01_9000002220_15090cztM0_level2_quad_clean.evt |
| Size (bytes) | 877,046,400 | 165,536,640 |
| Size | 836.4 MB | 157.9 MB |
| Events in quadrant A | 6,019,438 | 1,054,239 |
| Events in quadrant B | 6,726,000 | 1,063,088 |
| Events in quadrant C | 6,656,839 | 1,023,655 |
| Events in quadrant D | 6,298,200 | 993,735 |
| Mode M0 | |||
|---|---|---|---|
| Quadrant | BADHDUFLAG | Total packets | Discarded packets |
| A | 0 | 26044 | 4 |
| B | 0 | 28077 | 3 |
| C | 0 | 27209 | 3 |
| D | 0 | 27657 | 3 |
| Mode SS | |||
|---|---|---|---|
| Quadrant | BADHDUFLAG | Total packets | Discarded packets |
| A | 0 | 256 | 0 |
| B | 0 | 256 | 0 |
| C | 0 | 256 | 0 |
| D | 0 | 256 | 0 |
| Mode M9 | |||
|---|---|---|---|
| Quadrant | BADHDUFLAG | Total packets | Discarded packets |
| A | 0 | 15 | 0 |
| B | 0 | 15 | 0 |
| C | 0 | 15 | 0 |
| D | 0 | 16 | 0 |
| Quadrant | Total seconds | Saturated seconds | Saturation percentage |
|---|---|---|---|
| A | 12719 | 175 | 1.375894% |
| B | 12719 | 241 | 1.894803% |
| C | 12719 | 173 | 1.360170% |
| D | 12719 | 211 | 1.658935% |
Noise dominated data is calculated using 1-second bins in cleaned event files. If a bin has >2000 counts, and if more than 50% of those come from <1% of pixels, then it is considered to be noise-dominated and hence unusable.
| Quadrant | # 1 sec bins | Bins with >0 counts | Bins with >2000 counts | High rate bins dominated by noise | Noise dominated (total time) | Noise dominated (detector-on time) | Marked lightcurve |
|---|---|---|---|---|---|---|---|
| A | 14040 | 12720 | 0 | 0 | 0.00% | 0.00% | 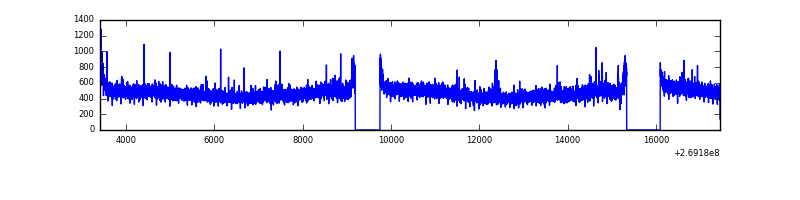 |
| B | 14040 | 12720 | 4 | 4 | 0.03% | 0.03% | 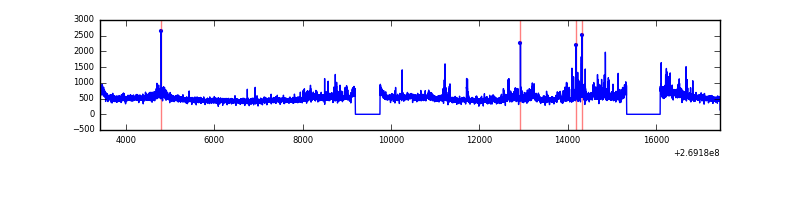 |
| C | 14040 | 12720 | 0 | 0 | 0.00% | 0.00% | 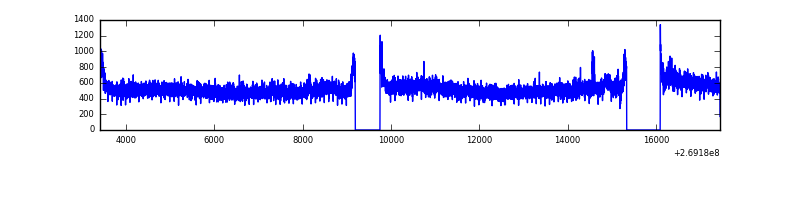 |
| D | 14040 | 12720 | 85 | 85 | 0.61% | 0.67% | 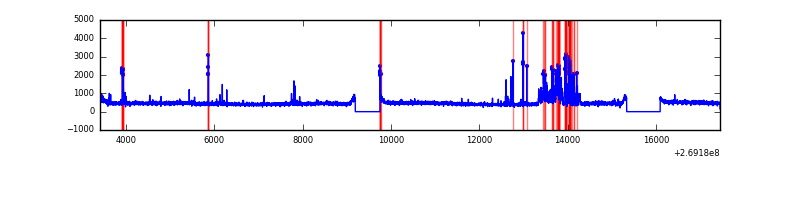 |
Top three noisy pixels from each quadrant. If the there are fewer than three noisy pixels in the level2.evt file, extra rows are filled as -1
| Pixel properties | Quadrant properties | ||||||
|---|---|---|---|---|---|---|---|
| Quadrant | DetID | PixID | Counts | Sigma | Mean | Median | Sigma |
| A | 12 | 189 | 84877 | 266.19 | 1544 | 1507 | 313.2 |
| A | 0 | 226 | 13451 | 38.13 | 1544 | 1507 | 313.2 |
| A | 12 | 194 | 11028 | 30.4 | 1544 | 1507 | 313.2 |
| B | 3 | 64 | 513515 | 1726.59 | 1538 | 1498 | 296.5 |
| B | 10 | 245 | 206119 | 690.01 | 1538 | 1498 | 296.5 |
| B | 12 | 111 | 36750 | 118.87 | 1538 | 1498 | 296.5 |
| C | 3 | 233 | 574499 | 1649.55 | 1497 | 1505 | 347.4 |
| C | 3 | 9 | 233964 | 669.21 | 1497 | 1505 | 347.4 |
| C | 7 | 247 | 15381 | 39.95 | 1497 | 1505 | 347.4 |
| D | 9 | 1 | 539299 | 1475.75 | 1496 | 1450 | 364.5 |
| D | 13 | 104 | 59247 | 158.58 | 1496 | 1450 | 364.5 |
| D | 2 | 234 | 40404 | 106.88 | 1496 | 1450 | 364.5 |
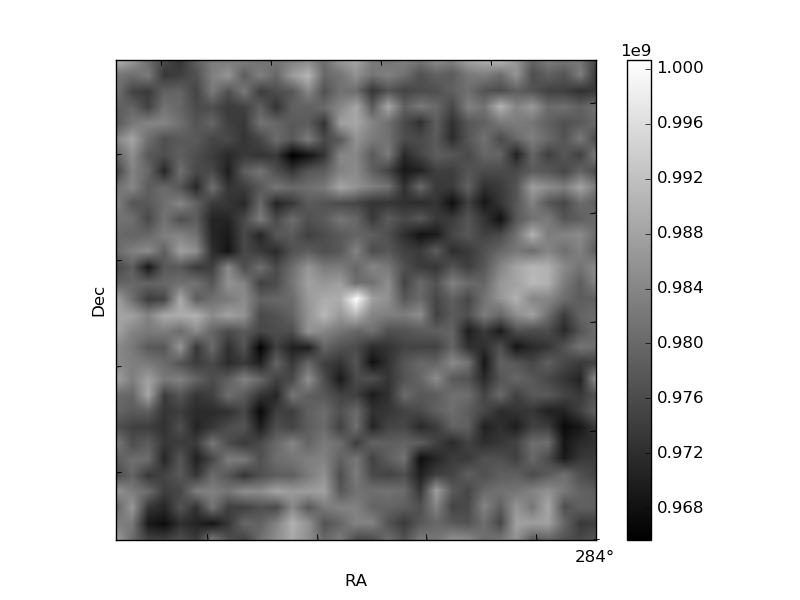
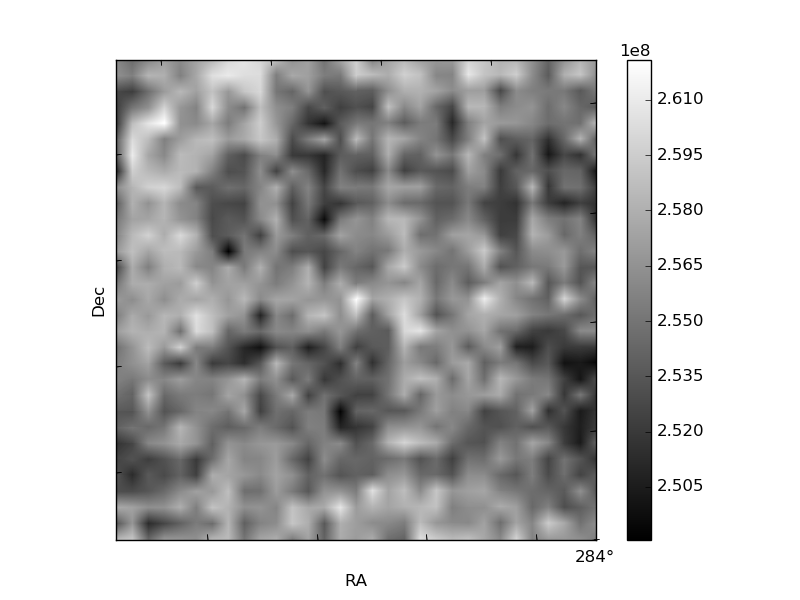
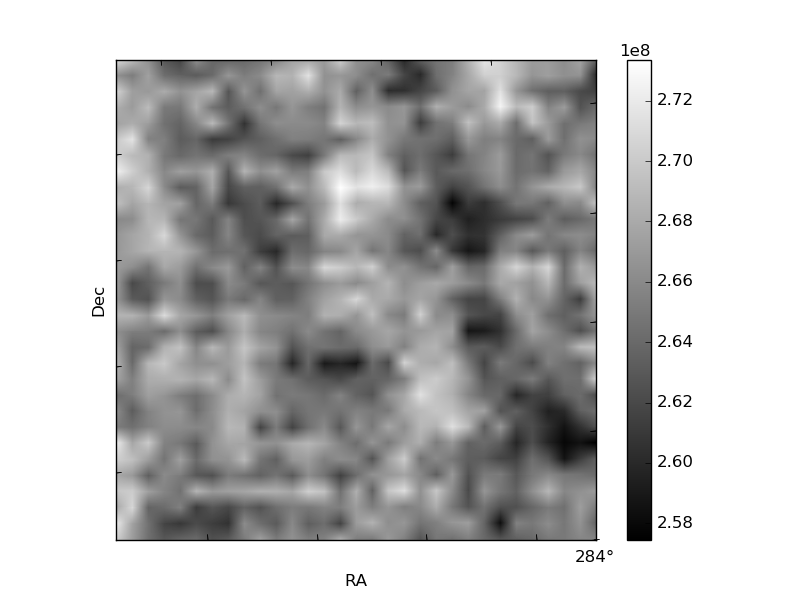
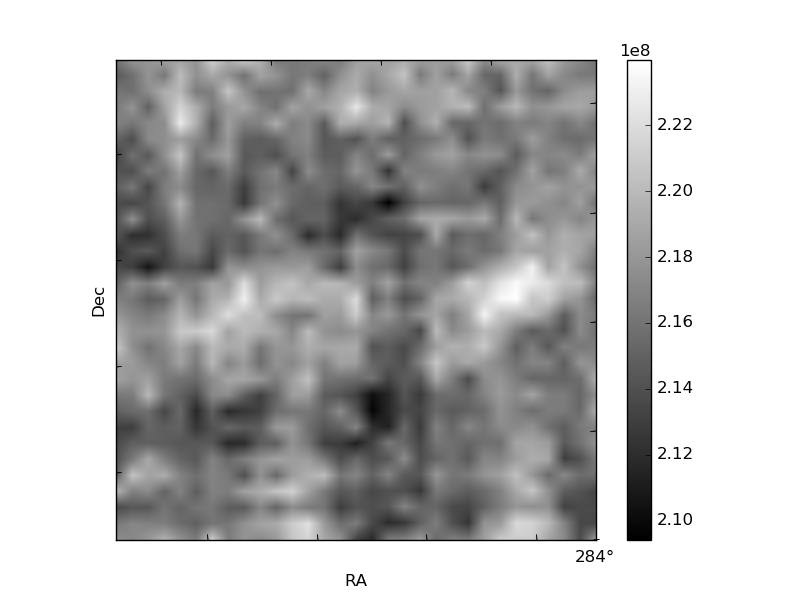
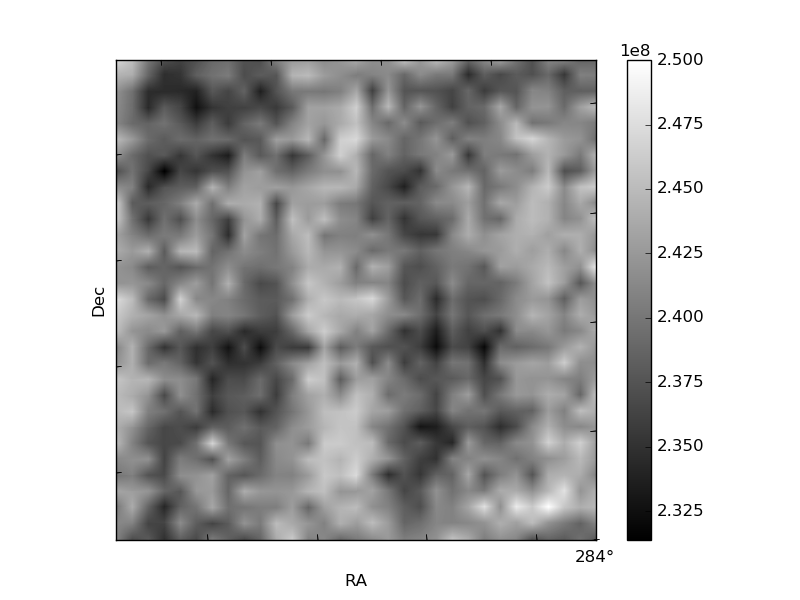
Histogram calculated using DETX and DETY for each event in the final _common_clean file
| Quadrant A | 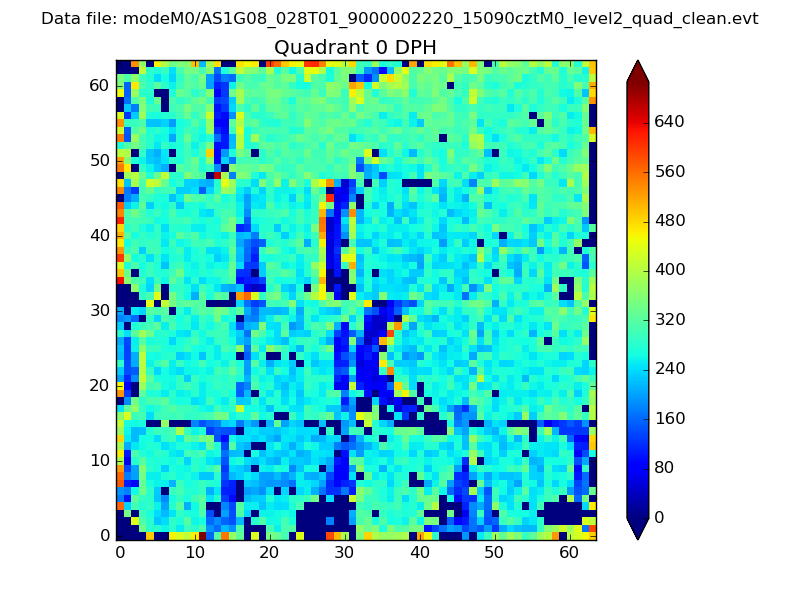 |
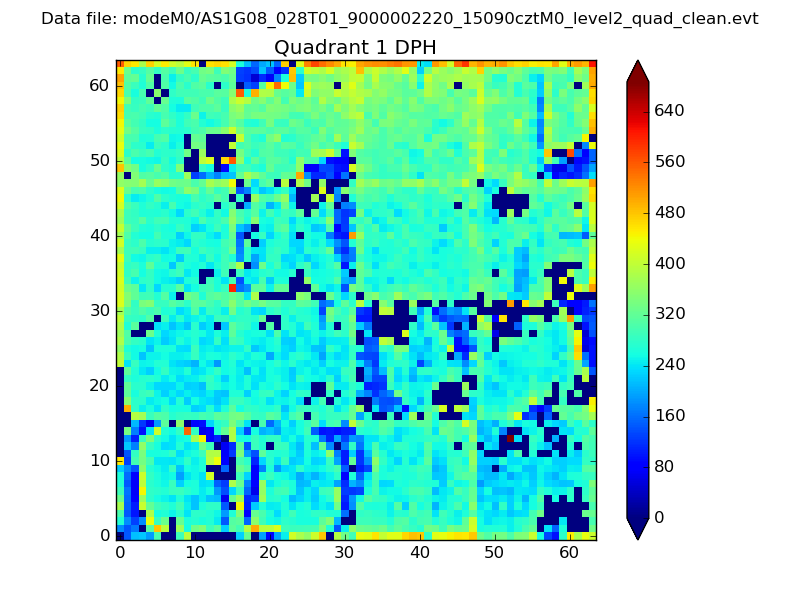 |
Quadrant B |
|---|---|---|---|
| Quadrant D | 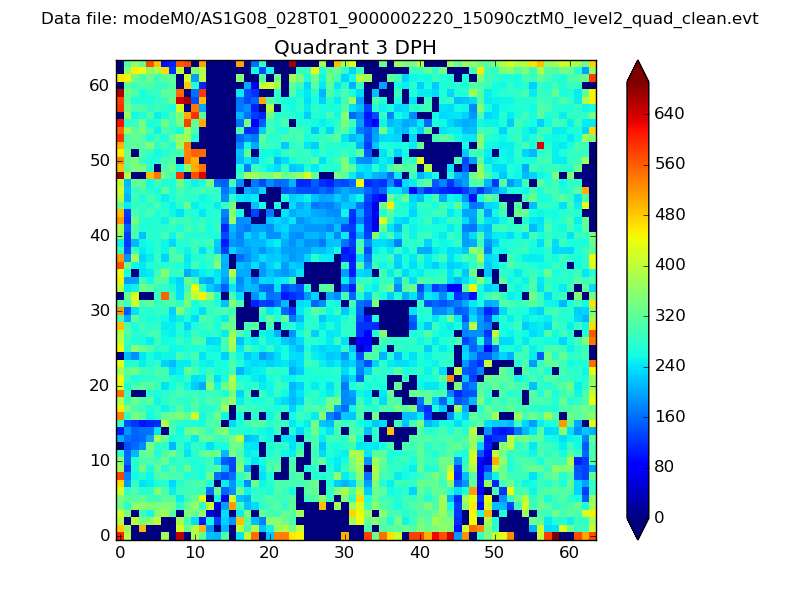 |
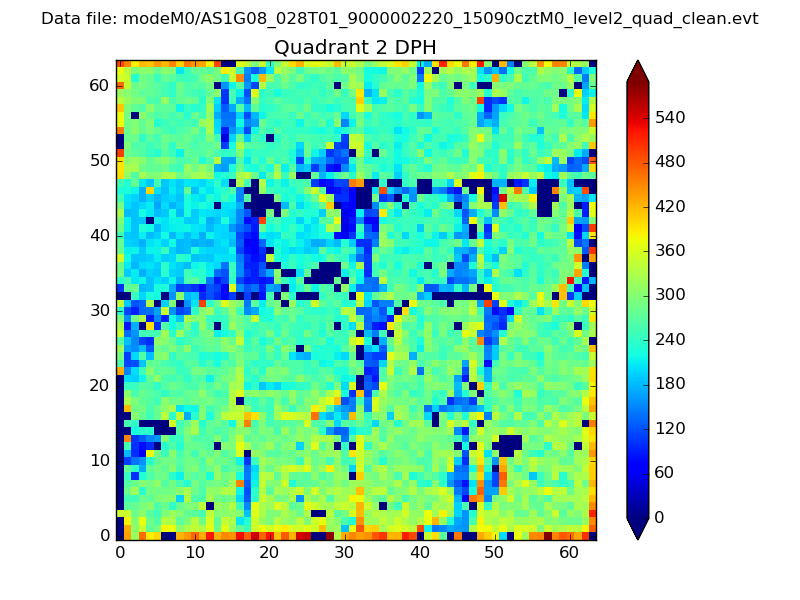 |
Quadrant C |
| Plot type | Count rate plots | Images |
|---|---|---|
| Comparison with Poisson distribution Blue bars denote a histogram of data divided into 1 sec bins. Red curve is a Poisson curve with rate = median count rate of data. |
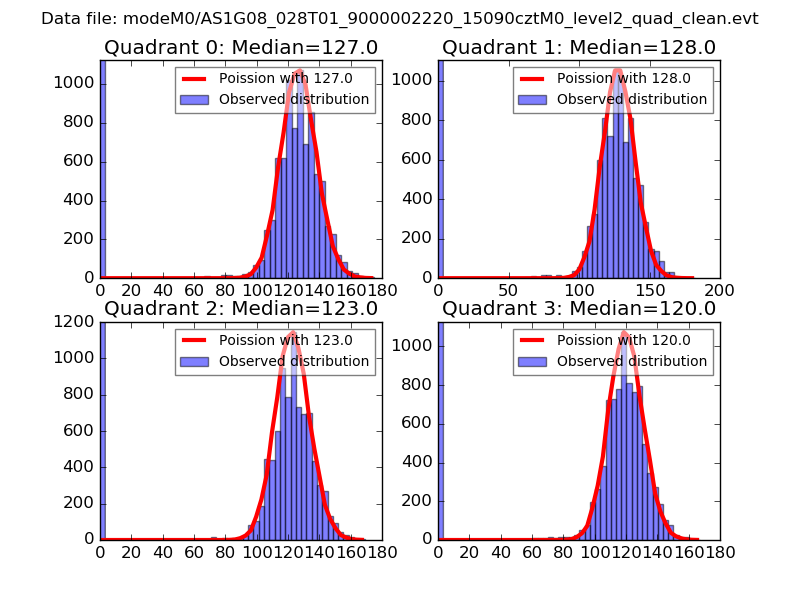 |
 |
| Quadrant-wise count rates Data is divided into 100 sec bins |
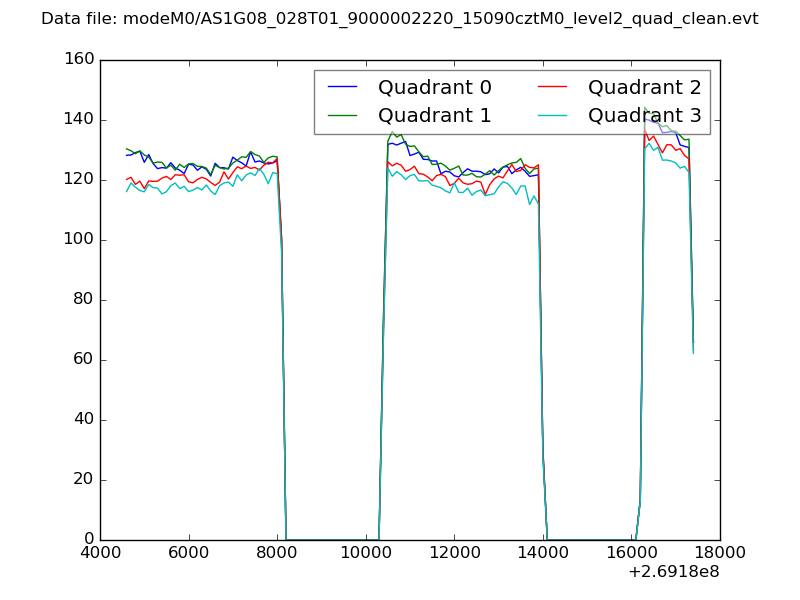 |
|
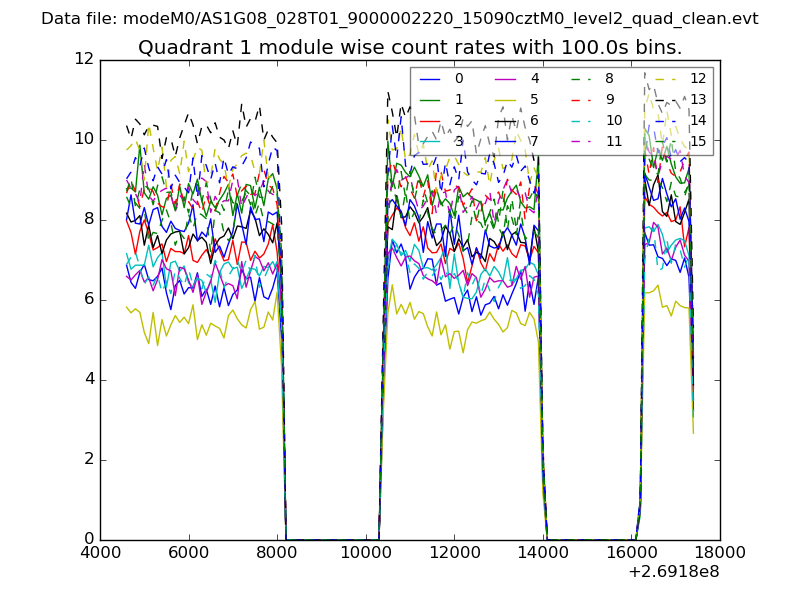
| Module-wise count rates for Quadrant A Data is divided into 100 sec bins |
 |
 |
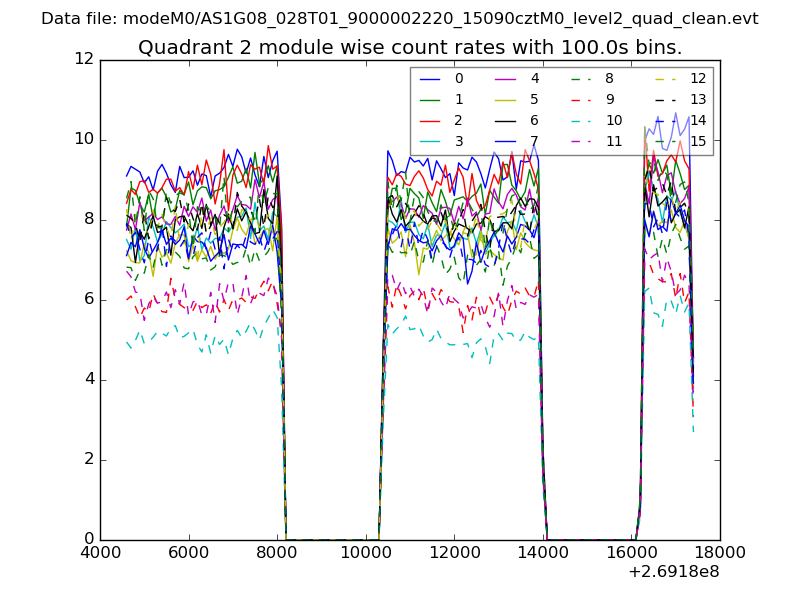
| Module-wise count rates for Quadrant B Data is divided into 100 sec bins |
 |
 |
| Module-wise count rates for Quadrant C Data is divided into 100 sec bins |
 |
 |
| Module-wise count rates for Quadrant D Data is divided into 100 sec bins |
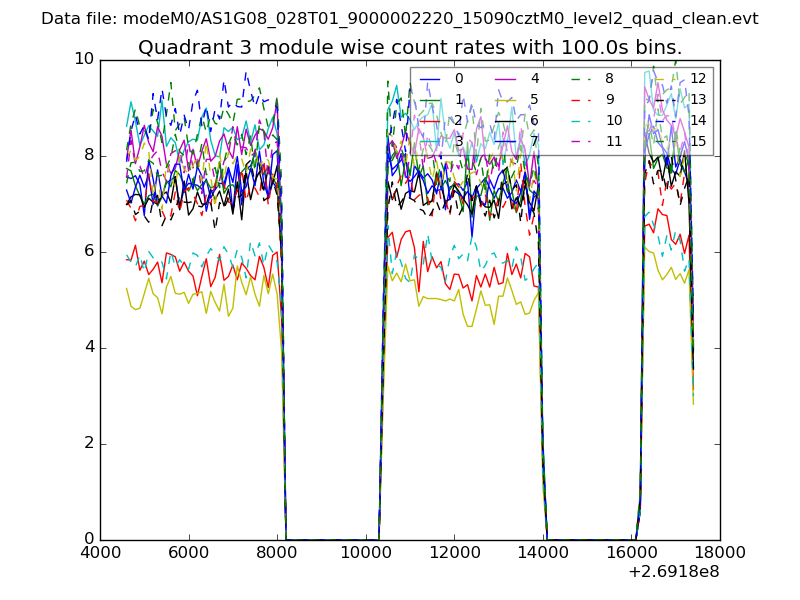 |
 |
| Parameter | Plot |
|---|---|
| CZT HV Monitor | 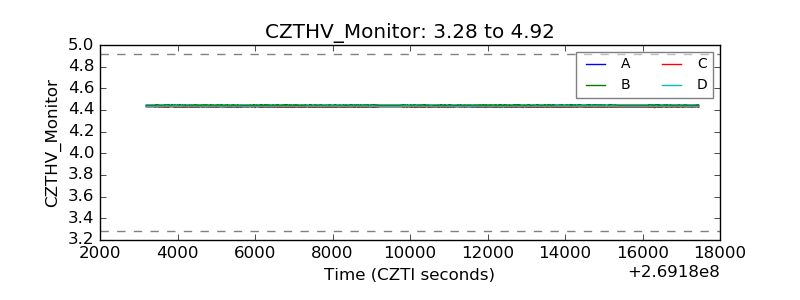 |
| D_VDD |  |
| Temperature 1 | 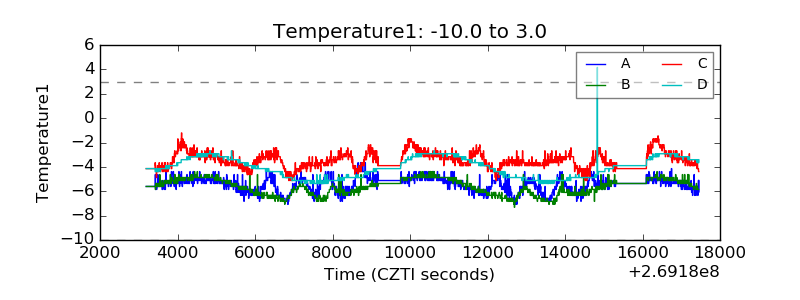 |
| Veto HV Monitor | 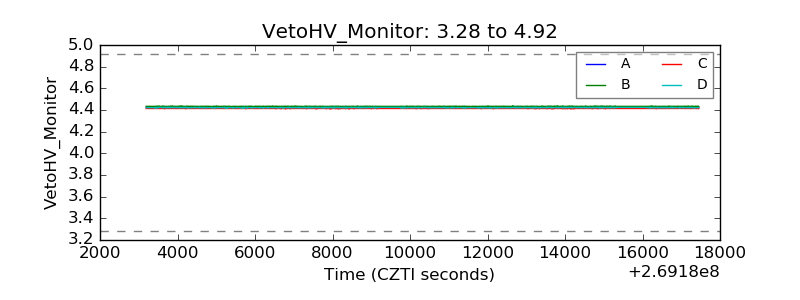 |
| Veto LLD | 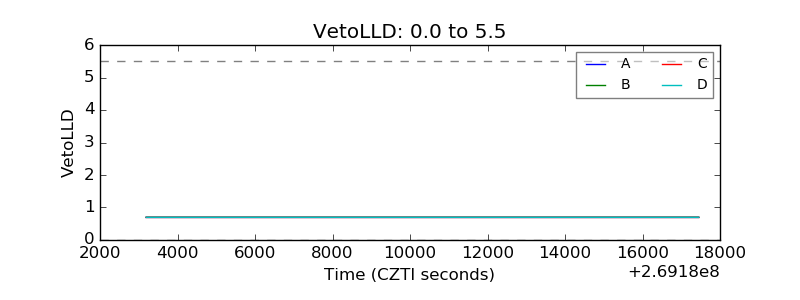 |
| Alpha Counter | 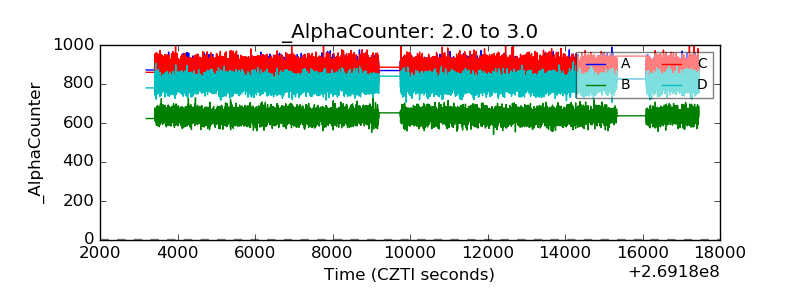 |
| _CPM_Rate | 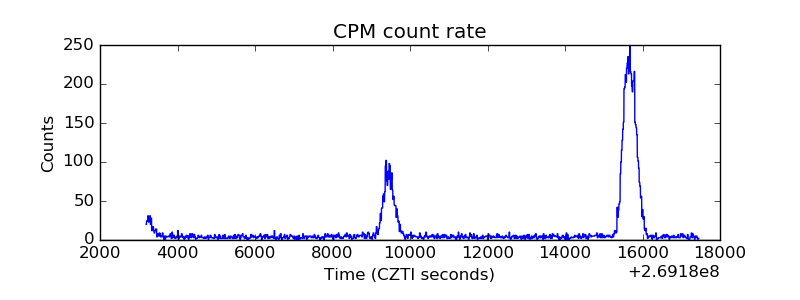 |
| CZT Counter | 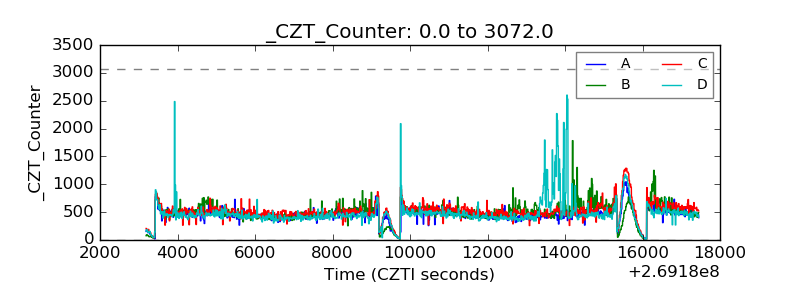 |
| +2.5 Volts monitor |  |
| +5 Volts monitor |  |
| _ROLL_ROT | 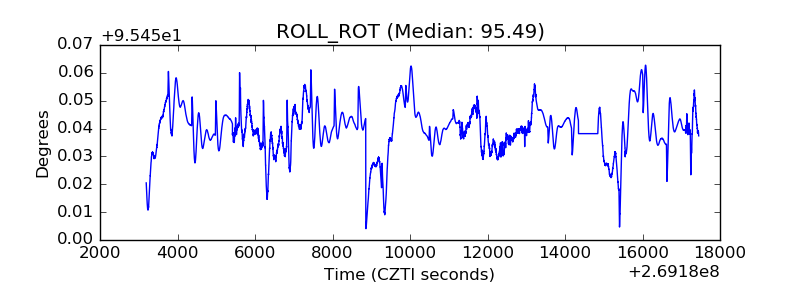 |
| _Roll_DEC | 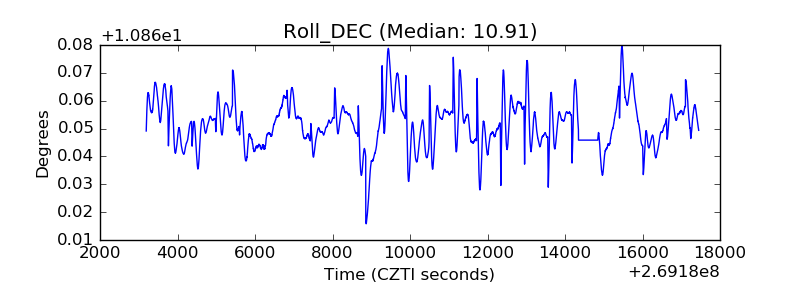 |
| _Roll_RA | 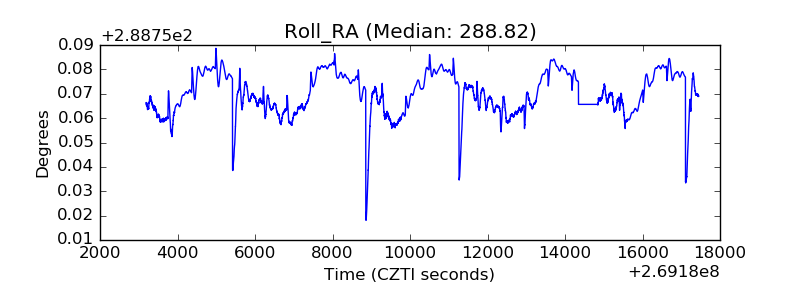 |
| Veto Counter | 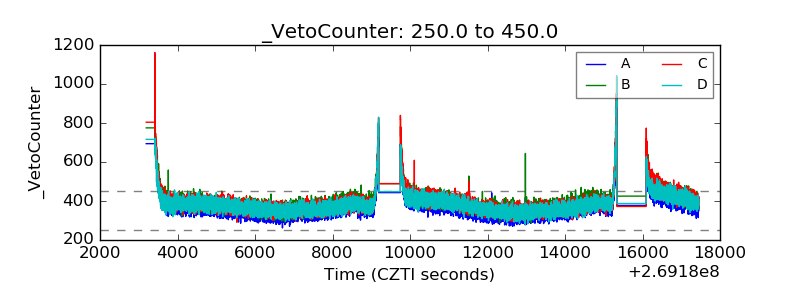 |