| Param | Original file | Final file |
|---|---|---|
| Filename | modeM0/AS1G08_028T01_9000002220_15092cztM0_level2.evt | modeM0/AS1G08_028T01_9000002220_15092cztM0_level2_quad_clean.evt |
| Size (bytes) | 495,455,040 | 98,089,920 |
| Size | 472.5 MB | 93.5 MB |
| Events in quadrant A | 3,479,370 | 620,035 |
| Events in quadrant B | 3,635,117 | 639,925 |
| Events in quadrant C | 4,044,049 | 616,242 |
| Events in quadrant D | 3,358,335 | 593,928 |
| Mode M0 | |||
|---|---|---|---|
| Quadrant | BADHDUFLAG | Total packets | Discarded packets |
| A | 0 | 15025 | 3 |
| B | 0 | 15205 | 2 |
| C | 0 | 16567 | 2 |
| D | 0 | 14989 | 2 |
| Mode SS | |||
|---|---|---|---|
| Quadrant | BADHDUFLAG | Total packets | Discarded packets |
| A | 0 | 148 | 0 |
| B | 0 | 148 | 0 |
| C | 0 | 148 | 0 |
| D | 0 | 148 | 0 |
| Mode M9 | |||
|---|---|---|---|
| Quadrant | BADHDUFLAG | Total packets | Discarded packets |
| A | 0 | 19 | 0 |
| B | 0 | 19 | 0 |
| C | 0 | 19 | 0 |
| D | 0 | 19 | 0 |
| Quadrant | Total seconds | Saturated seconds | Saturation percentage |
|---|---|---|---|
| A | 7179 | 70 | 0.975066% |
| B | 7179 | 88 | 1.225797% |
| C | 7179 | 75 | 1.044714% |
| D | 7179 | 62 | 0.863630% |
Noise dominated data is calculated using 1-second bins in cleaned event files. If a bin has >2000 counts, and if more than 50% of those come from <1% of pixels, then it is considered to be noise-dominated and hence unusable.
| Quadrant | # 1 sec bins | Bins with >0 counts | Bins with >2000 counts | High rate bins dominated by noise | Noise dominated (total time) | Noise dominated (detector-on time) | Marked lightcurve |
|---|---|---|---|---|---|---|---|
| A | 9185 | 7180 | 0 | 0 | 0.00% | 0.00% | 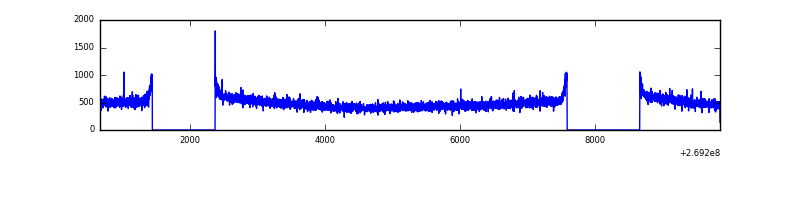 |
| B | 9185 | 7180 | 0 | 0 | 0.00% | 0.00% | 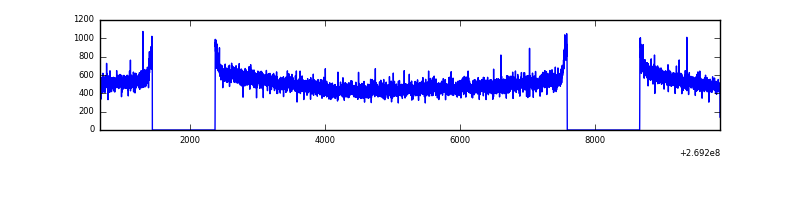 |
| C | 9185 | 7181 | 0 | 0 | 0.00% | 0.00% | 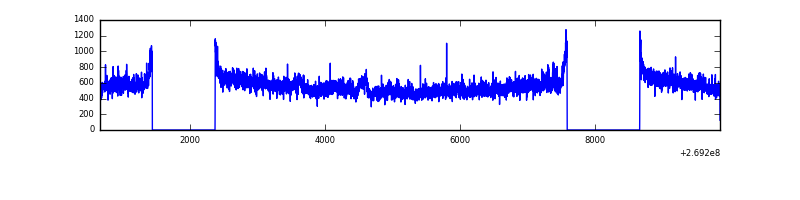 |
| D | 9185 | 7181 | 6 | 6 | 0.07% | 0.08% | 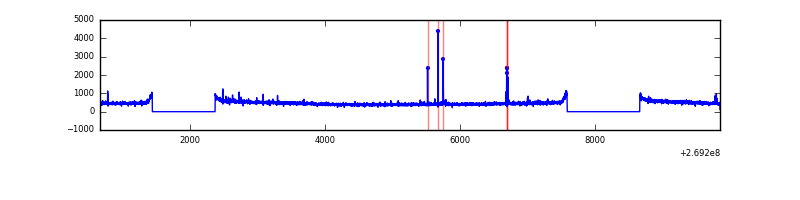 |
Top three noisy pixels from each quadrant. If the there are fewer than three noisy pixels in the level2.evt file, extra rows are filled as -1
| Pixel properties | Quadrant properties | ||||||
|---|---|---|---|---|---|---|---|
| Quadrant | DetID | PixID | Counts | Sigma | Mean | Median | Sigma |
| A | 12 | 189 | 21669 | 115.38 | 899 | 881 | 180.2 |
| A | 0 | 226 | 7817 | 38.5 | 899 | 881 | 180.2 |
| A | 12 | 194 | 6554 | 31.49 | 899 | 881 | 180.2 |
| B | 3 | 64 | 109421 | 624.14 | 901 | 878 | 173.9 |
| B | 12 | 111 | 21124 | 116.42 | 901 | 878 | 173.9 |
| B | 11 | 111 | 18739 | 102.7 | 901 | 878 | 173.9 |
| C | 3 | 233 | 334877 | 1624.21 | 880 | 885 | 205.6 |
| C | 3 | 9 | 269918 | 1308.31 | 880 | 885 | 205.6 |
| C | 13 | 61 | 6240 | 26.04 | 880 | 885 | 205.6 |
| D | 2 | 234 | 25165 | 113.79 | 877 | 852 | 213.7 |
| D | 10 | 70 | 21792 | 98.01 | 877 | 852 | 213.7 |
| D | 13 | 104 | 21334 | 95.86 | 877 | 852 | 213.7 |
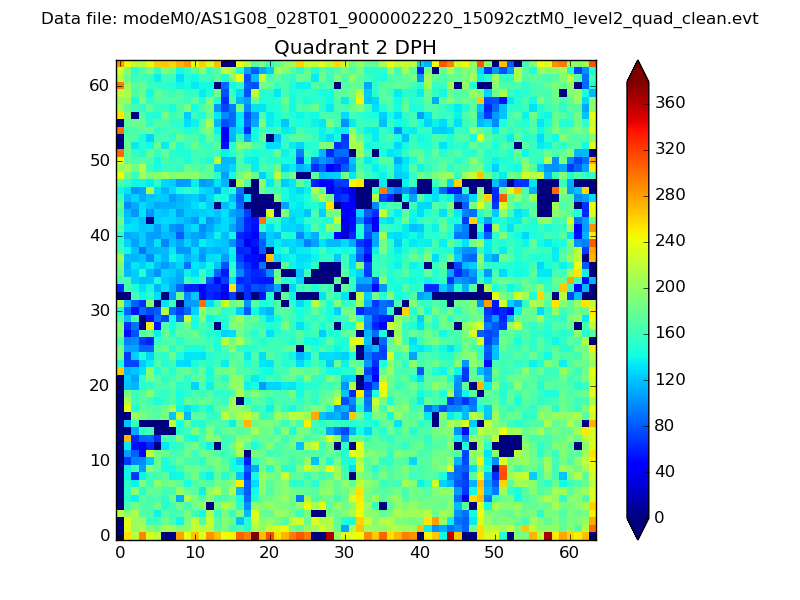
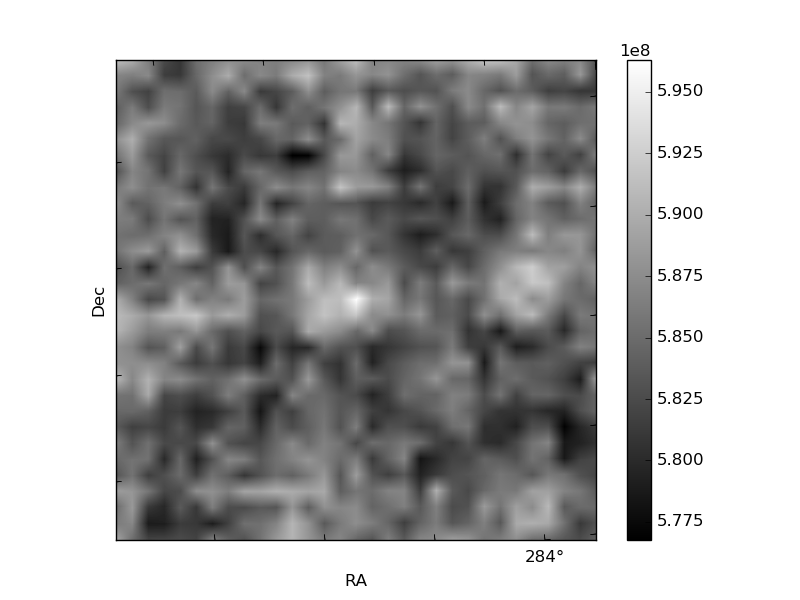
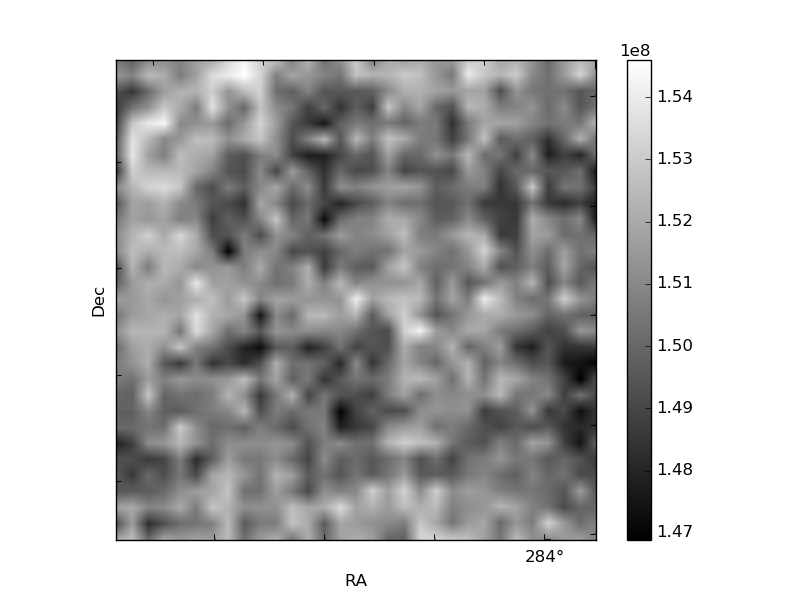
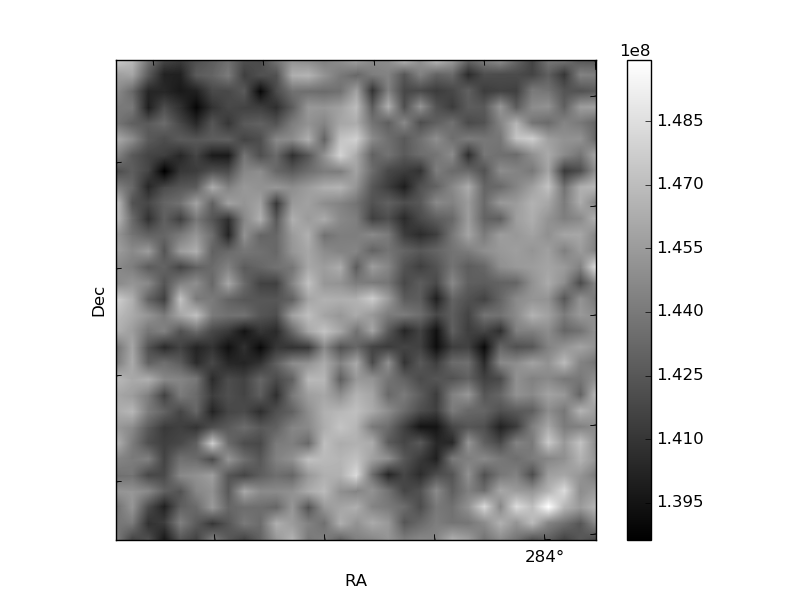
Histogram calculated using DETX and DETY for each event in the final _common_clean file
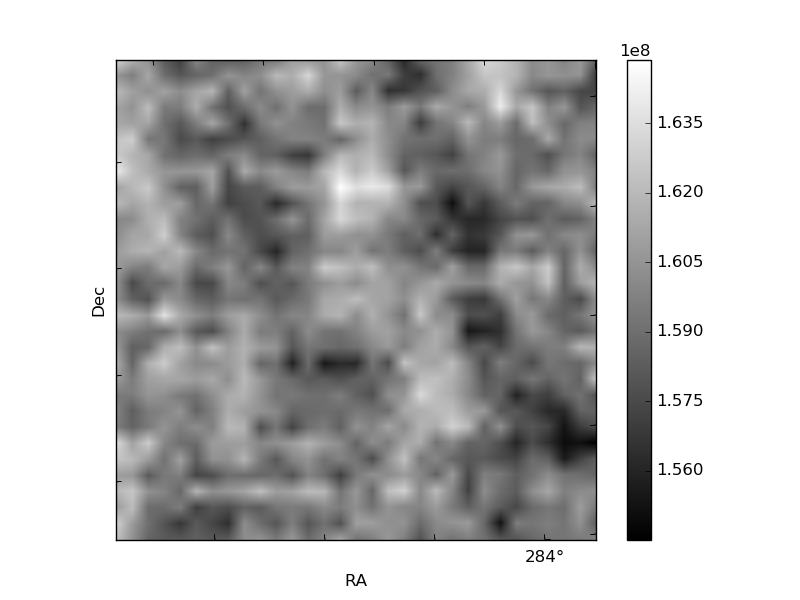
| Quadrant A | 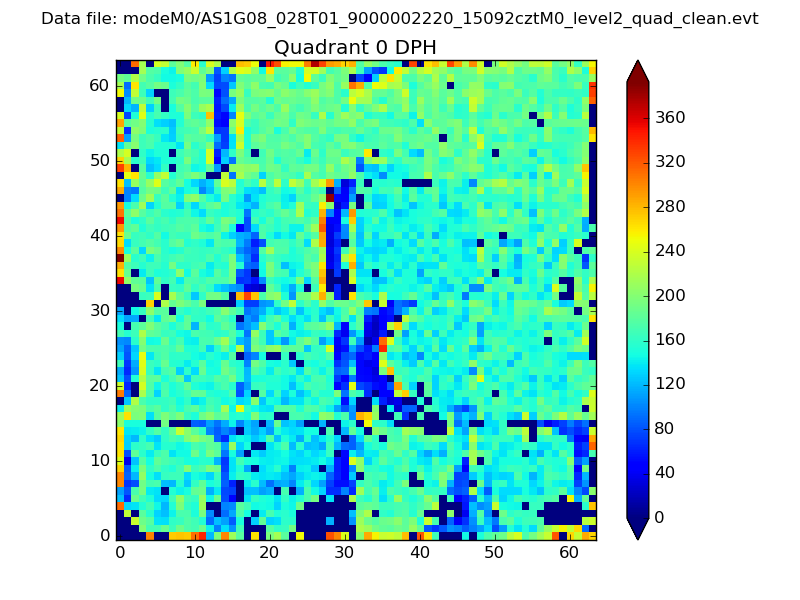 |
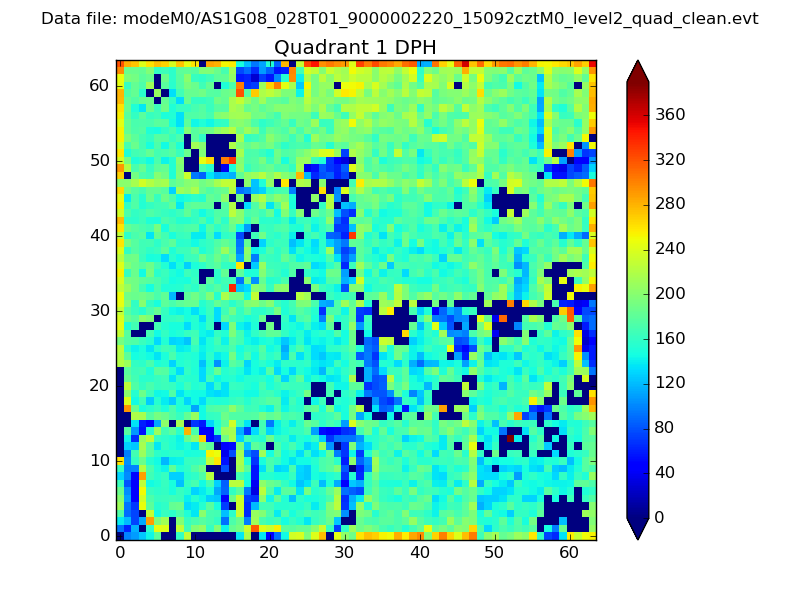 |
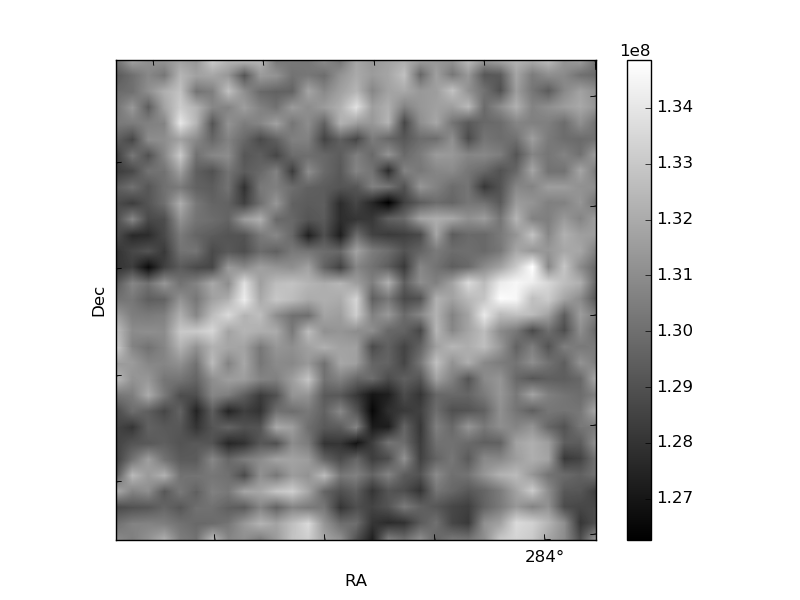
Quadrant B |
|---|---|---|---|
| Quadrant D | 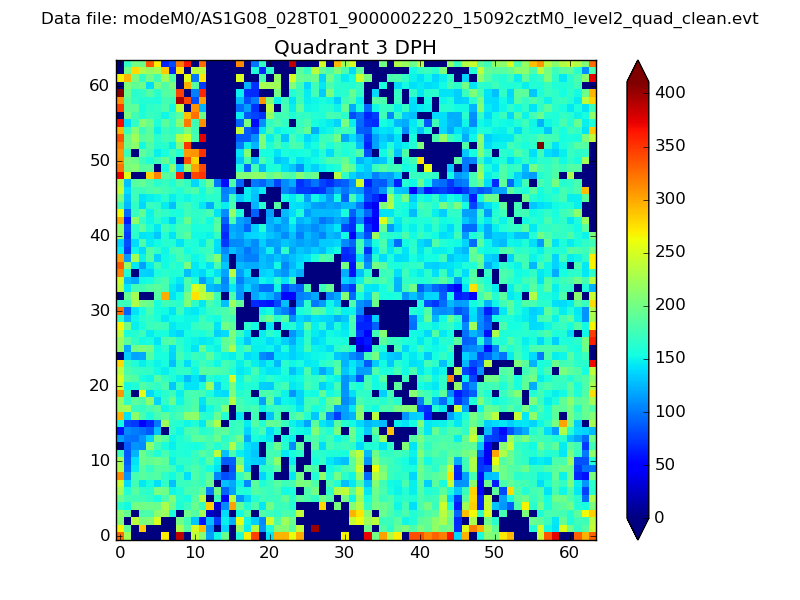 |
 |
Quadrant C |
| Plot type | Count rate plots | Images |
|---|---|---|
| Comparison with Poisson distribution Blue bars denote a histogram of data divided into 1 sec bins. Red curve is a Poisson curve with rate = median count rate of data. |
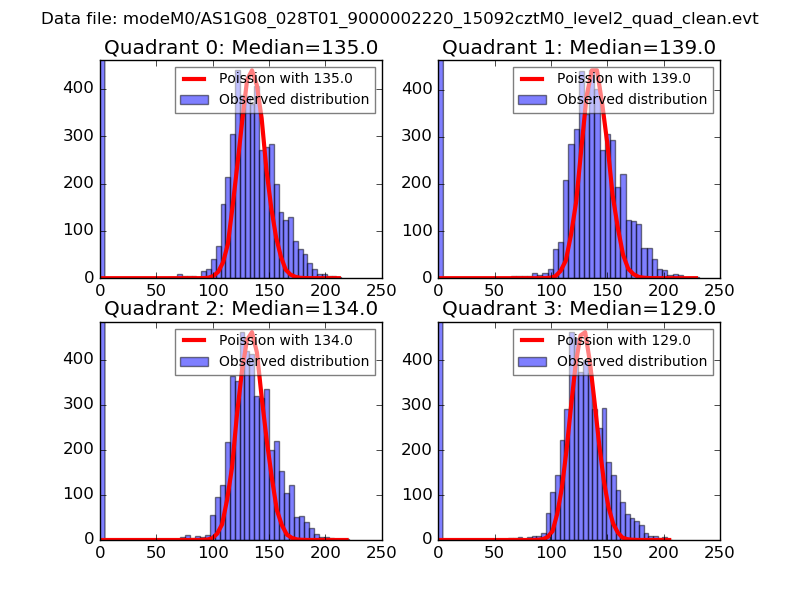 |
 |
| Quadrant-wise count rates Data is divided into 100 sec bins |
 |
|
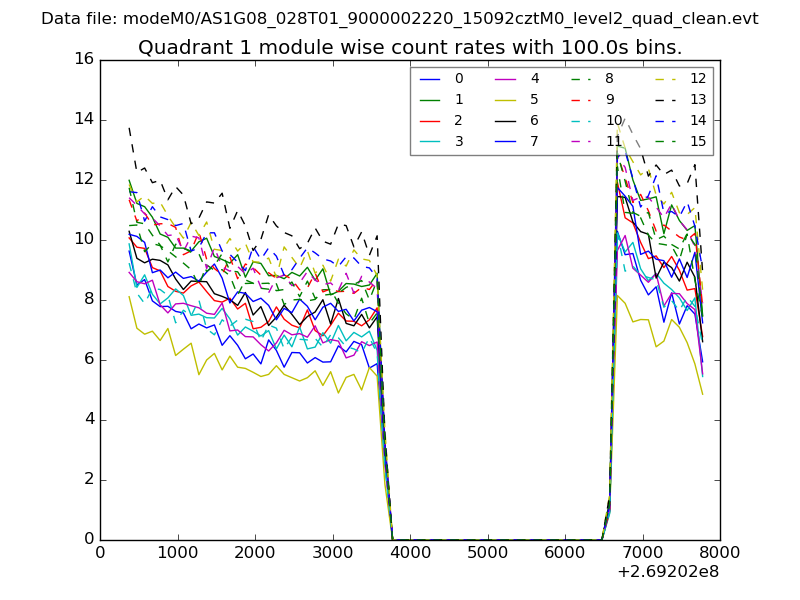
| Module-wise count rates for Quadrant A Data is divided into 100 sec bins |
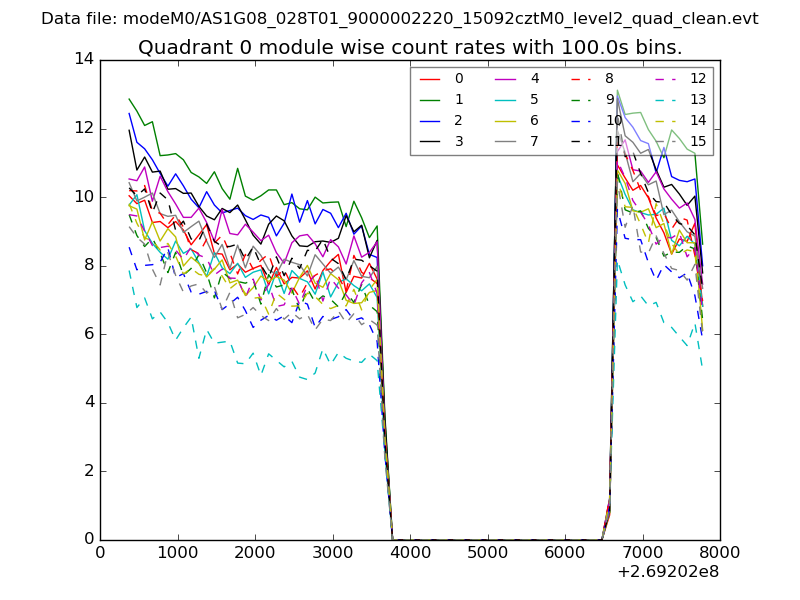 |
 |
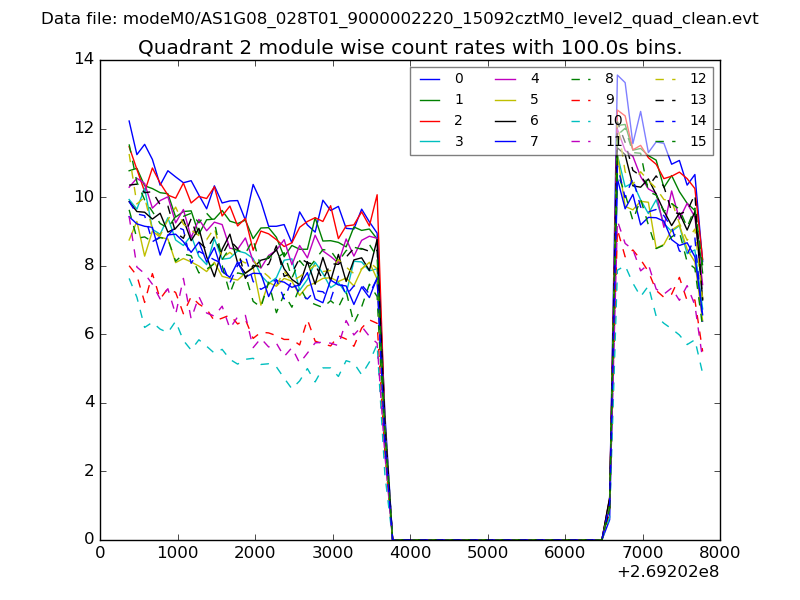
| Module-wise count rates for Quadrant B Data is divided into 100 sec bins |
 |
 |
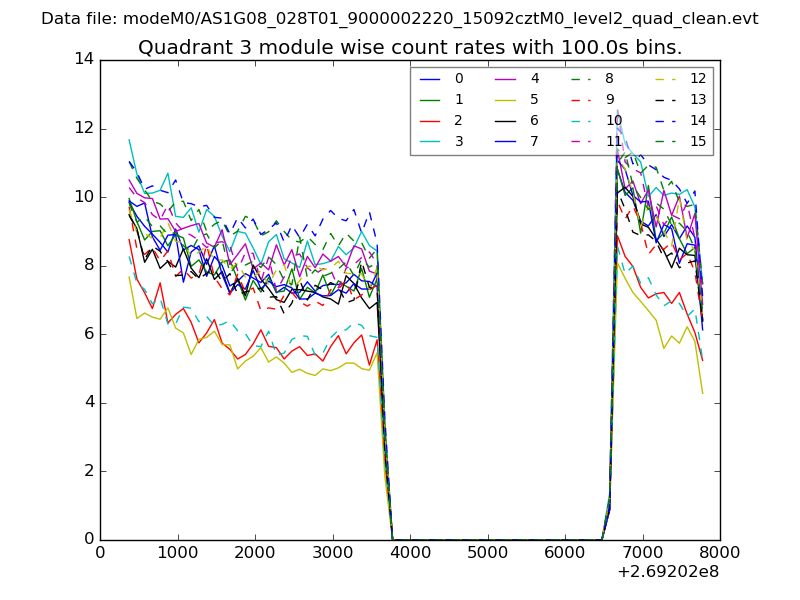
| Module-wise count rates for Quadrant C Data is divided into 100 sec bins |
 |
 |
| Module-wise count rates for Quadrant D Data is divided into 100 sec bins |
 |
 |
| Parameter | Plot |
|---|---|
| CZT HV Monitor |  |
| D_VDD | 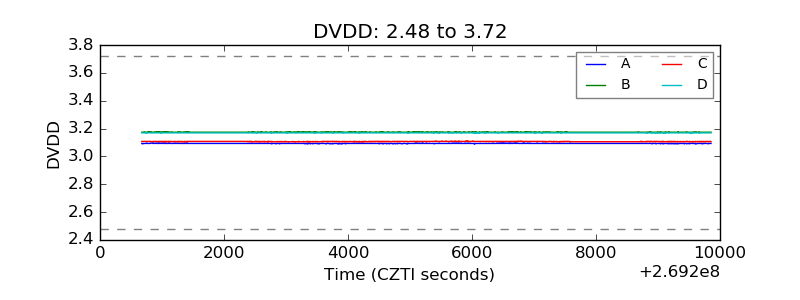 |
| Temperature 1 | 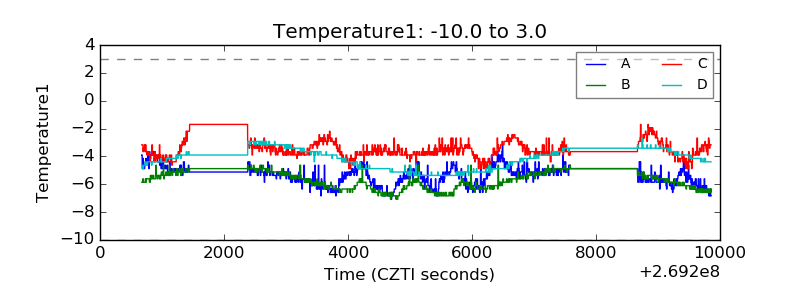 |
| Veto HV Monitor | 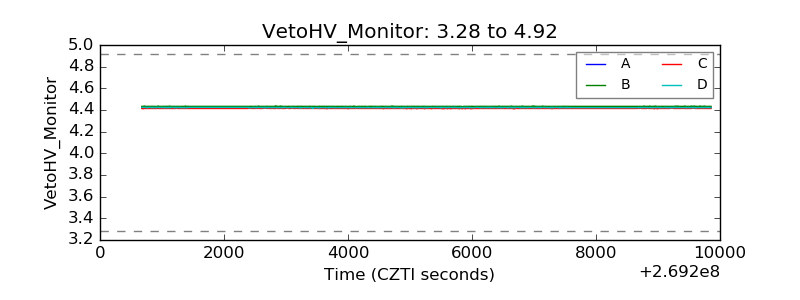 |
| Veto LLD | 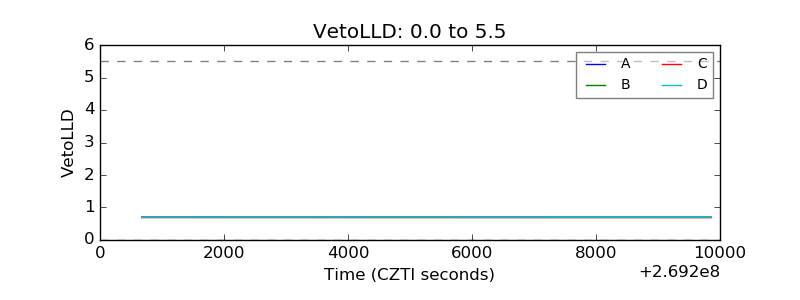 |
| Alpha Counter | 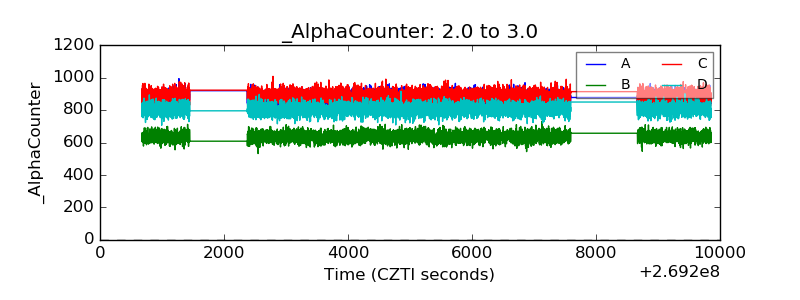 |
| _CPM_Rate | 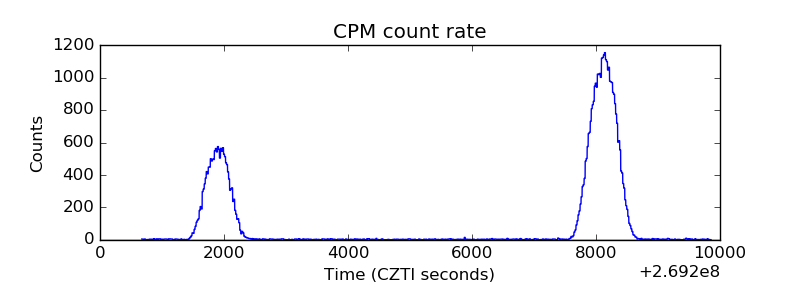 |
| CZT Counter | 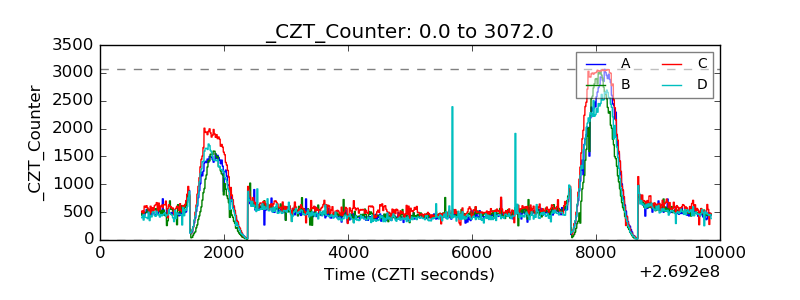 |
| +2.5 Volts monitor |  |
| +5 Volts monitor |  |
| _ROLL_ROT | 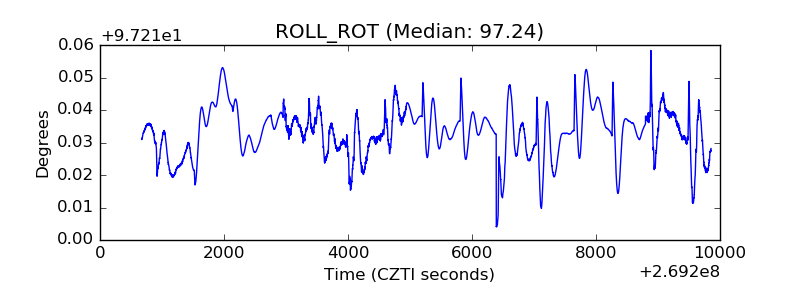 |
| _Roll_DEC | 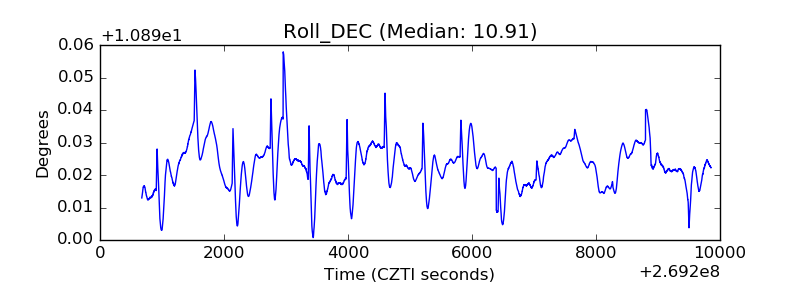 |
| _Roll_RA | 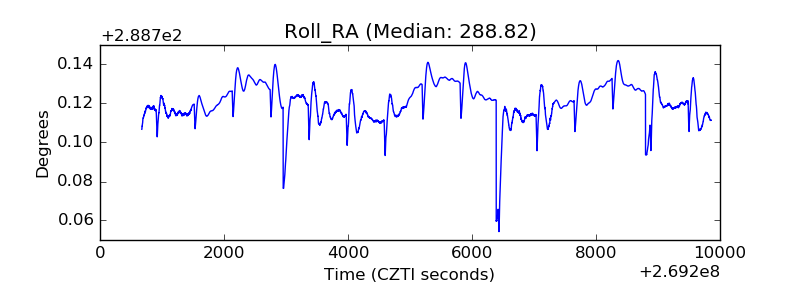 |
| Veto Counter | 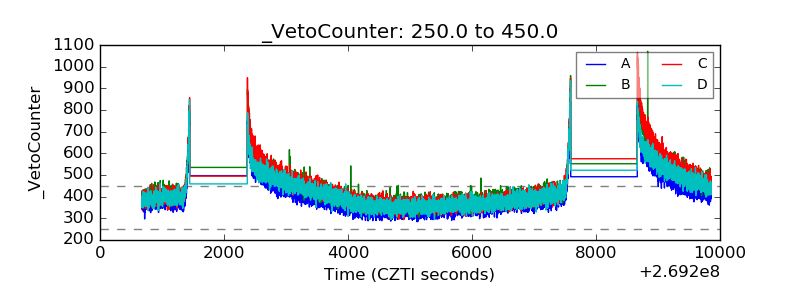 |