| Param | Original file | Final file |
|---|---|---|
| Filename | modeM0/AS1G08_028T01_9000002220_15095cztM0_level2.evt | modeM0/AS1G08_028T01_9000002220_15095cztM0_level2_quad_clean.evt |
| Size (bytes) | 437,166,720 | 94,654,080 |
| Size | 416.9 MB | 90.3 MB |
| Events in quadrant A | 3,100,708 | 611,592 |
| Events in quadrant B | 3,238,961 | 634,843 |
| Events in quadrant C | 3,516,748 | 607,309 |
| Events in quadrant D | 2,959,337 | 577,514 |
| Mode M0 | |||
|---|---|---|---|
| Quadrant | BADHDUFLAG | Total packets | Discarded packets |
| A | 0 | 13137 | 3 |
| B | 0 | 13514 | 2 |
| C | 0 | 14409 | 2 |
| D | 0 | 13027 | 2 |
| Mode SS | |||
|---|---|---|---|
| Quadrant | BADHDUFLAG | Total packets | Discarded packets |
| A | 0 | 126 | 0 |
| B | 0 | 126 | 0 |
| C | 0 | 126 | 0 |
| D | 0 | 126 | 0 |
| Mode M9 | |||
|---|---|---|---|
| Quadrant | BADHDUFLAG | Total packets | Discarded packets |
| A | 0 | 18 | 0 |
| B | 0 | 18 | 0 |
| C | 0 | 18 | 0 |
| D | 0 | 19 | 0 |
| Quadrant | Total seconds | Saturated seconds | Saturation percentage |
|---|---|---|---|
| A | 6232 | 40 | 0.641849% |
| B | 6232 | 60 | 0.962773% |
| C | 6232 | 38 | 0.609756% |
| D | 6232 | 22 | 0.353017% |
Noise dominated data is calculated using 1-second bins in cleaned event files. If a bin has >2000 counts, and if more than 50% of those come from <1% of pixels, then it is considered to be noise-dominated and hence unusable.
| Quadrant | # 1 sec bins | Bins with >0 counts | Bins with >2000 counts | High rate bins dominated by noise | Noise dominated (total time) | Noise dominated (detector-on time) | Marked lightcurve |
|---|---|---|---|---|---|---|---|
| A | 7493 | 6234 | 0 | 0 | 0.00% | 0.00% | 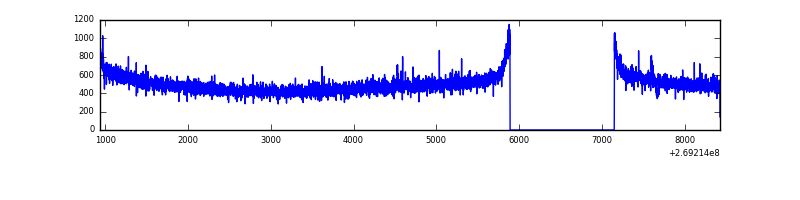 |
| B | 7493 | 6234 | 0 | 0 | 0.00% | 0.00% | 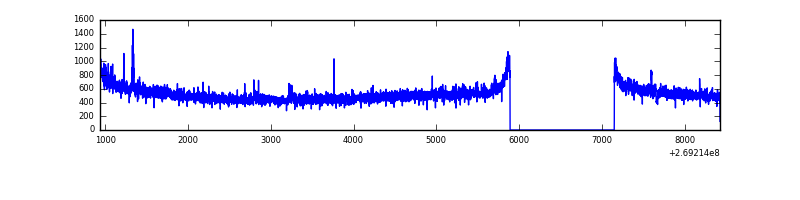 |
| C | 7493 | 6234 | 0 | 0 | 0.00% | 0.00% | 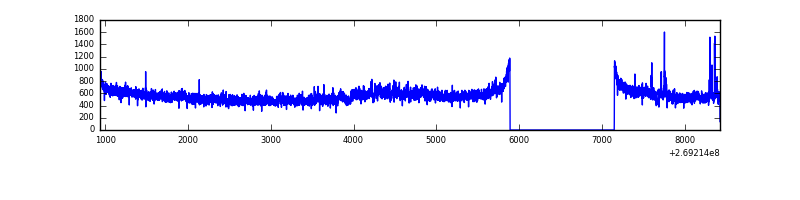 |
| D | 7493 | 6234 | 3 | 3 | 0.04% | 0.05% | 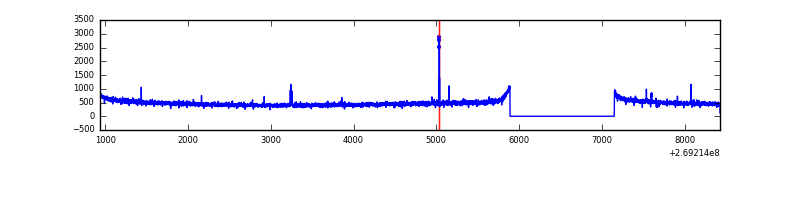 |
Top three noisy pixels from each quadrant. If the there are fewer than three noisy pixels in the level2.evt file, extra rows are filled as -1
| Pixel properties | Quadrant properties | ||||||
|---|---|---|---|---|---|---|---|
| Quadrant | DetID | PixID | Counts | Sigma | Mean | Median | Sigma |
| A | 12 | 189 | 8422 | 47.44 | 804 | 789 | 160.9 |
| A | 0 | 226 | 7135 | 39.44 | 804 | 789 | 160.9 |
| A | 12 | 194 | 5853 | 31.47 | 804 | 789 | 160.9 |
| B | 3 | 64 | 73097 | 477.59 | 808 | 790 | 151.4 |
| B | 12 | 111 | 18046 | 113.98 | 808 | 790 | 151.4 |
| B | 11 | 111 | 15779 | 99.0 | 808 | 790 | 151.4 |
| C | 3 | 233 | 389254 | 2131.14 | 786 | 795 | 182.3 |
| C | 3 | 9 | 32160 | 172.07 | 786 | 795 | 182.3 |
| C | 0 | 207 | 27509 | 146.56 | 786 | 795 | 182.3 |
| D | 2 | 234 | 19601 | 99.45 | 779 | 758 | 189.5 |
| D | 13 | 104 | 18753 | 94.98 | 779 | 758 | 189.5 |
| D | 10 | 70 | 9757 | 47.5 | 779 | 758 | 189.5 |
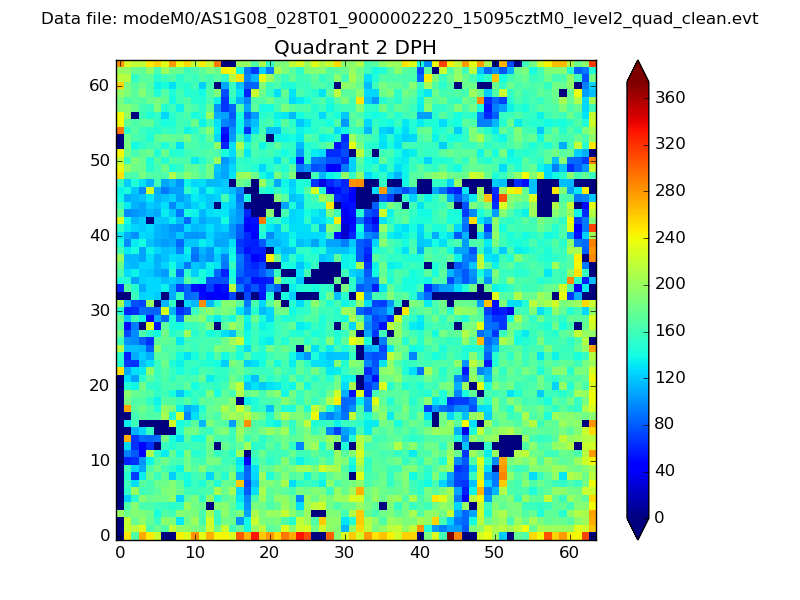
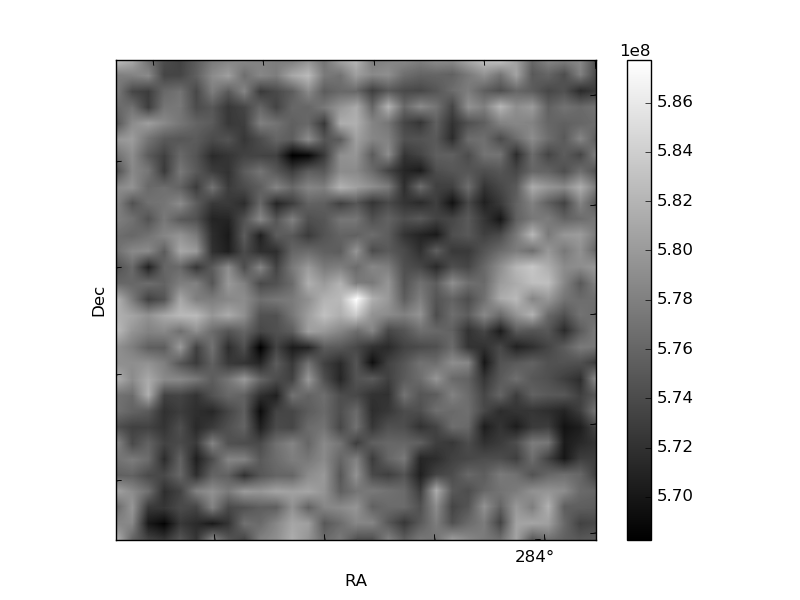
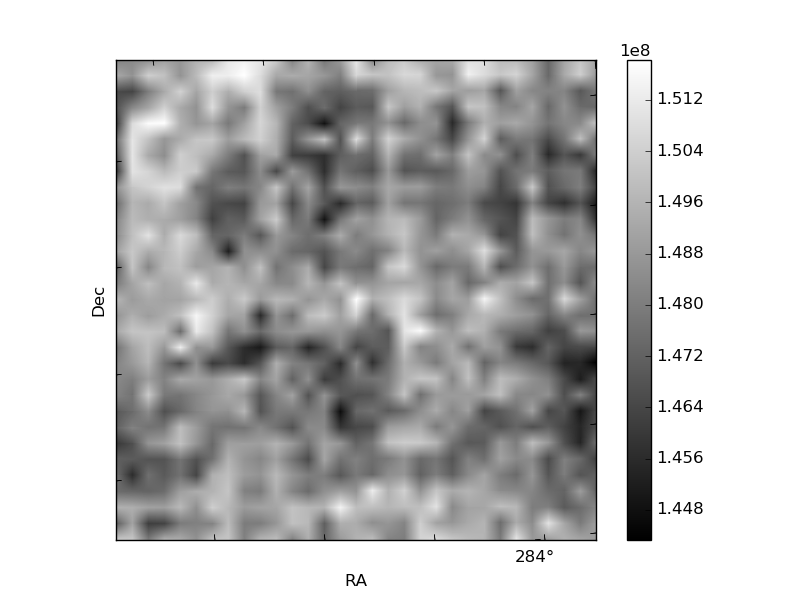
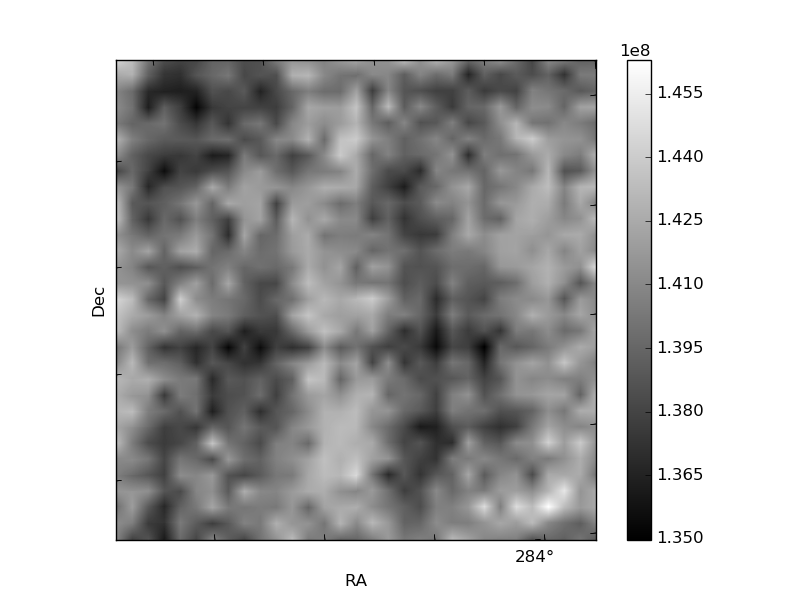
Histogram calculated using DETX and DETY for each event in the final _common_clean file
| Quadrant A | 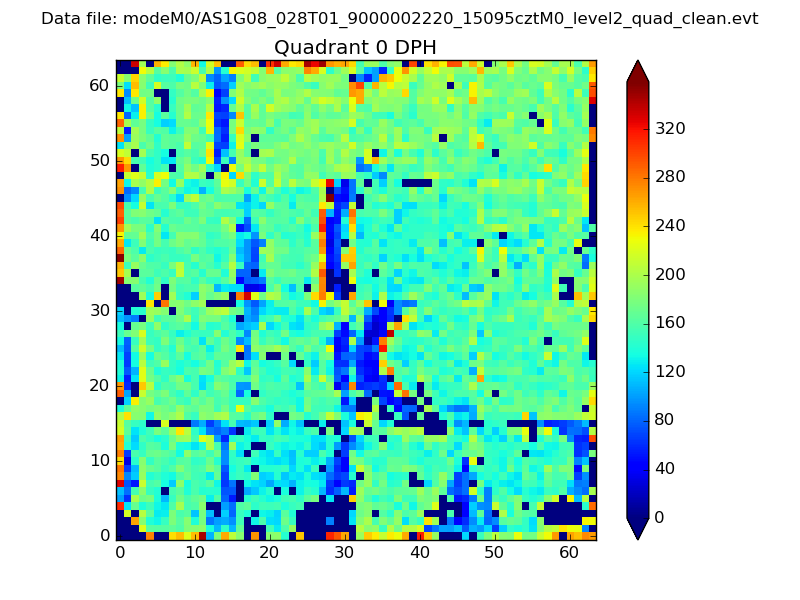 |
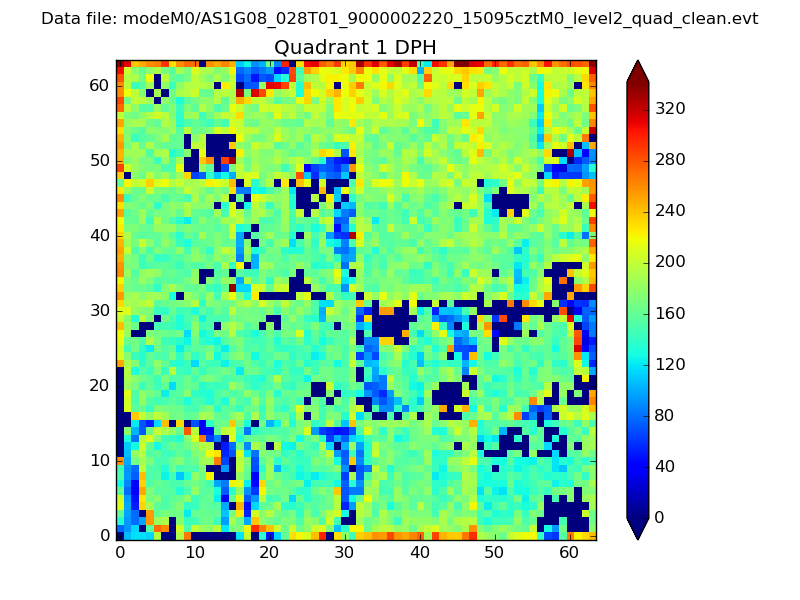 |
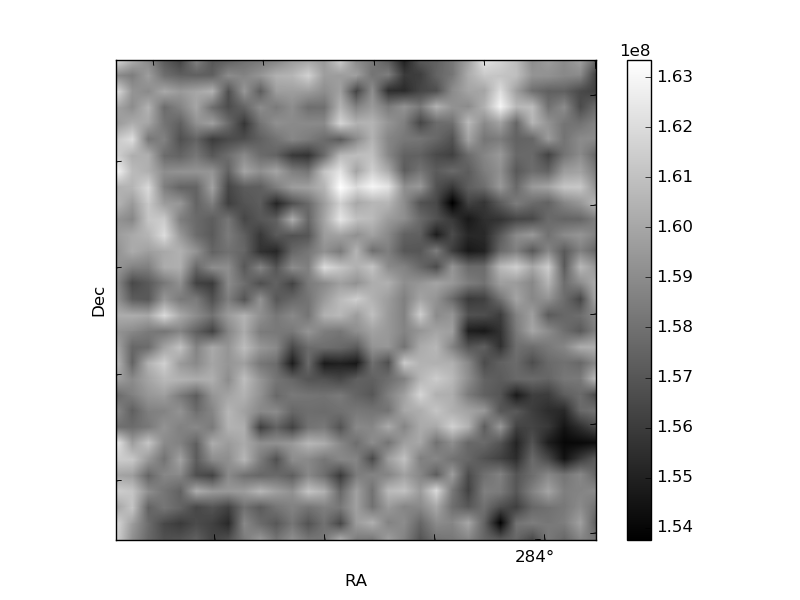
Quadrant B |
|---|---|---|---|
| Quadrant D | 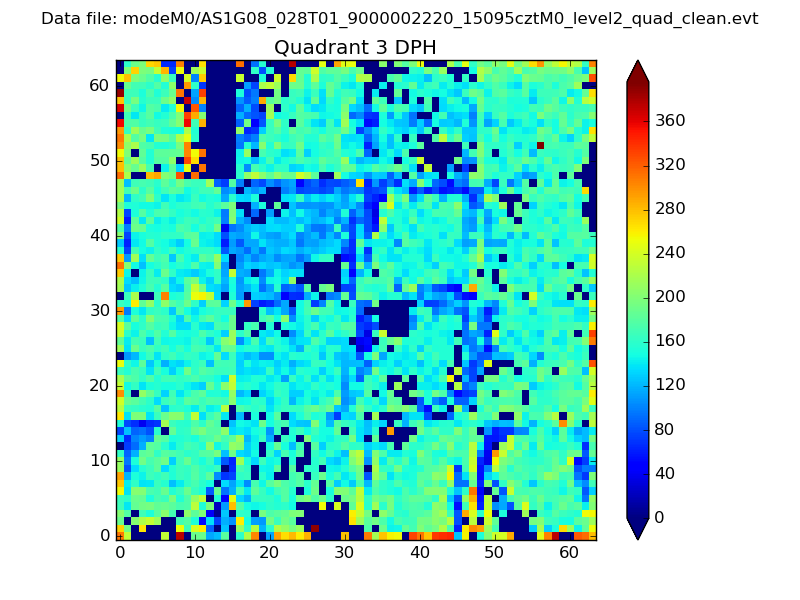 |
 |
Quadrant C |
| Plot type | Count rate plots | Images |
|---|---|---|
| Comparison with Poisson distribution Blue bars denote a histogram of data divided into 1 sec bins. Red curve is a Poisson curve with rate = median count rate of data. |
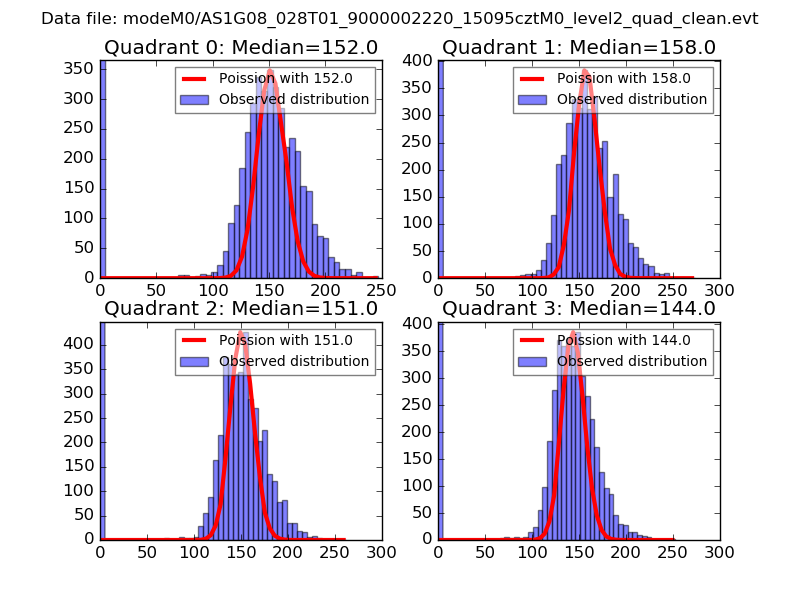 |
 |
| Quadrant-wise count rates Data is divided into 100 sec bins |
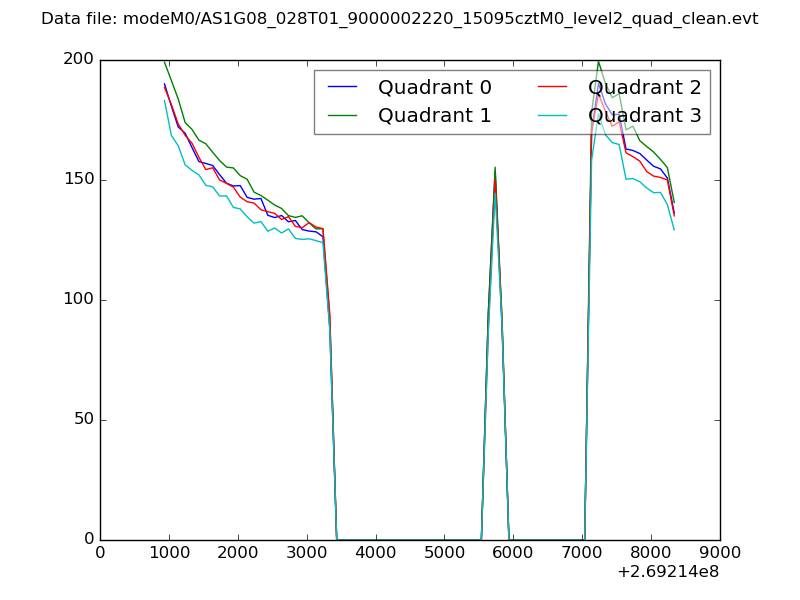 |
|
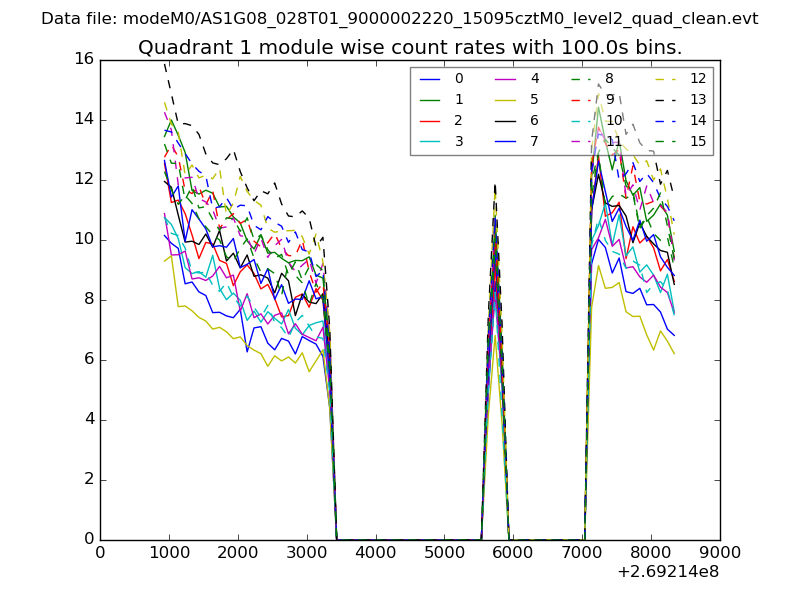
| Module-wise count rates for Quadrant A Data is divided into 100 sec bins |
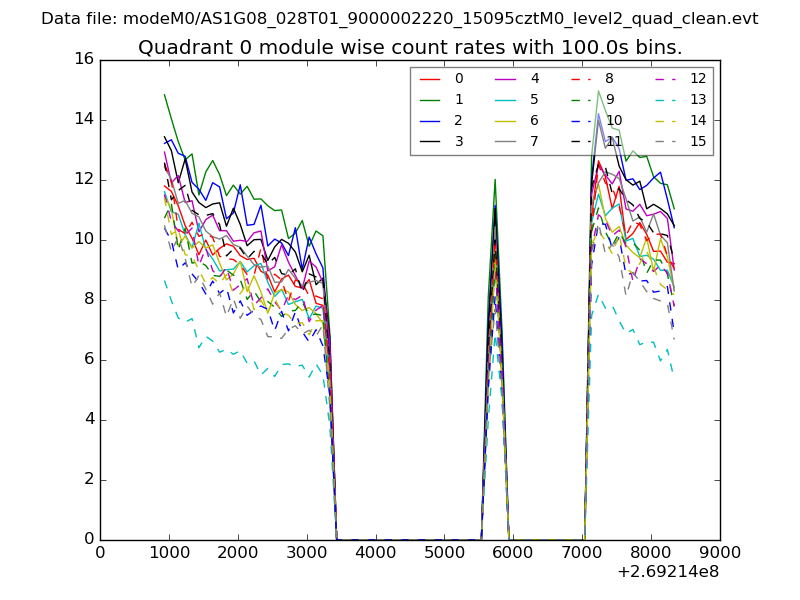 |
 |
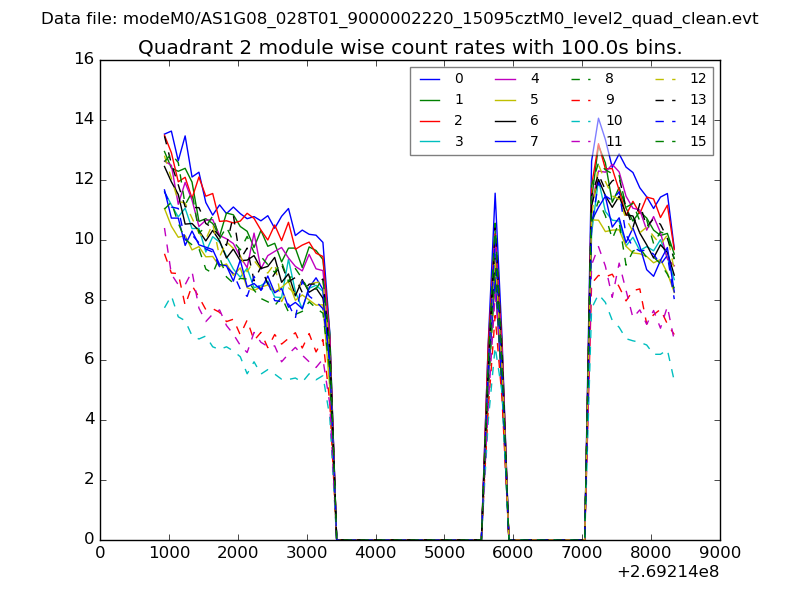
| Module-wise count rates for Quadrant B Data is divided into 100 sec bins |
 |
 |
| Module-wise count rates for Quadrant C Data is divided into 100 sec bins |
 |
 |
| Module-wise count rates for Quadrant D Data is divided into 100 sec bins |
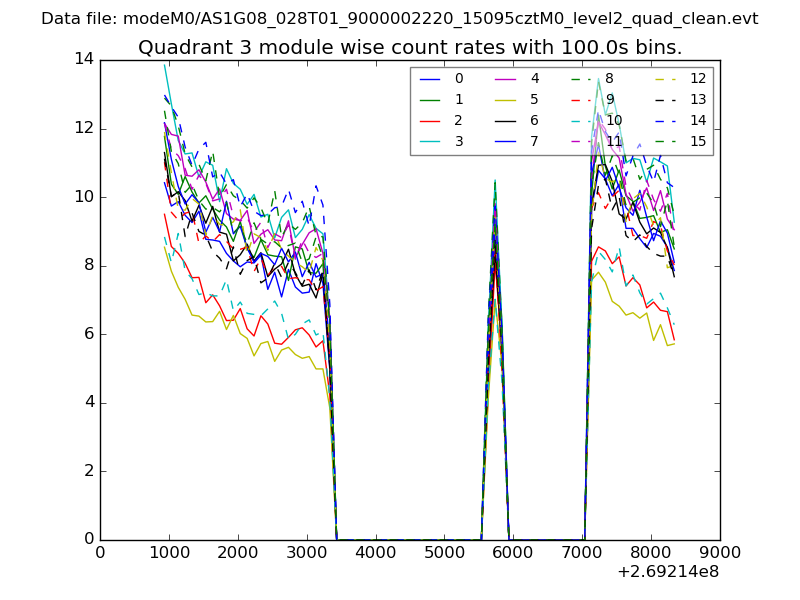 |
 |
| Parameter | Plot |
|---|---|
| CZT HV Monitor | 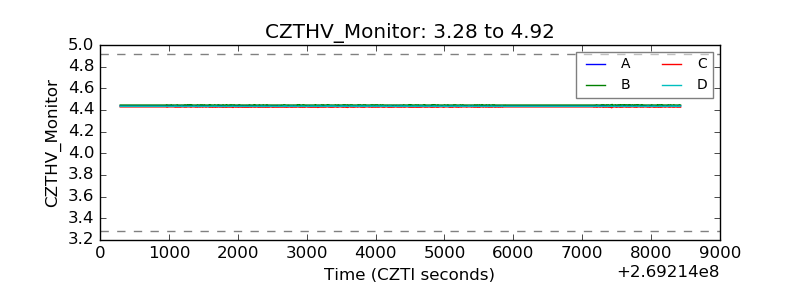 |
| D_VDD | 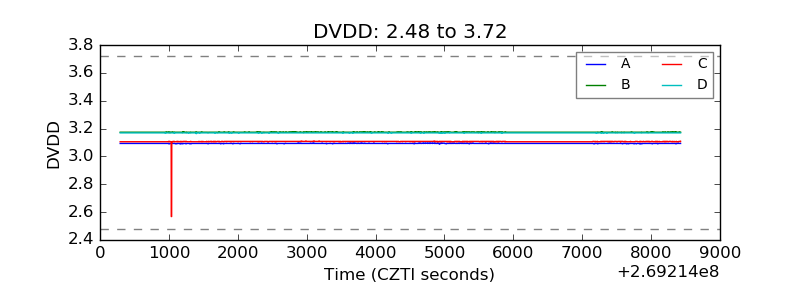 |
| Temperature 1 | 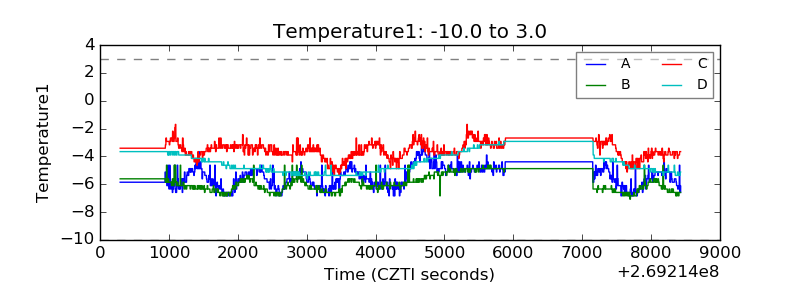 |
| Veto HV Monitor | 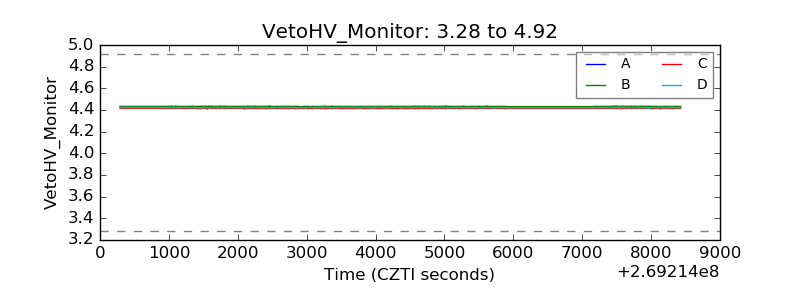 |
| Veto LLD | 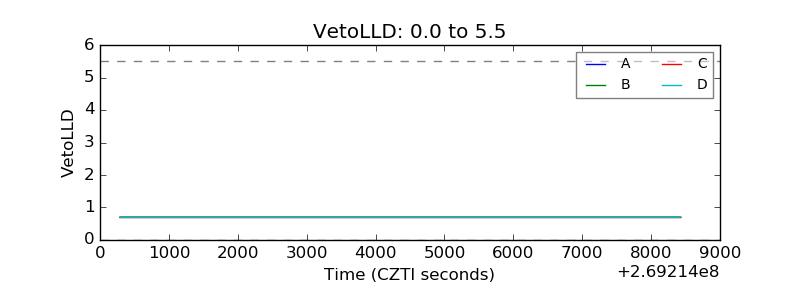 |
| Alpha Counter | 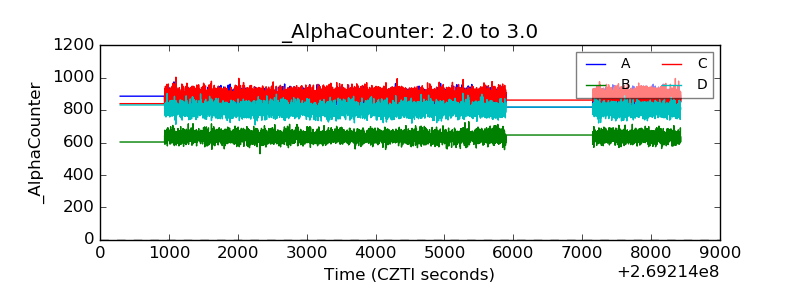 |
| _CPM_Rate | 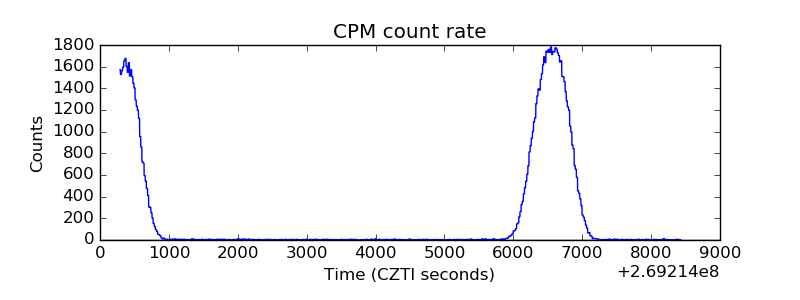 |
| CZT Counter | 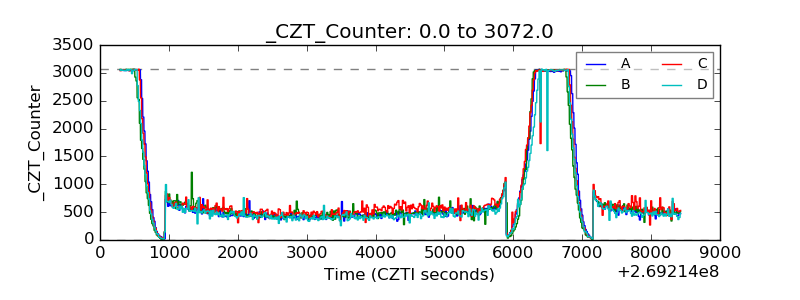 |
| +2.5 Volts monitor |  |
| +5 Volts monitor |  |
| _ROLL_ROT | 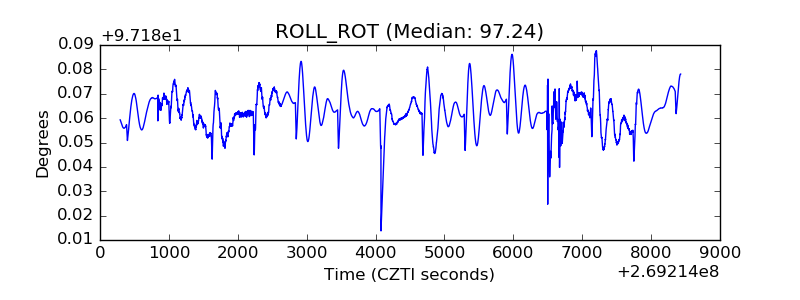 |
| _Roll_DEC | 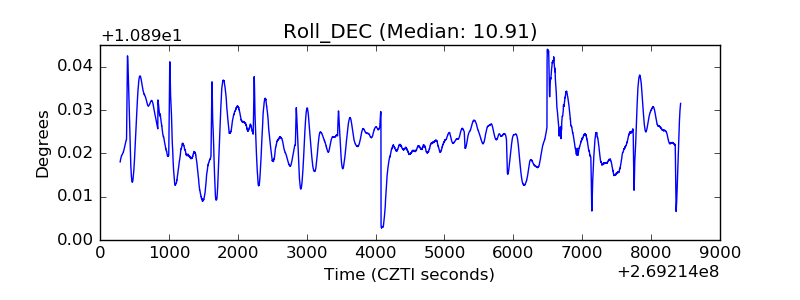 |
| _Roll_RA | 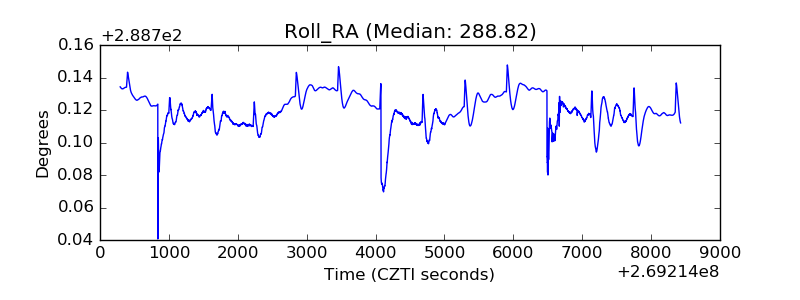 |
| Veto Counter | 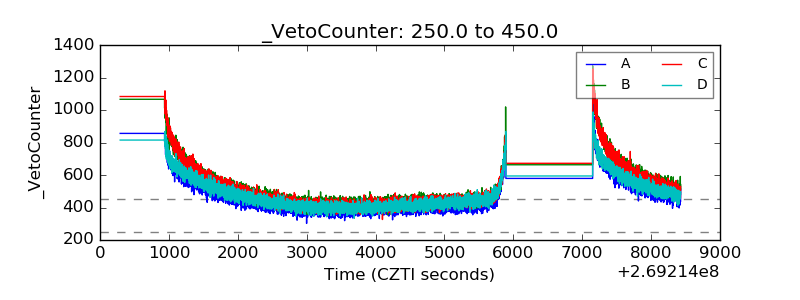 |