| Param | Original file | Final file |
|---|---|---|
| Filename | modeM0/AS1G08_028T01_9000002220_15096cztM0_level2.evt | modeM0/AS1G08_028T01_9000002220_15096cztM0_level2_quad_clean.evt |
| Size (bytes) | 462,623,040 | 94,763,520 |
| Size | 441.2 MB | 90.4 MB |
| Events in quadrant A | 3,139,907 | 618,986 |
| Events in quadrant B | 3,763,778 | 635,988 |
| Events in quadrant C | 3,557,866 | 607,391 |
| Events in quadrant D | 3,128,559 | 575,303 |
| Mode M0 | |||
|---|---|---|---|
| Quadrant | BADHDUFLAG | Total packets | Discarded packets |
| A | 0 | 13050 | 3 |
| B | 0 | 15167 | 2 |
| C | 0 | 14366 | 2 |
| D | 0 | 13403 | 2 |
| Mode SS | |||
|---|---|---|---|
| Quadrant | BADHDUFLAG | Total packets | Discarded packets |
| A | 0 | 126 | 0 |
| B | 0 | 126 | 0 |
| C | 0 | 126 | 0 |
| D | 0 | 126 | 0 |
| Mode M9 | |||
|---|---|---|---|
| Quadrant | BADHDUFLAG | Total packets | Discarded packets |
| A | 0 | 25 | 0 |
| B | 0 | 25 | 0 |
| C | 0 | 25 | 0 |
| D | 0 | 26 | 0 |
| Quadrant | Total seconds | Saturated seconds | Saturation percentage |
|---|---|---|---|
| A | 6191 | 30 | 0.484574% |
| B | 6191 | 148 | 2.390567% |
| C | 6191 | 21 | 0.339202% |
| D | 6191 | 58 | 0.936844% |
Noise dominated data is calculated using 1-second bins in cleaned event files. If a bin has >2000 counts, and if more than 50% of those come from <1% of pixels, then it is considered to be noise-dominated and hence unusable.
| Quadrant | # 1 sec bins | Bins with >0 counts | Bins with >2000 counts | High rate bins dominated by noise | Noise dominated (total time) | Noise dominated (detector-on time) | Marked lightcurve |
|---|---|---|---|---|---|---|---|
| A | 7562 | 6193 | 0 | 0 | 0.00% | 0.00% | 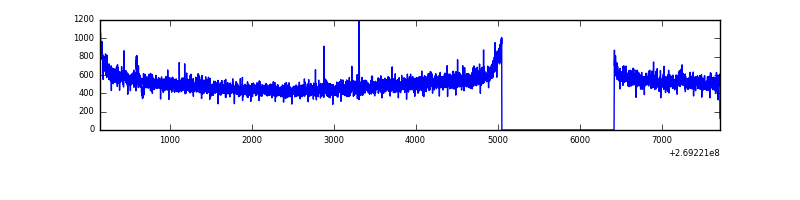 |
| B | 7562 | 6192 | 14 | 14 | 0.19% | 0.23% | 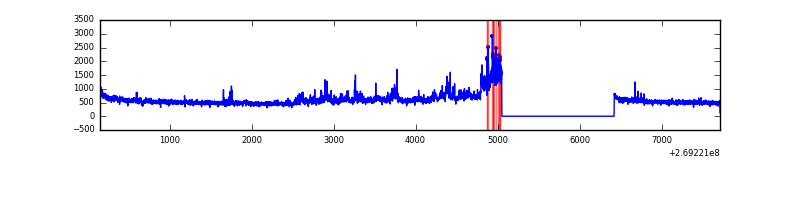 |
| C | 7562 | 6193 | 2 | 2 | 0.03% | 0.03% | 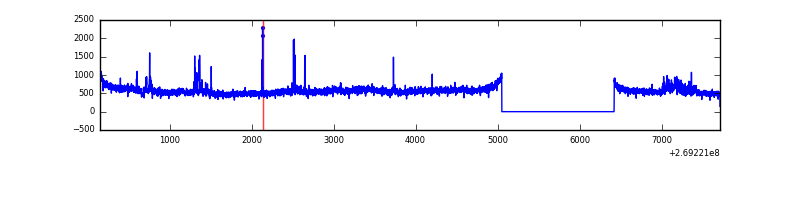 |
| D | 7562 | 6193 | 43 | 43 | 0.57% | 0.69% | 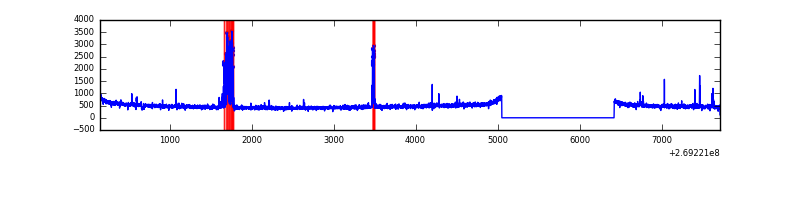 |
Top three noisy pixels from each quadrant. If the there are fewer than three noisy pixels in the level2.evt file, extra rows are filled as -1
| Pixel properties | Quadrant properties | ||||||
|---|---|---|---|---|---|---|---|
| Quadrant | DetID | PixID | Counts | Sigma | Mean | Median | Sigma |
| A | 12 | 189 | 40246 | 243.32 | 807 | 793 | 162.1 |
| A | 0 | 226 | 7217 | 39.62 | 807 | 793 | 162.1 |
| A | 12 | 194 | 5569 | 29.46 | 807 | 793 | 162.1 |
| B | 3 | 64 | 573395 | 3799.73 | 806 | 788 | 150.7 |
| B | 10 | 245 | 36478 | 236.83 | 806 | 788 | 150.7 |
| B | 12 | 111 | 17758 | 112.61 | 806 | 788 | 150.7 |
| C | 3 | 233 | 398615 | 2214.05 | 780 | 788 | 179.7 |
| C | 3 | 9 | 61962 | 340.46 | 780 | 788 | 179.7 |
| C | 0 | 207 | 53401 | 292.81 | 780 | 788 | 179.7 |
| D | 10 | 70 | 178731 | 958.67 | 772 | 750 | 185.7 |
| D | 13 | 104 | 37035 | 195.44 | 772 | 750 | 185.7 |
| D | 2 | 234 | 18818 | 97.32 | 772 | 750 | 185.7 |
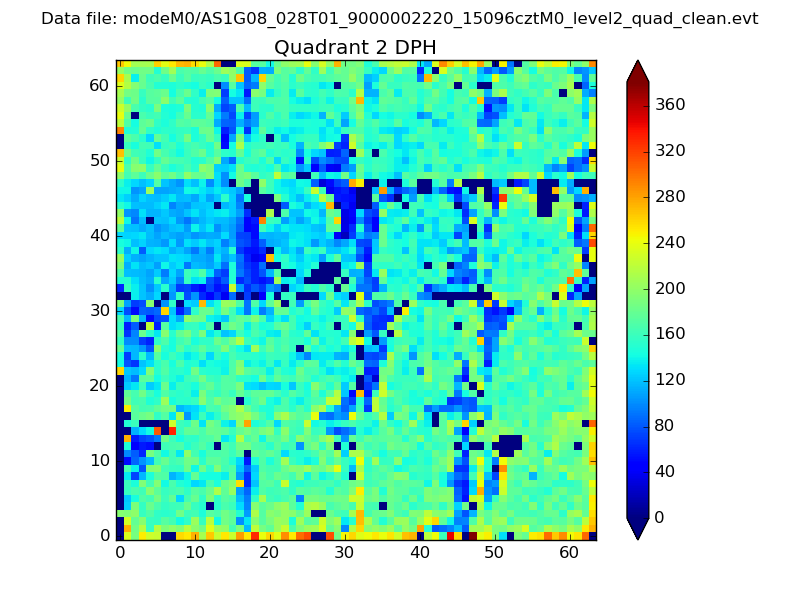
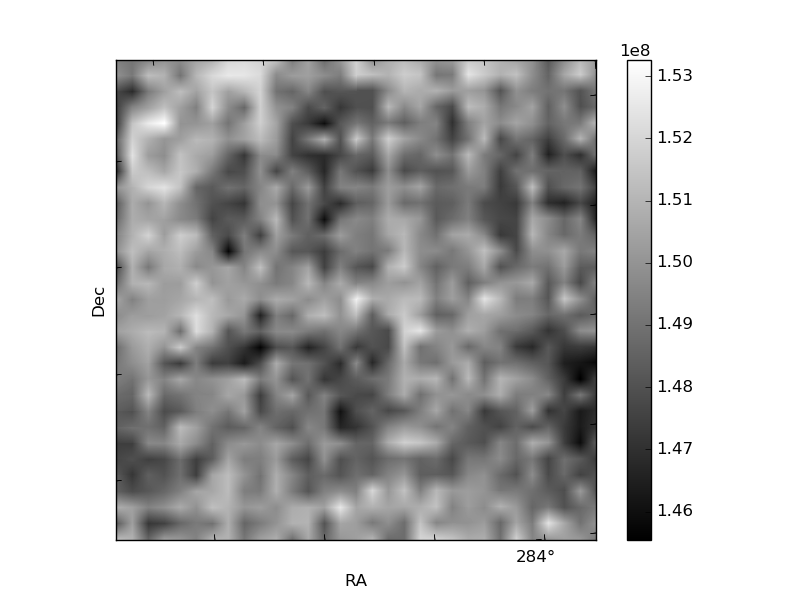
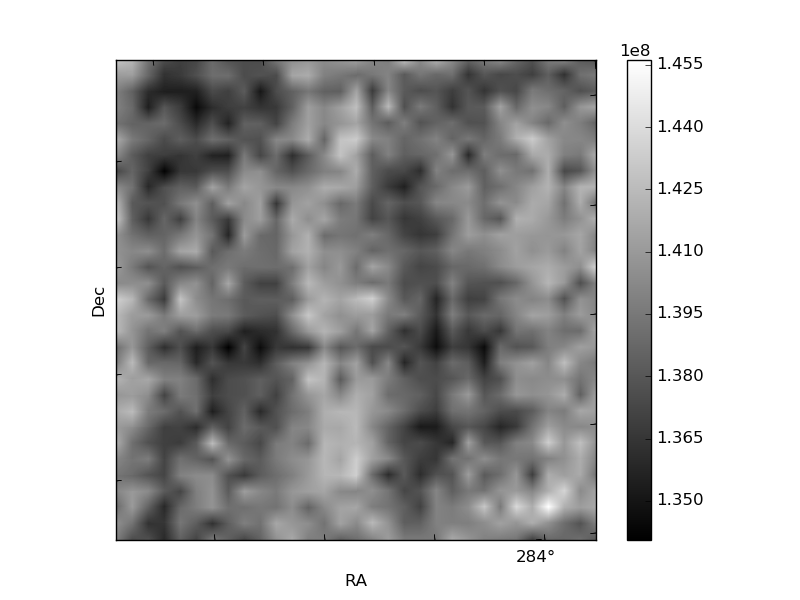
Histogram calculated using DETX and DETY for each event in the final _common_clean file
| Quadrant A | 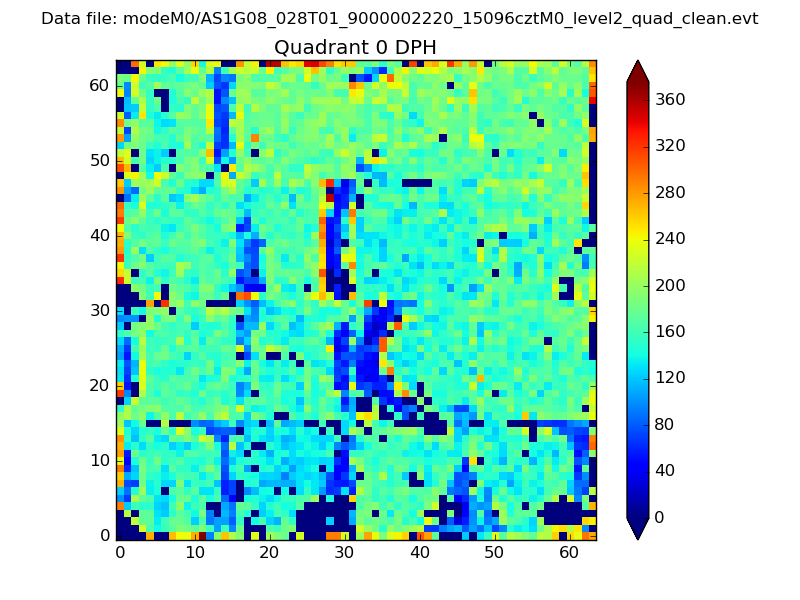 |
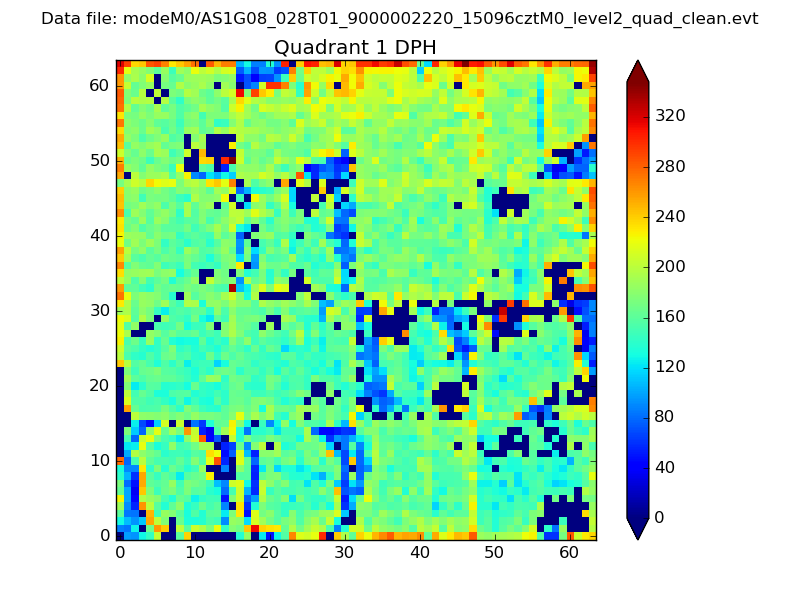 |
Quadrant B |
|---|---|---|---|
| Quadrant D | 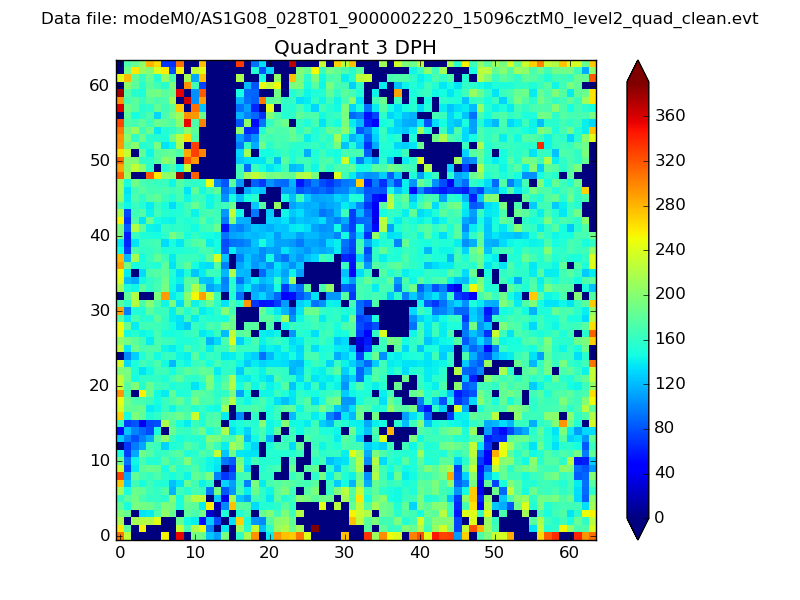 |
 |
Quadrant C |
| Plot type | Count rate plots | Images |
|---|---|---|
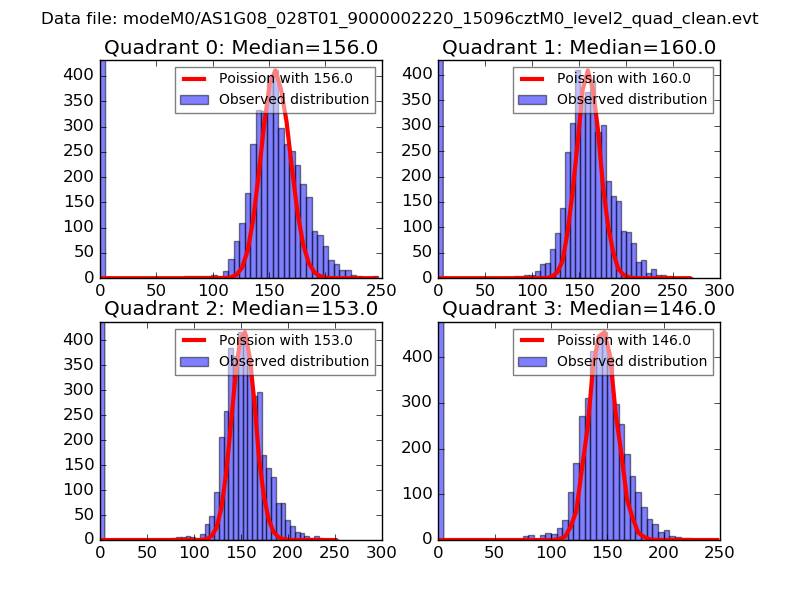
| Comparison with Poisson distribution Blue bars denote a histogram of data divided into 1 sec bins. Red curve is a Poisson curve with rate = median count rate of data. |
 |
 |
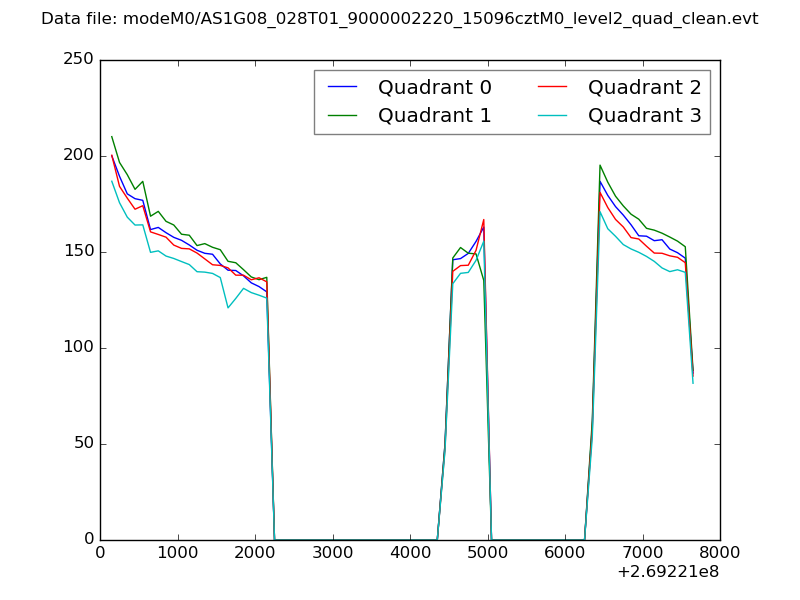
| Quadrant-wise count rates Data is divided into 100 sec bins |
 |
|
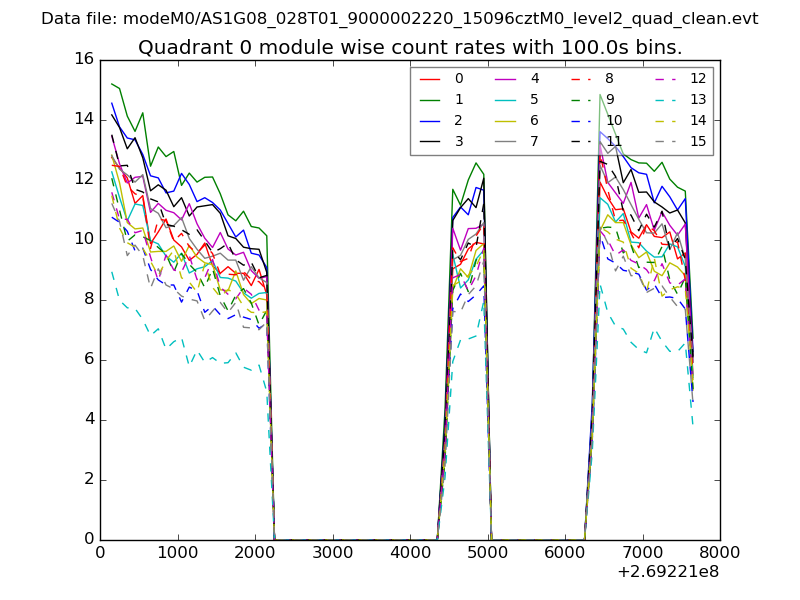
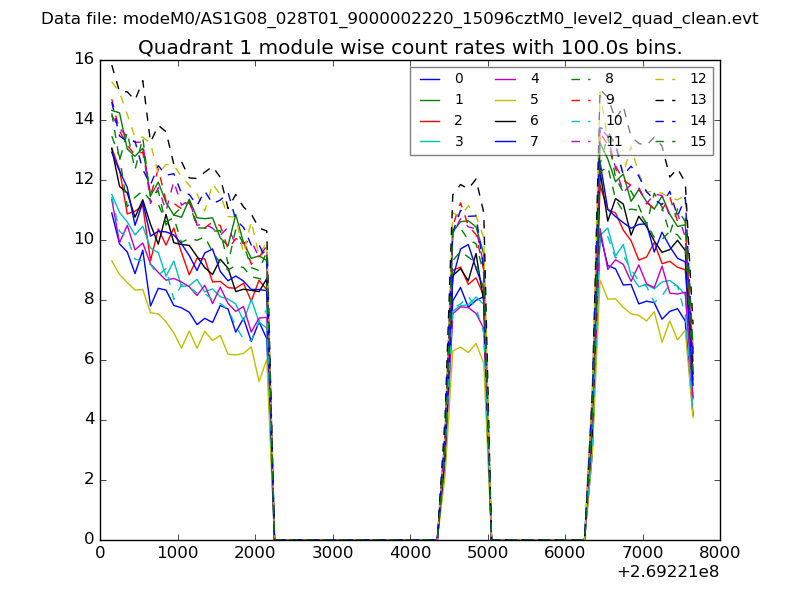
| Module-wise count rates for Quadrant A Data is divided into 100 sec bins |
 |
 |
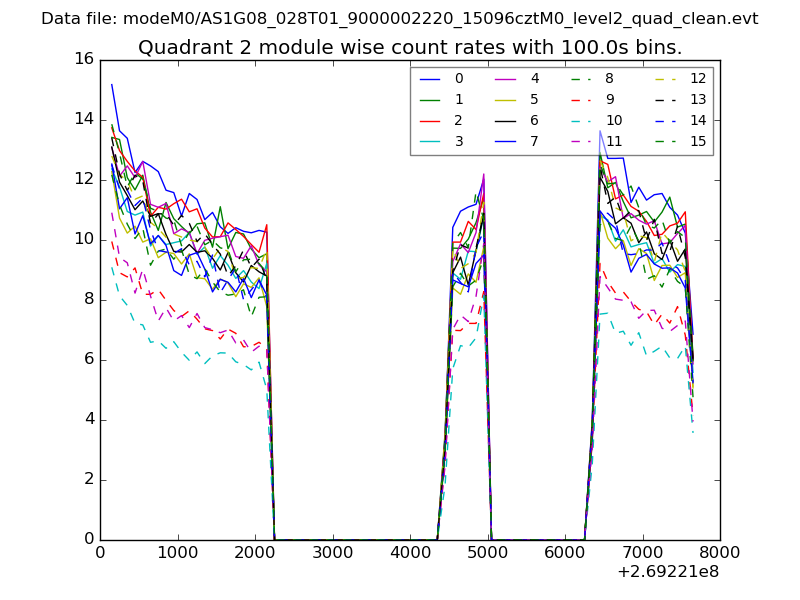
| Module-wise count rates for Quadrant B Data is divided into 100 sec bins |
 |
 |
| Module-wise count rates for Quadrant C Data is divided into 100 sec bins |
 |
 |
| Module-wise count rates for Quadrant D Data is divided into 100 sec bins |
 |
 |
| Parameter | Plot |
|---|---|
| CZT HV Monitor | 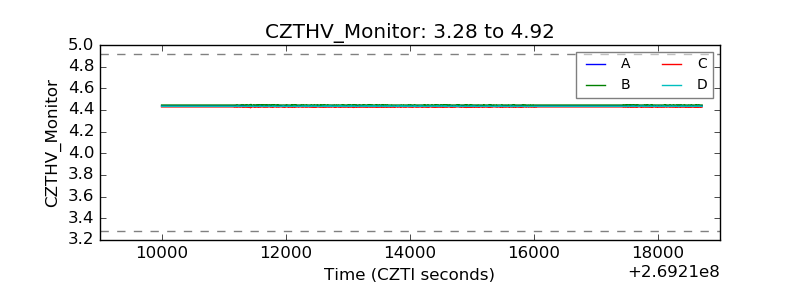 |
| D_VDD | 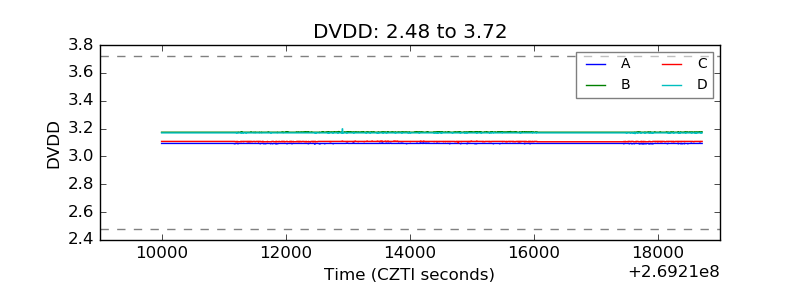 |
| Temperature 1 | 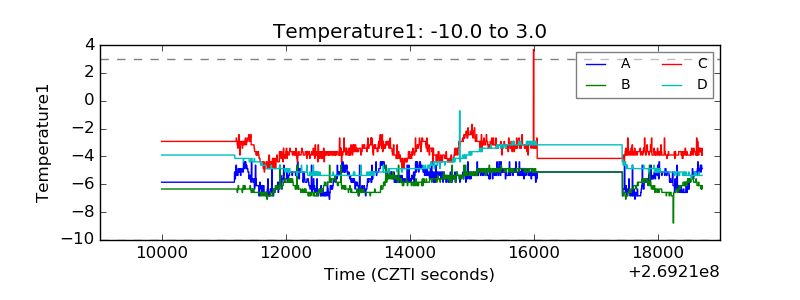 |
| Veto HV Monitor | 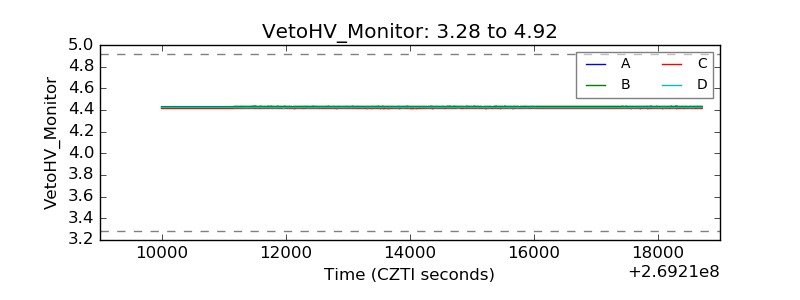 |
| Veto LLD | 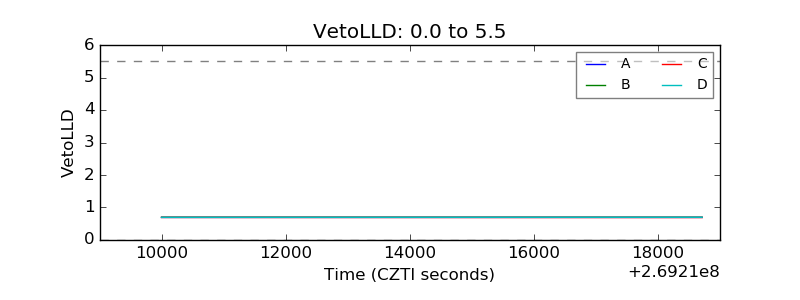 |
| Alpha Counter | 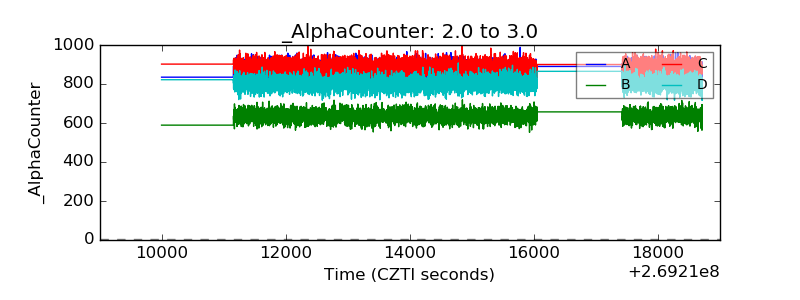 |
| _CPM_Rate | 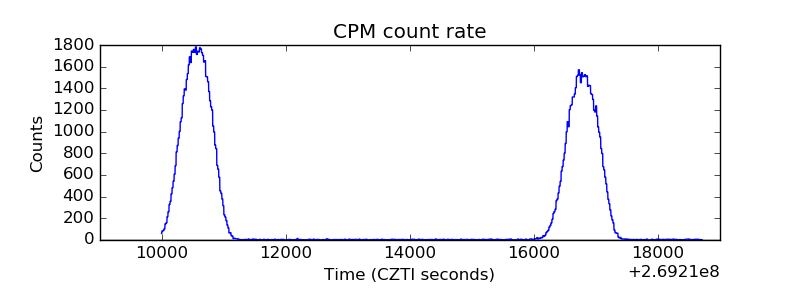 |
| CZT Counter | 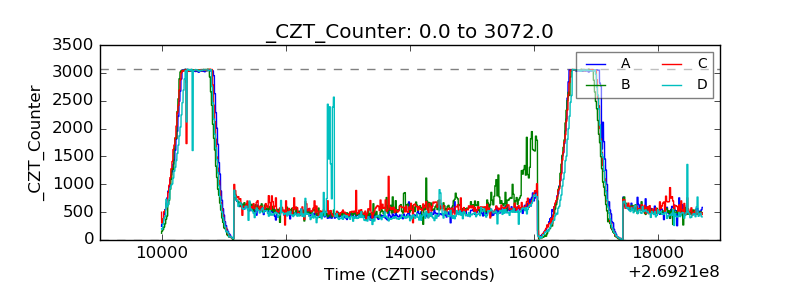 |
| +2.5 Volts monitor |  |
| +5 Volts monitor |  |
| _ROLL_ROT |  |
| _Roll_DEC | 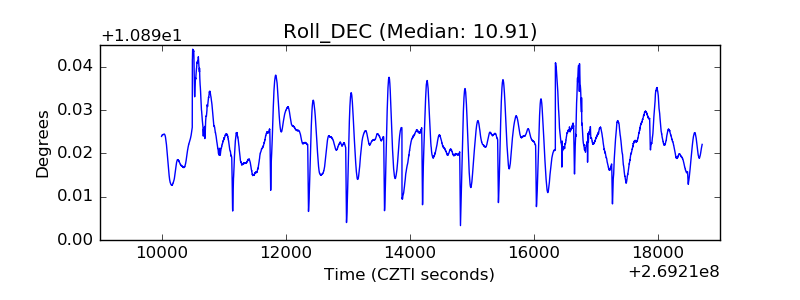 |
| _Roll_RA | 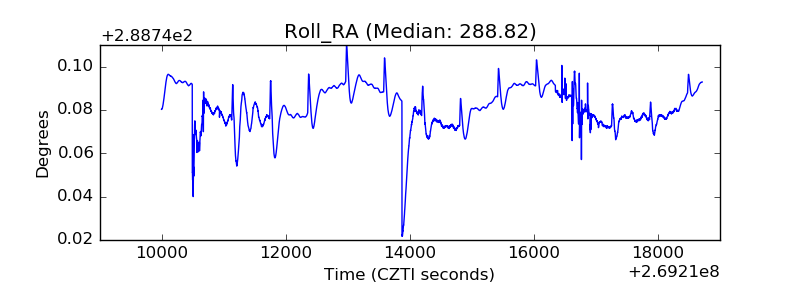 |
| Veto Counter | 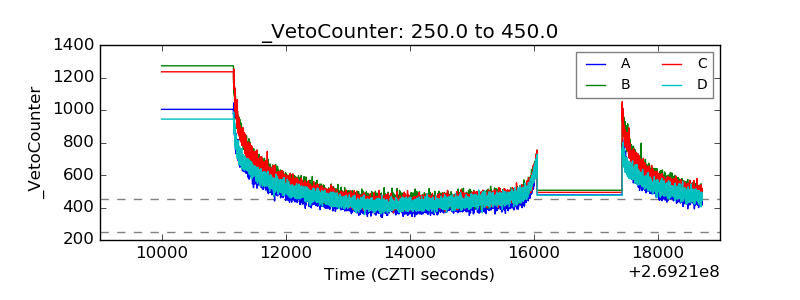 |