| Param | Original file | Final file |
|---|---|---|
| Filename | modeM0/AS1G08_028T01_9000002220_15097cztM0_level2.evt | modeM0/AS1G08_028T01_9000002220_15097cztM0_level2_quad_clean.evt |
| Size (bytes) | 436,884,480 | 91,624,320 |
| Size | 416.6 MB | 87.4 MB |
| Events in quadrant A | 3,134,574 | 595,153 |
| Events in quadrant B | 3,320,154 | 612,100 |
| Events in quadrant C | 3,396,201 | 580,298 |
| Events in quadrant D | 2,958,399 | 553,909 |
| Mode M0 | |||
|---|---|---|---|
| Quadrant | BADHDUFLAG | Total packets | Discarded packets |
| A | 0 | 12991 | 3 |
| B | 0 | 13576 | 2 |
| C | 0 | 13920 | 2 |
| D | 0 | 12964 | 2 |
| Mode SS | |||
|---|---|---|---|
| Quadrant | BADHDUFLAG | Total packets | Discarded packets |
| A | 0 | 126 | 0 |
| B | 0 | 126 | 0 |
| C | 0 | 126 | 0 |
| D | 0 | 126 | 0 |
| Mode M9 | |||
|---|---|---|---|
| Quadrant | BADHDUFLAG | Total packets | Discarded packets |
| A | 0 | 21 | 0 |
| B | 0 | 21 | 0 |
| C | 0 | 21 | 0 |
| D | 0 | 22 | 0 |
| Quadrant | Total seconds | Saturated seconds | Saturation percentage |
|---|---|---|---|
| A | 6200 | 23 | 0.370968% |
| B | 6200 | 41 | 0.661290% |
| C | 6200 | 18 | 0.290323% |
| D | 6200 | 16 | 0.258065% |
Noise dominated data is calculated using 1-second bins in cleaned event files. If a bin has >2000 counts, and if more than 50% of those come from <1% of pixels, then it is considered to be noise-dominated and hence unusable.
| Quadrant | # 1 sec bins | Bins with >0 counts | Bins with >2000 counts | High rate bins dominated by noise | Noise dominated (total time) | Noise dominated (detector-on time) | Marked lightcurve |
|---|---|---|---|---|---|---|---|
| A | 7576 | 6202 | 0 | 0 | 0.00% | 0.00% | 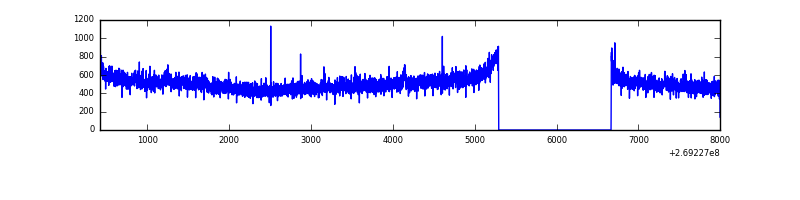 |
| B | 7576 | 6202 | 1 | 1 | 0.01% | 0.02% | 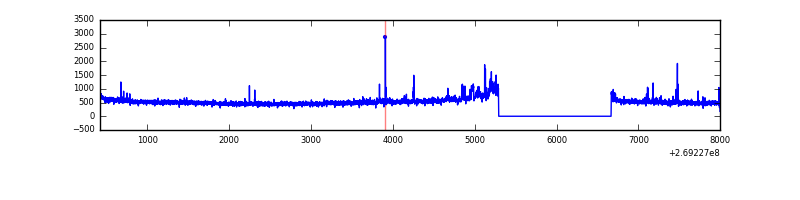 |
| C | 7576 | 6202 | 0 | 0 | 0.00% | 0.00% | 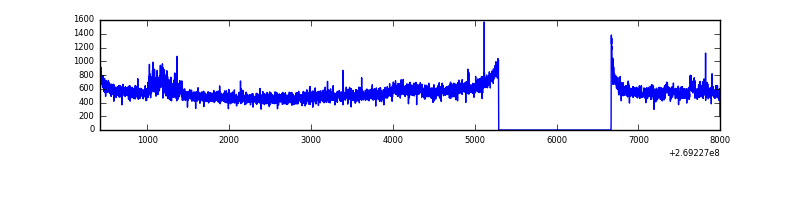 |
| D | 7576 | 6202 | 6 | 6 | 0.08% | 0.10% | 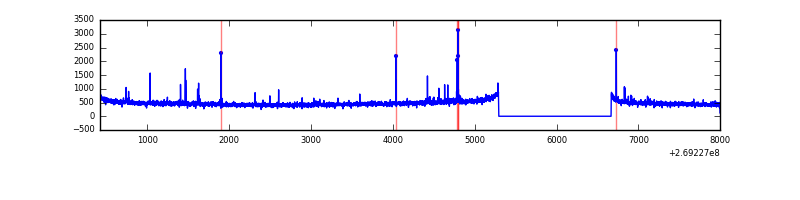 |
Top three noisy pixels from each quadrant. If the there are fewer than three noisy pixels in the level2.evt file, extra rows are filled as -1
| Pixel properties | Quadrant properties | ||||||
|---|---|---|---|---|---|---|---|
| Quadrant | DetID | PixID | Counts | Sigma | Mean | Median | Sigma |
| A | 12 | 189 | 62227 | 384.14 | 800 | 788 | 159.9 |
| A | 0 | 226 | 7136 | 39.69 | 800 | 788 | 159.9 |
| A | 12 | 194 | 5764 | 31.11 | 800 | 788 | 159.9 |
| B | 3 | 64 | 153252 | 1007.97 | 800 | 784 | 151.3 |
| B | 10 | 245 | 39556 | 256.32 | 800 | 784 | 151.3 |
| B | 12 | 111 | 17936 | 113.39 | 800 | 784 | 151.3 |
| C | 3 | 233 | 329588 | 1861.6 | 768 | 775 | 176.6 |
| C | 3 | 9 | 68039 | 380.82 | 768 | 775 | 176.6 |
| C | 13 | 61 | 5489 | 26.69 | 768 | 775 | 176.6 |
| D | 13 | 104 | 61850 | 332.23 | 763 | 744 | 183.9 |
| D | 2 | 234 | 19508 | 102.02 | 763 | 744 | 183.9 |
| D | 9 | 1 | 8257 | 40.85 | 763 | 744 | 183.9 |
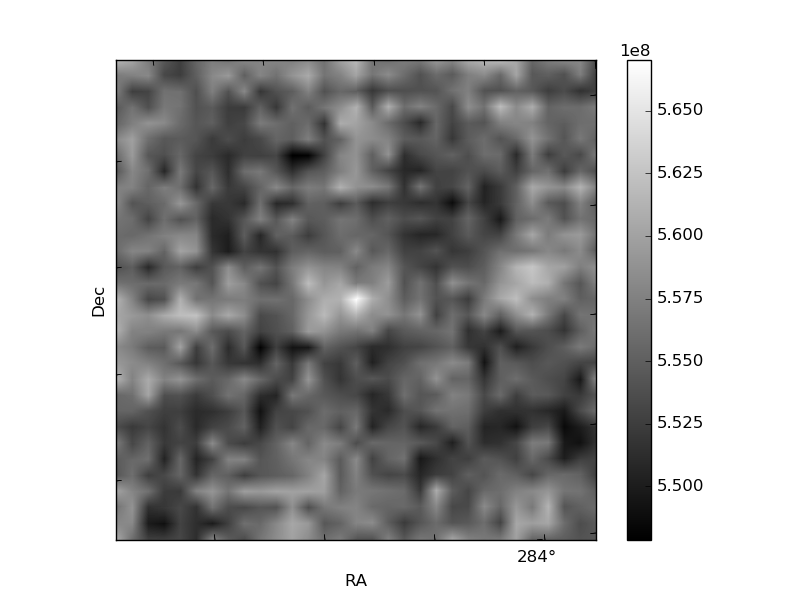
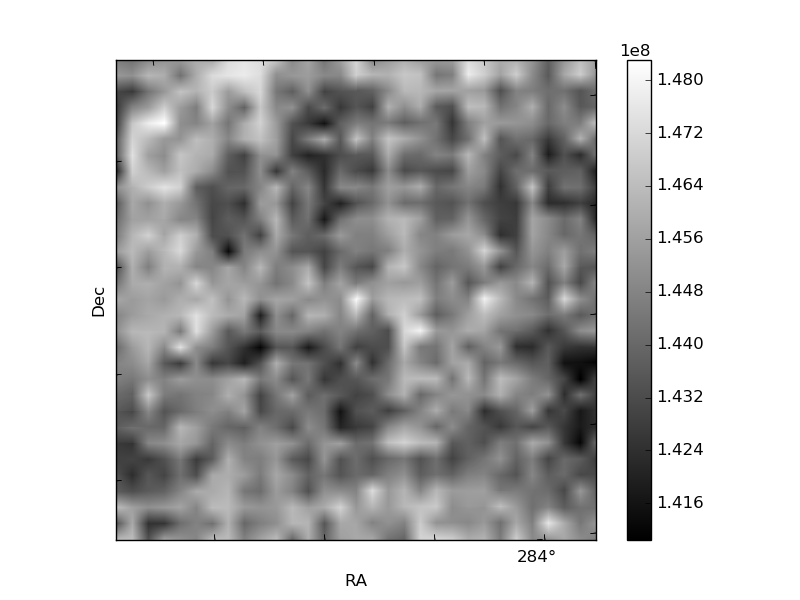
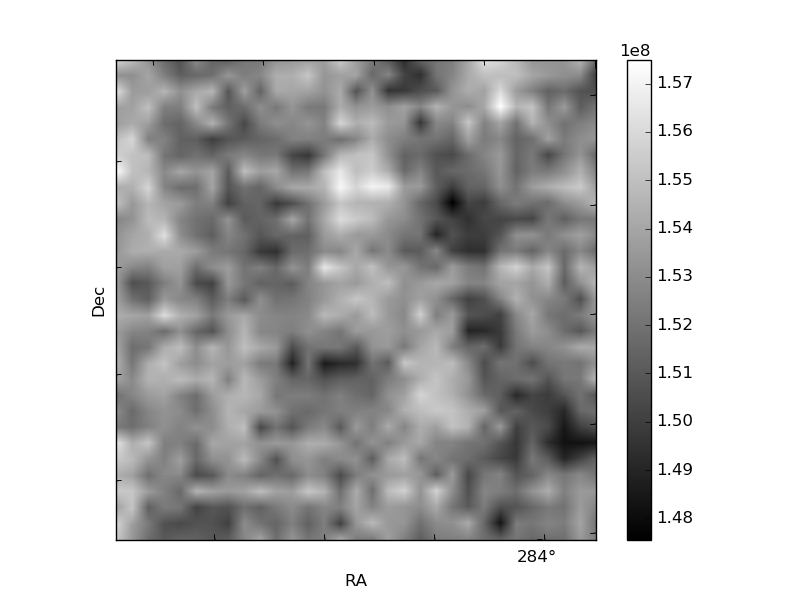
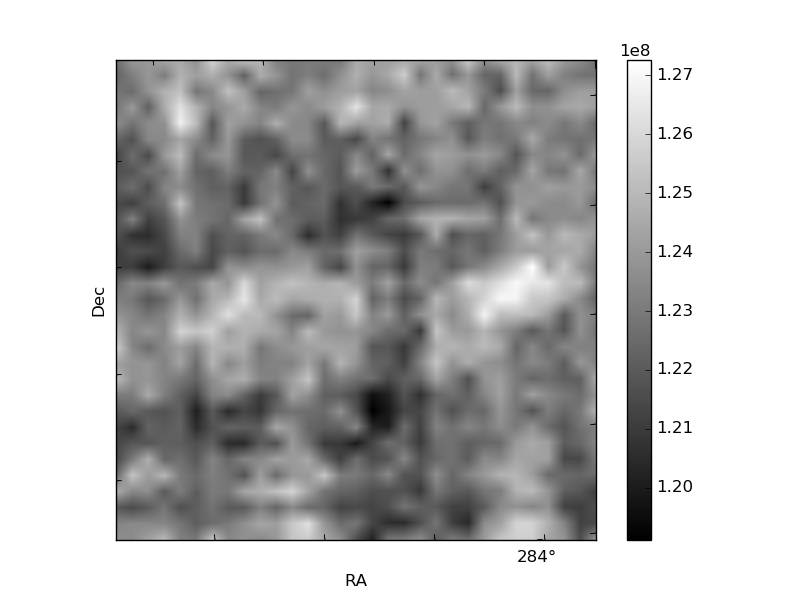
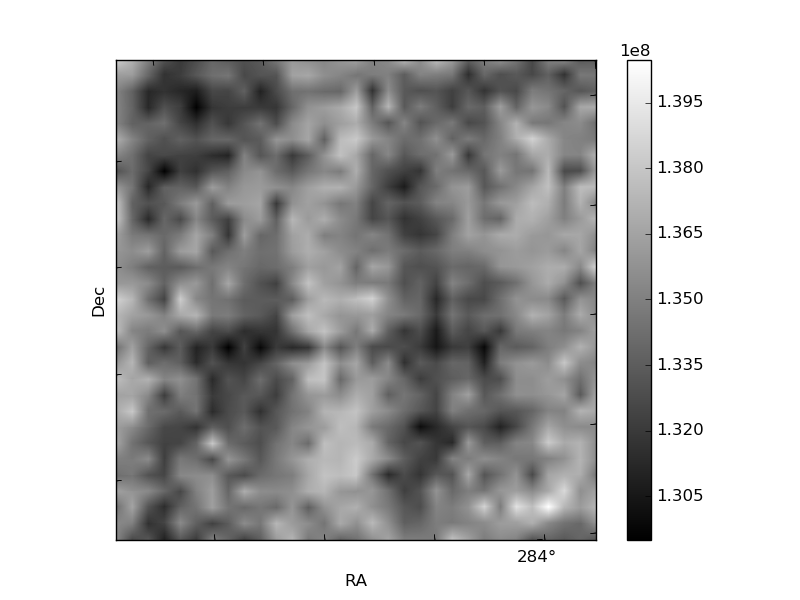
Histogram calculated using DETX and DETY for each event in the final _common_clean file
| Quadrant A | 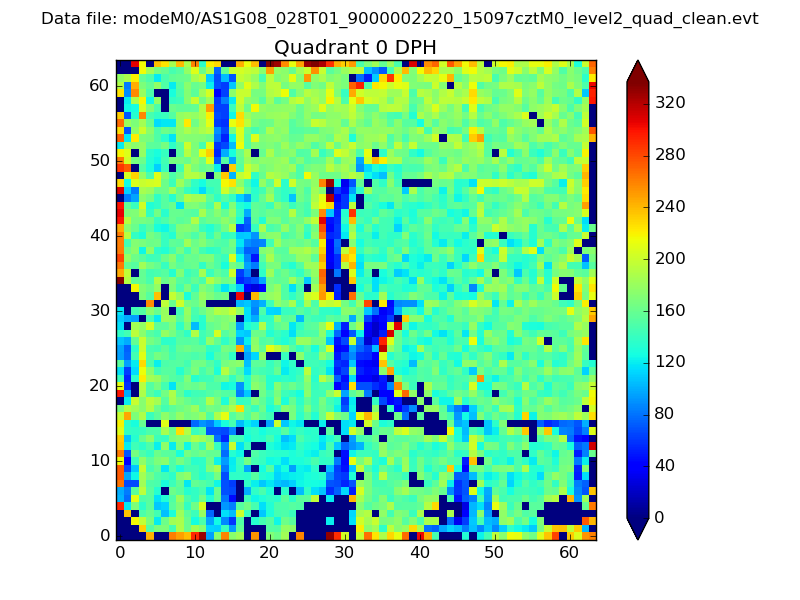 |
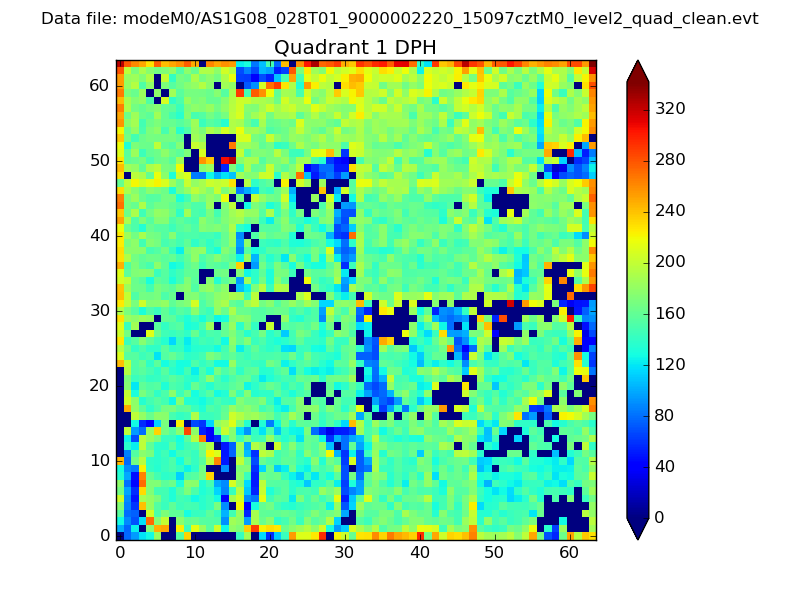 |
Quadrant B |
|---|---|---|---|
| Quadrant D | 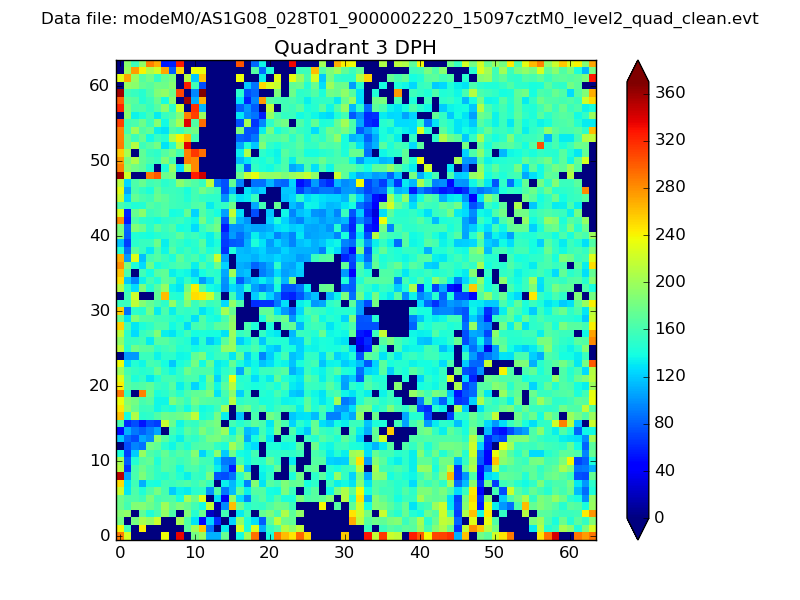 |
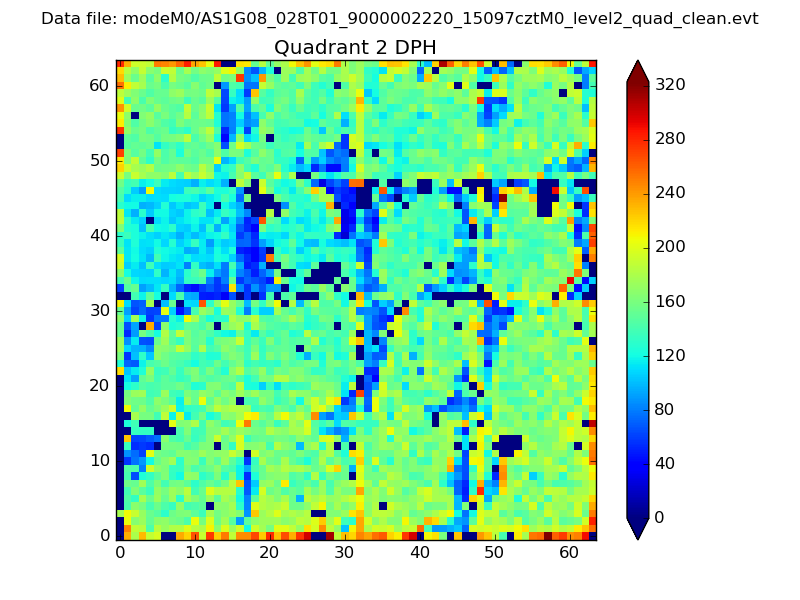 |
Quadrant C |
| Plot type | Count rate plots | Images |
|---|---|---|
| Comparison with Poisson distribution Blue bars denote a histogram of data divided into 1 sec bins. Red curve is a Poisson curve with rate = median count rate of data. |
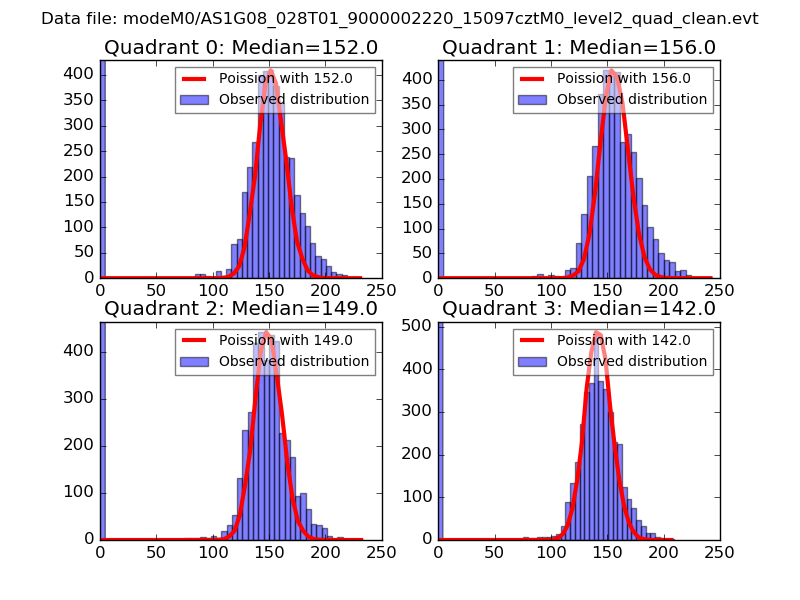 |
 |
| Quadrant-wise count rates Data is divided into 100 sec bins |
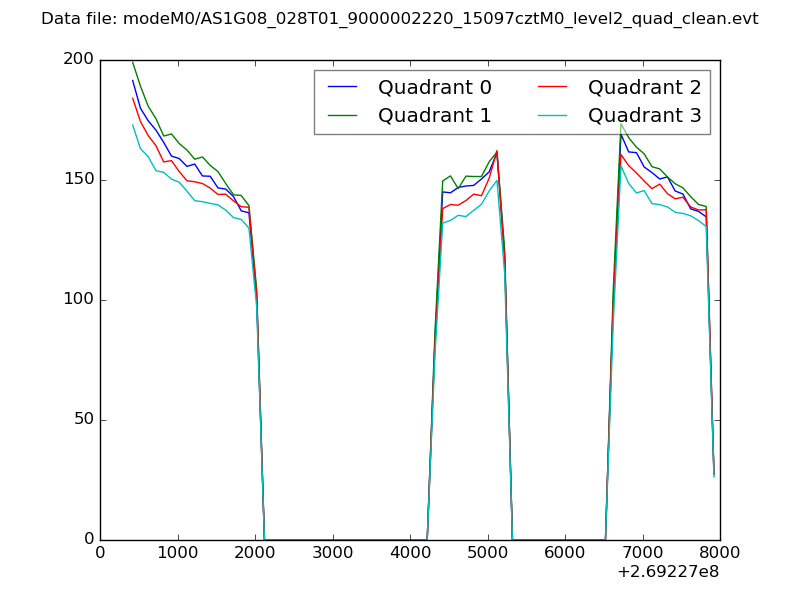 |
|
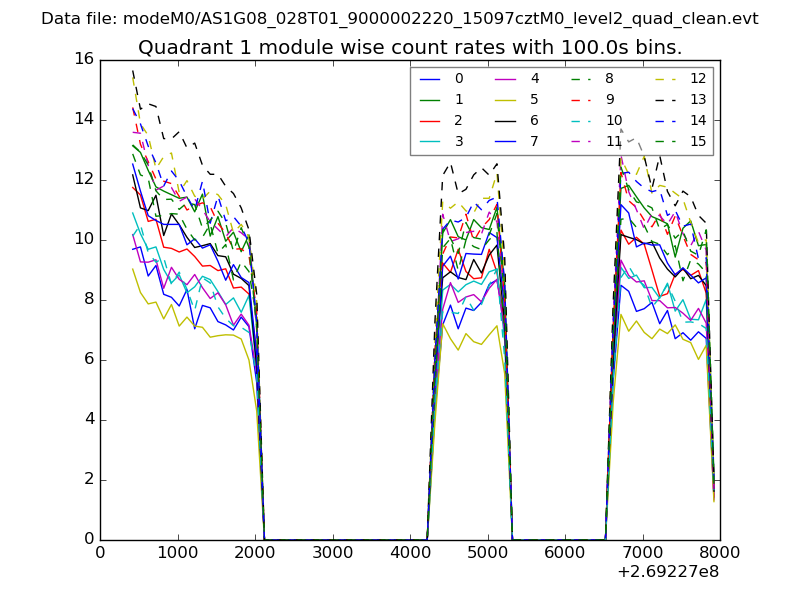
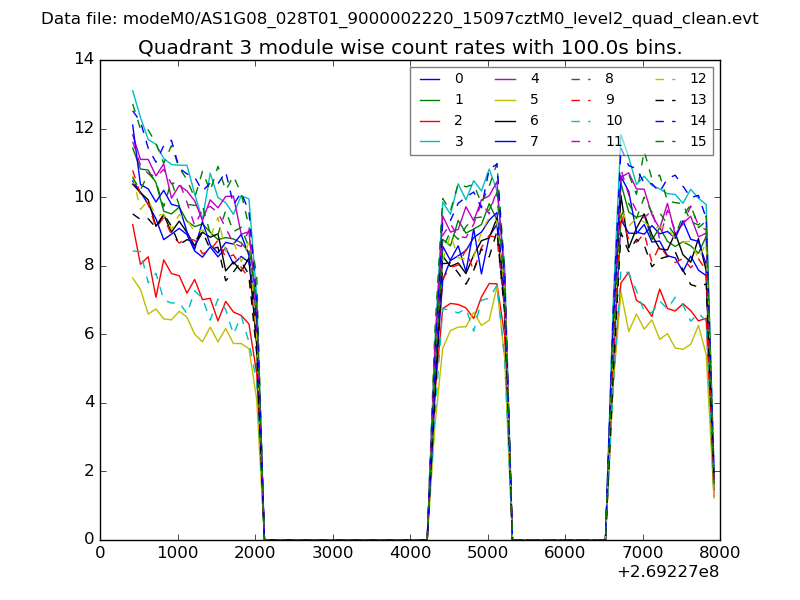
| Module-wise count rates for Quadrant A Data is divided into 100 sec bins |
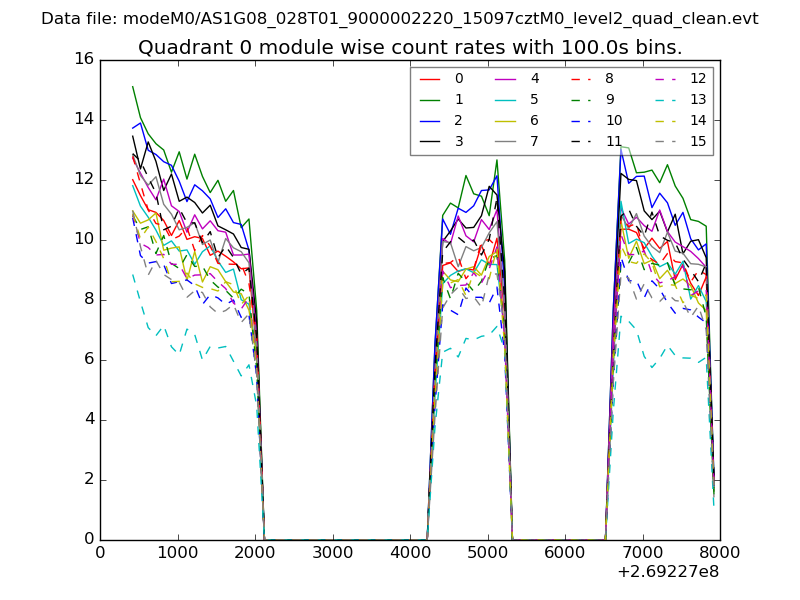 |
 |
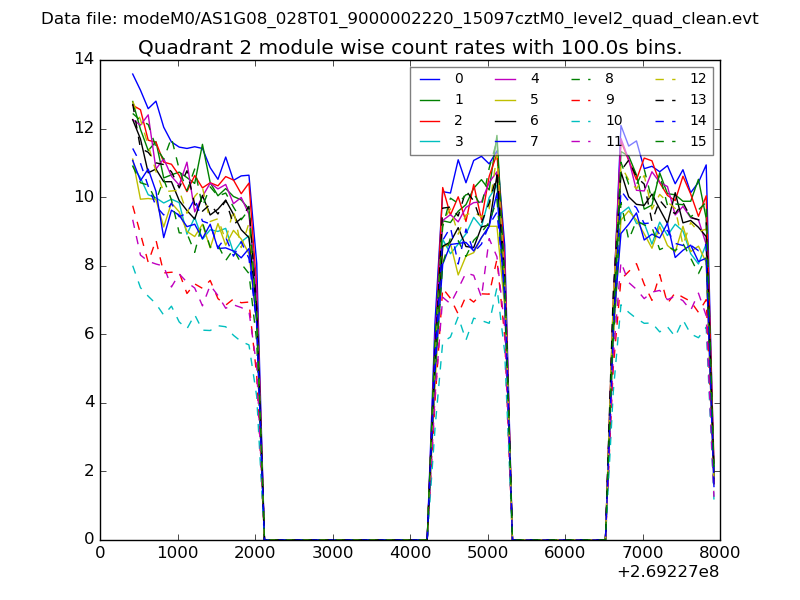
| Module-wise count rates for Quadrant B Data is divided into 100 sec bins |
 |
 |
| Module-wise count rates for Quadrant C Data is divided into 100 sec bins |
 |
 |
| Module-wise count rates for Quadrant D Data is divided into 100 sec bins |
 |
 |
| Parameter | Plot |
|---|---|
| CZT HV Monitor | 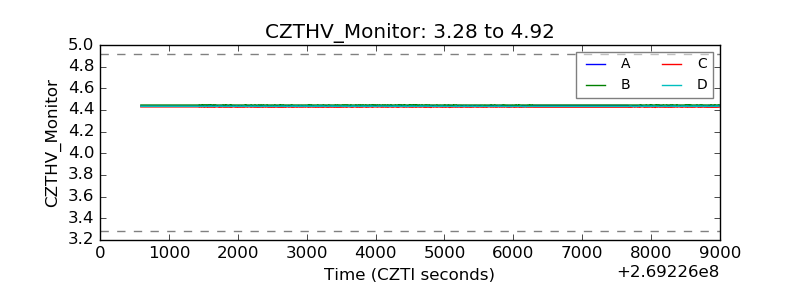 |
| D_VDD | 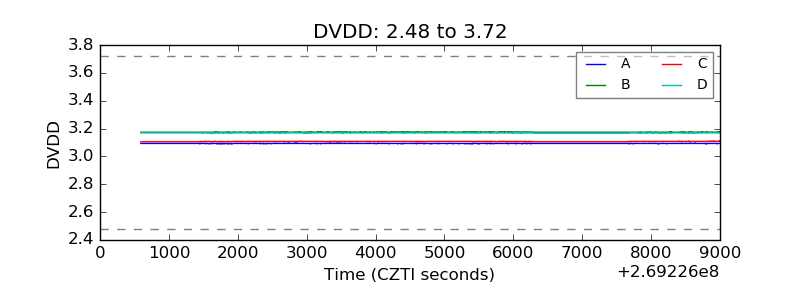 |
| Temperature 1 | 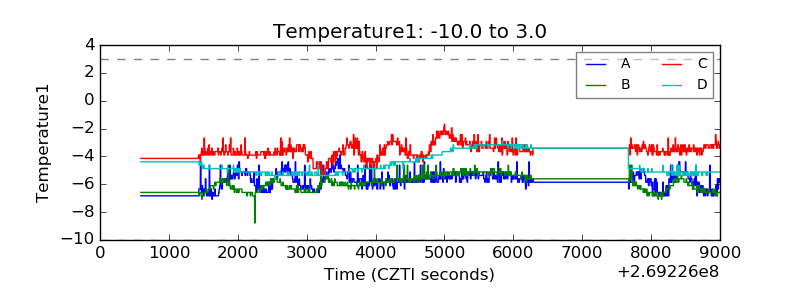 |
| Veto HV Monitor | 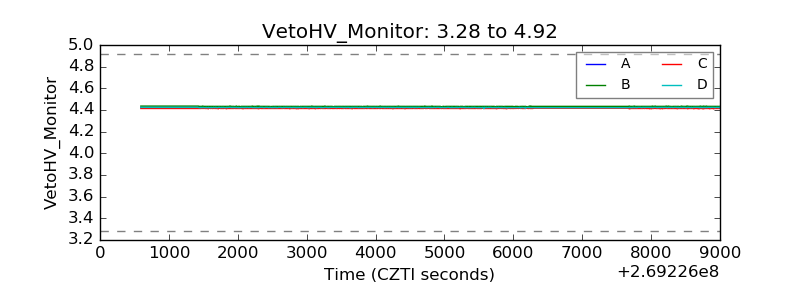 |
| Veto LLD | 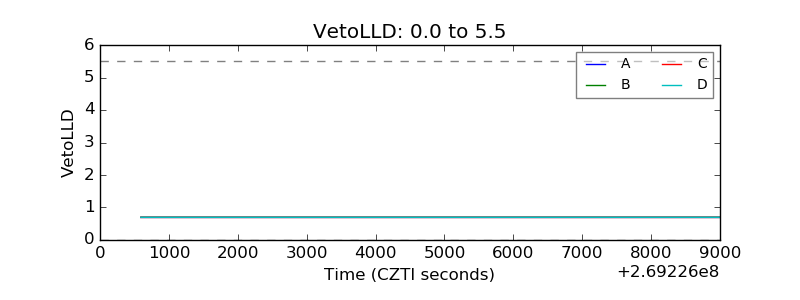 |
| Alpha Counter | 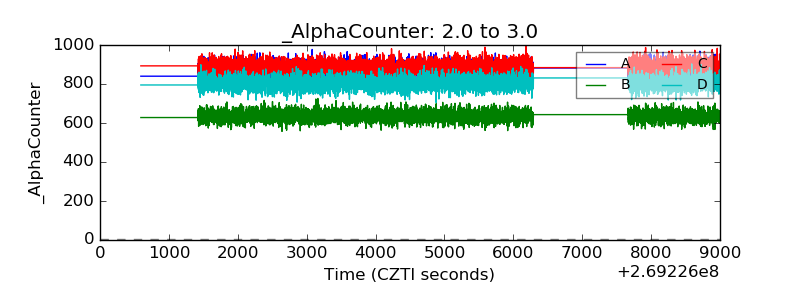 |
| _CPM_Rate | 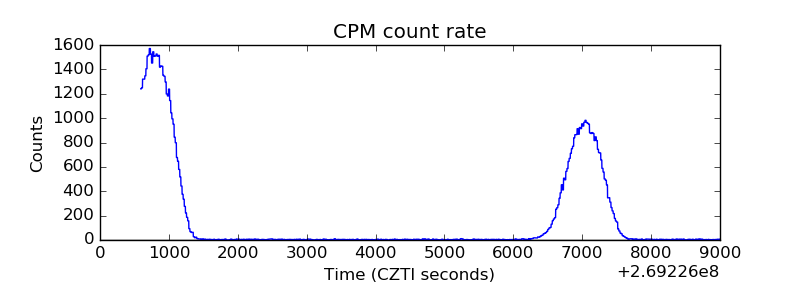 |
| CZT Counter | 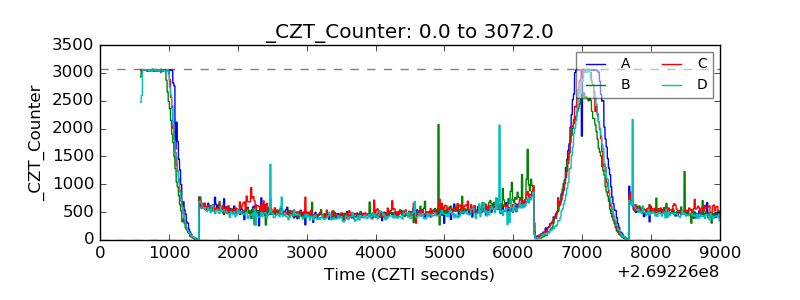 |
| +2.5 Volts monitor | 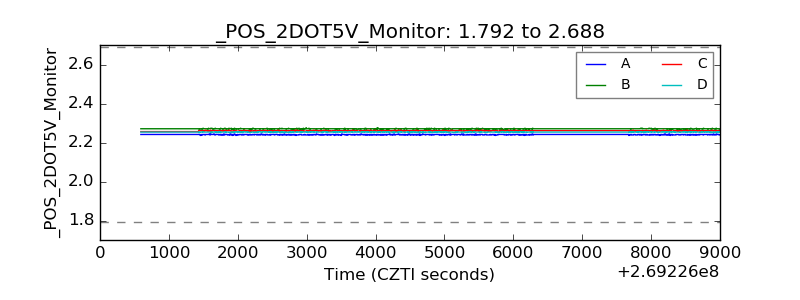 |
| +5 Volts monitor |  |
| _ROLL_ROT | 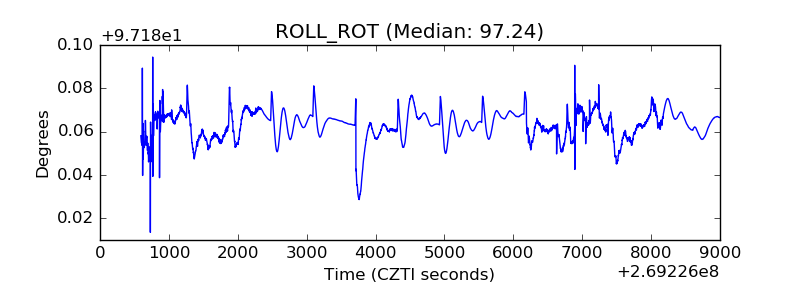 |
| _Roll_DEC | 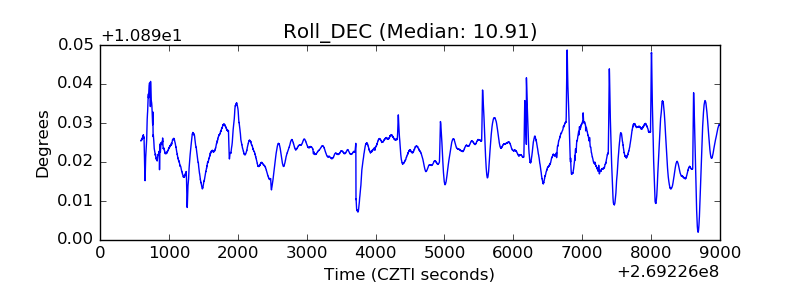 |
| _Roll_RA | 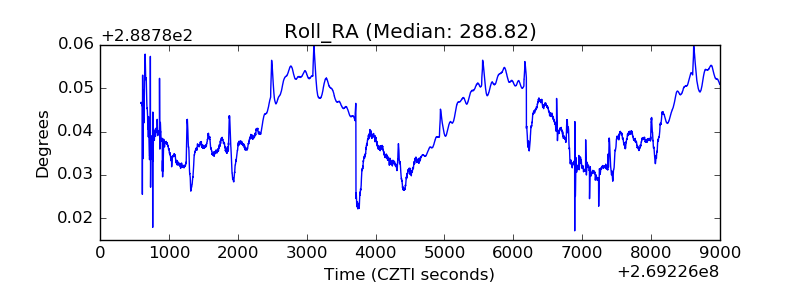 |
| Veto Counter | 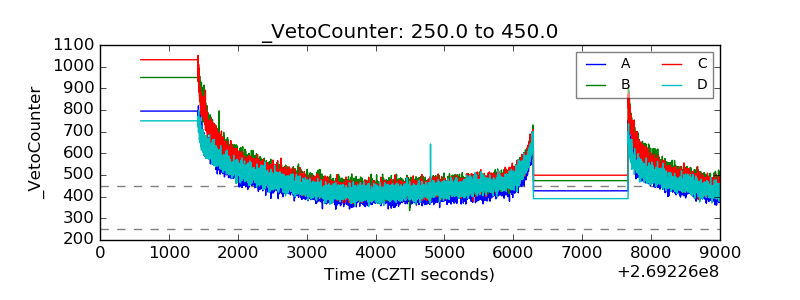 |